University of Pennsylvania
ScholarlyCommons
Publicly Accessible Penn Dissertations
Fall 12-22-2010
The Development, Characterization and
Implementation of a Reactive Oxygen
Species-Responsive Ratiometric Bioluminescent Reporter
and Its Use As A Sensor for Programmed Cell
Death
Julie Czupryna
University of Pennsylvania, [email protected]
Follow this and additional works at:http://repository.upenn.edu/edissertations Part of theBioimaging and Biomedical Optics Commons
Recommended Citation
Czupryna, Julie, "The Development, Characterization and Implementation of a Reactive Oxygen Species-Responsive Ratiometric Bioluminescent Reporter and Its Use As A Sensor for Programmed Cell Death" (2010).Publicly Accessible Penn Dissertations. 461.
The Development, Characterization and Implementation of a Reactive
Oxygen Species-Responsive Ratiometric Bioluminescent Reporter and Its
Use As A Sensor for Programmed Cell Death
Abstract
The process of programmed cell death (PCD) is a prevalent area of scientific research and is characterized by a highly complex proteolytic cascade. PCD is involved in development, homeostasis and the immune response. Further, unregulated PCD has been implicated in various, often, devastating pathologies including cancer, autoimmune diseases and neurodegenerative disorders. The importance of PCD in human health and disease has led to the widespread utilization of genetically encoded reporters for the non-invasive imaging of PCD in vitro and in vivo; however, it is currently not well understood whether the reporters themselves are
susceptible to inactivation and/or degradation during PCD. Molecular reporters that do exhibit an
unexpected sensitivity to their environment could lead to ambiguous findings and/or inaccurate conclusions. Interestingly, we have found that the commonly used bioluminescent reporter protein, Firefly Luciferase (f Luc), exhibits a rapid loss in activity in cells undergoing PCD. In contrast, a variant of Renilla Luciferase, RLuc8, demonstrated quite stable activity under the same conditions. Following extensive inhibition analyses, it was determined that reactive oxygen species (ROS), particularly hydrogen peroxide (H2O2), play a large role in the disparity between f Luc and RLuc8 activity, in cells undergoing PCD. ROS are natural byproducts of oxygen metabolism that are normally regulated by antioxidants; if the balance between ROS and
antioxidants becomes skewed, cells can enter a state of ‘oxidative stress.’ It has been reported that many cases of PCD are associated with elevated levels of ROS. Consistent with these reports, when f Luc and RLuc8 were intracellularly coexpressed, it was found that the bioluminescence ratio, RLuc8:f Luc, served as a useful metric to report on caspase-dependent and –independent PCD in vitro and in vivo in an ROS-mediated manner. It is envisioned that this ratiometric reporter could have widespread impact on research endeavors involving the aforementioned maladies, including therapeutic development and evaluation.
Degree Type Dissertation
Degree Name
Doctor of Philosophy (PhD)
Graduate Group Bioengineering
First Advisor Andrew Tsourkas
Keywords
Subject Categories
THE DEVELOPMENT, CHARACTERIZATION AND IMPLEMENTATION OF A REACTIVE OXYGEN SPECIES-RESPONSIVE RATIOMETRIC
BIOLUMINESCENT REPORTER AND ITS USE AS A SENSOR FOR PROGRAMMED CELL DEATH
Julie Czupryna
A DISSERTATION
in
Bioengineering
Presented to the Faculties of the University of Pennsylvania
in
Partial Fulfillment of the Requirements for the
Degree of Doctor of Philosophy
2010
____________________________________________ Andrew Tsourkas, Ph.D. – Dissertation Supervisor
__________________________________________________ Susan S. Margulies, Ph.D. – Graduate Group Chairperson
Dissertation Committee
This thesis is dedicated to my Babci, Eleanor Czupryna
&
to my sister-in-law Kirsten Czupryna
These two women have inspired me more than they ever knew and I can only hope that
Acknowledgements
First, I would like to thank my thesis advisor, Dr. Andrew Tsourkas, who has
provided me with the knowledge, encouragement and skill set required for this rigorous
endeavor. His enthusiasm for molecular imaging has never waned since my first day in
the lab and because of that, I have been inspired to become a better scientist and to
continue performing research in this field. Throughout my time here, Dr. Tsourkas has
been a constant source of academic, personal and professional support and I cannot
express how much it is appreciated.
I would also like to thank the members of my thesis committee: Dr. Casim Sarkar,
Dr. Jason Burdick and Dr. Jim Delikatny. Dr. Sarkar has been especially helpful
regarding many of the protein studies involved in this work. Dr. Burdick was a member
of my qualifier committee, and has been a great source of guidance since (way back)
then. Dr. Delikatny is a relatively new member of my committee, but experiences with
him at molecular imaging conferences have helped me gain new perspectives on the field
of molecular imaging.
There are many members of the Tsourkas Lab that I have to thank. I would
especially like to thank Dr. Daniel Thorek, my desk buddy from day one, who became
one of my best friends here and who I can honestly say I probably could not have gotten
through grad school without. Dr. Antony Chen was the third member of the original
three who started in the Tsourkas lab and his work ethic was inspiring. I would also like
to thank Drew Elias, Sam Crayton, Rob Warden, Zhiliang Cheng, Ching-Hui Huang,
lab who have provided a source of enjoyment both in and out of the lab, Dalia Levine,
Randi Saunders and Aaron Dominguez.
My friends from high school, college and here at Penn have been such a blessing
and I cannot thank them enough. The friendships of Mary Lynn and Renee, both of
whom I’ve known since kindergarten, and Shelly, Andrea and Katrina from college have
provided a constant supply of support and laughter. My friends from Penn, Annie, Cathy,
Steph and Derek deserve many thanks for all of the enjoyable experiences I’ve been
lucky enough to have with them, especially cookouts, tailgating and Phillies games.
Thanks to my knitting club (wine drinking club?) friends, Jamie, Elena, April, Shannon,
Lara and Heather. I would especially like to thank Ross for sharing my sense of humor
and quirkiness, for being a guinea pig during my cooking adventures and most
importantly for his unwavering encouragement throughout my final year of grad school.
Finally, I would like to thank my amazing family for their support, love,
generosity and encouragement during this process. Thanks to my godmother Aunt
Doreen, Aunt Debby, Uncle Rob, Aunt Nancy, Uncle Kenny, cousins Kim and Missi and
nephew Michael. I have shared many fun times in Philly with my Uncle Nick, Aunt Patti
and cousin Andy and I thank them for everything they’ve done for me. Thank you to my
brother Steve, who has been there for me no matter what. Finally, the unconditional love
and support of my parents, Tim and Paula, are the reasons why I am where I am today,
ABSTRACT
THE DEVELOPMENT, CHARACTERIZATION AND IMPLEMENTATION OF
A REACTIVE OXYGEN SPECIES-RESPONSIVE RATIOMETRIC
BIOLUMINESCENT REPORTER AND ITS USE AS A SENSOR FOR
PROGRAMMED CELL DEATH
Julie Czupryna
Advisor: Andrew Tsourkas, Ph.D.
The process of programmed cell death (PCD) is a prevalent area of scientific research and
is characterized by a highly complex proteolytic cascade. PCD is involved in
development, homeostasis and the immune response. Further, unregulated PCD has been
implicated in various, often, devastating pathologies including cancer, autoimmune
diseases and neurodegenerative disorders. The importance of PCD in human health and
disease has led to the widespread utilization of genetically encoded reporters for the
non-invasive imaging of PCD in vitro and in vivo; however, it is currently not well understood
whether the reporters themselves are susceptible to inactivation and/or degradation during
PCD. Molecular reporters that do exhibit an unexpected sensitivity to their environment
exhibits a rapid loss in activity in cells undergoing PCD. In contrast, a variant of Renilla
Luciferase, RLuc8, demonstrated quite stable activity under the same conditions.
Following extensive inhibition analyses, it was determined that reactive oxygen species
(ROS), particularly hydrogen peroxide (H2O2), play a large role in the disparity between
fLuc and RLuc8 activity, in cells undergoing PCD. ROS are natural byproducts of
oxygen metabolism that are normally regulated by antioxidants; if the balance between
ROS and antioxidants becomes skewed, cells can enter a state of ‘oxidative stress.’ It has
been reported that many cases of PCD are associated with elevated levels of ROS.
Consistent with these reports, when fLuc and RLuc8 were intracellularly coexpressed, it
was found that the bioluminescence ratio, RLuc8:fLuc, served as a useful metric to report
on caspase-dependent and –independent PCD in vitro and in vivo in an ROS-mediated
manner. It is envisioned that this ratiometric reporter could have widespread impact on
research endeavors involving the aforementioned maladies, including therapeutic
TABLE OF CONTENTS
Chapter 1: Introduction to bioluminescence imaging, programmed cell death and
reactive oxygen species ... 1
1.1 Introduction... 1
1.2 Background ... 2
1.2.1 Bioluminescence Imaging... 2
1.2.1a Overview ... 2
1.2.1b Types of luciferases and their substrates ... 3
1.2.1c BLI: general considerations ... 5
1.2.2 Programmed Cell Death... 8
1.2.2a Overview ... 8
1.2.2b Current Sensors for Apoptosis ... 12
1.2.2c Current Sensors for Caspase-Independent PCD ... 22
1.2.3 Reactive Oxygen Species, Oxidative Stress and Cell Death ... 23
1.2.3a Overview ... 23
1.2.3b Protein modification, damage and degradation by ROS... 24
1.2.3c Common Probes for Imaging ROS/Oxidative Stress... 28
1.2.4 The Role of ROS/Oxidative Stress in PCD ... 31
1.3 References... 32
Chapter 2: Proposed Strategy and Experimental Methods... 53
2.1 Proposed Strategy ... 53
2.2.2 RBS plasmid vector construction... 56
2.2.3 Reverse RBS plasmid vector construction... 57
2.2.4 Cell culture... 58
2.2.5 Lentiviral particle production and stable cell line creation... 59
2.2.6 Cellular stress and inhibition assays ... 59
2.2.7 Cellular bioluminescence assays... 60
2.2.8 Cellular bioluminescence imaging... 61
2.2.9 Cellular bioluminescence image analysis ... 61
2.2.10 Cell death assays ... 62
2.2.11 Proteasome inhibition control assay ... 62
2.2.12 Protease inhibition control assays ... 63
2.2.13 Superoxide (O2•-) scavenger control assay ... 64
2.2.14 Hydroxyl Radical (•OH) scavenger/inhibitor control assay ... 64
2.2.15 Hydrogen peroxide (H2O2)-related inhibitor control assays ... 65
2.2.16 Quantitative real-time PCR (qRT-PCR) ... 66
2.2.17 Western blot analysis ... 66
2.2.18 Intracellular hydrogen peroxide detection ... 67
2.2.19 RLuc8 and fLuc protein purification ... 68
2.2.20 In vitro bioluminescence assays on purified proteins ... 69
2.2.21 SDS-PAGE gels on purified proteins treated with H2O2... 70
2.2.25 Animal image analysis ... 73
2.3 References... 74
Chapter 3: Development of the Ratiometric Bioluminescent Sensor (RBS) and its response to cellular stress in HeLa cells... 75
3.1 Abstract ... 75
3.2 Introduction... 75
3.3 Results... 77
3.4 Discussion ... 88
3.5 References... 90
Chapter 4: The RBS mechanism relies on hydrogen peroxide... 95
4.1 Abstract ... 95
4.2 Introduction... 95
4.3 Results... 97
4.4 Discussion ... 114
4.5 References... 120
Chapter 5: The RBS can detect caspase-dependent PCD in multiple cell lines using multiple inducers... 128
5.1 Abstract ... 128
5.2 Introduction... 128
5.3 Results... 130
5.4 Discussion ... 143
Chapter 6: The RBS can detect caspase-independent PCD through pathways
involving ROS production, Bcl-2 downregulation and mitochondrial membrane
permeabilization... 151
6.1 Abstract ... 151
6.2 Introduction... 151
6.3 Results... 153
6.4 Discussion ... 162
6.5 References... 164
Chapter 7: The RBS detects programmed cell death in vivo... 168
7.1 Abstract ... 168
7.2 Introduction... 168
7.3 Results... 170
7.4 Discussion ... 172
7.5 References... 174
Chapter 8: Overall discussion, future directions and concluding remarks... 178
8.1 Overall Discussion ... 178
8.1.1 Development of the Ratiometric Bioluminescent Sensor (RBS) and its response to cellular stress in HeLa cells ... 178
8.1.2 The RBS mechanism relies on ROS, particularly H2O2... 182
8.1.4 The RBS can detect caspase-independent PCD through pathways involving
ROS production, Bcl-2 downregulation and mitochondrial membrane
permeabilization... 193
8.1.5 The RBS detects programmed cell death in vivo... 196
8.2 Future Directions ... 197
8.3 Concluding remarks ... 200
LIST OF TABLES
Table 1.1. Common luciferases and selected characteristics. ... 4
Table 1.2. Pathogenic conditions related to PCD... 12
Table 1.3. Summary of leuco dyes and fluorescein derivatives for ROS detection... 29
Table 2.1. Summary of reagents... 60
LIST OF FIGURES
Figure 1.1. Emission spectra of various bioluminescent proteins... 5
Figure 1.2. Illustration of caspase-dependent and caspase-independent PCD pathways.11 Figure 1.3. Schematic of a fluorogenic peptide probe for caspase-3. ... 14
Figure 1.4. Schematic of FRET and its use in a reporter for caspase-3 activity... 16
Figure 1.5. Schematic of ER-fLuc-ER sensor for caspase-3. ... 17
Figure 1.6. Schematic of split fLuc reporter for caspase-3 ... 19
Figure 1.7. Schematic representing potential pathways for intracellular protein modification and/or degradation ... 24
Figure 2.1. Schematic of RBS... 54
Figure 2.2. Plasmid map of the RBS... 57
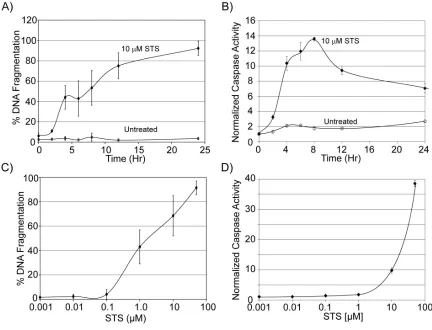
Figure 3.1. Effect of staurosporine on fLuc and RLuc bioluminescence. ... 78
Figure 3.2. Caspase-3 activity during a time course of STS treatment... 79
Figure 3.3. Response of fLuc to STS or STS + PBT treatment ... 80
Figure 3.4. Effect of STS on fLuc5 compared to wt fLuc ... 81
Figure 3.5. Effect of STS on RLuc8 compared to wt RLuc... 82
Figure 3.6. Response of RBS-HeLa cells to STS ... 84
Figure 3.7. Analysis of RLuc8:fLuc ratio as a function of cell number and time ... 85
Figure 3.8. Response of reverse RBS-HeLa cells to STS... 86
Figure 3.9. Commercial PCD assays on STS-treated RBS-HeLa cells. ... 87
Figure 4.1. Assessment of mRNA and protein levels in STS-treated RBS-HeLa cells... 98
Figure 4.2. RBS response to proteasome inhibition... 99
Figure 4.3. RBS response to various protease inhibitors ... 100
Figure 4.4. RBS response to O2·- scavengers... 101
Figure 4.5. RBS response to ·OH scavengers. ... 102
Figure 4.6. RBS response to H2O2 related scavengers... 103
Figure 4.7. RBS response to an ONOO- scavenger, uric acid ... 104
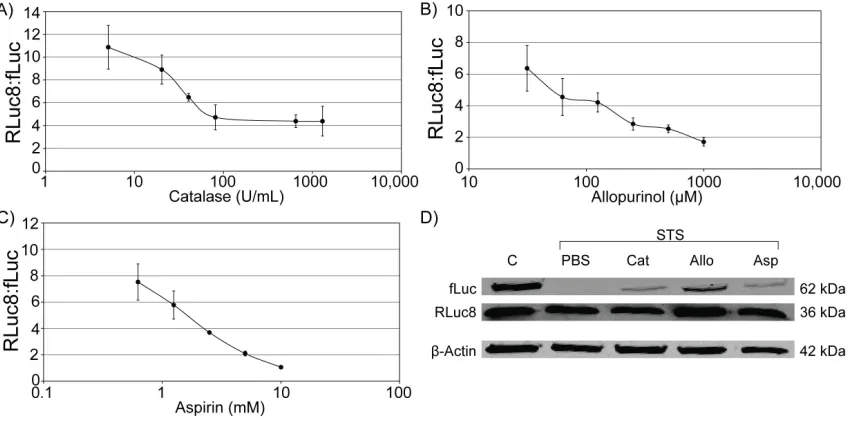
Figure 4.8. Dose response and Western blot analysis of STS-treated cells to H2O2-related scavengers ... 105
Figure 4.9. Analysis of intracellular H2O2, exogenous application of H2O2, and the hypoxanthine-xanthine oxidase reaction... 107
Figure 4.10. Summary of RBS-HeLa responses to allopurinol pretreatment ... 109
Figure 4.11. Response of purified fLuc and RLuc8 proteins to H2O2 visualized with SDS-PAGE ... 110
Figure 4.12. Bioluminescence response of purified fLuc and RLuc8 proteins to H2O2. ... 111
Figure 4.13. Analysis of protein carbonylation in STS-treated RBS-HeLa cells and H2O2 -treated fLuc and RLuc8 proteins... 113
Figure 5.1. Response of RBS-MCF7 cells to increasing STS dosage. ... 131
Figure 5.2. Response of STS-treated RBS-MCF7 cells to allopurinol pretreatment ... 133
Figure 5.5. Response of RBS-293T/17 to treatment with PBS (untreated control) or 10
µM STS over the course of 24 hours ... 138
Figure 5.6. Effect of allopurinol on PBS (-STS) and STS treated RBS-293T/17 cells. 139 Figure 5.7. Effects of DOX and Cpt on RBS-HeLa cells ... 140
Figure 5.8. Response of commercial cell death assays in RBS-HeLa cells treated with DOX or Cpt... 141
Figure 5.9. Response of DOX and Cpt treated RBS-HeLa cells to allopurinol pretreatment ... 143
Figure 6.1. Response of RBS-HeLa cells to increasing doses of sodium selenite... 154
Figure 6.2. Response of RBS-MCF7 cells to increasing doses of sodium selenite ... 156
Figure 6.3. Response of RBS-MCF7 cells to increasing doses of resveratrol ... 158
Figure 6.4. Effect of allopurinol on RBS-HeLa and RBS-MCF7 cells treated with SSe and RBS-MCF7 cells treated with Res ... 160
Figure 6.5. Extent of DNA fragmentation in RBS cells pretreated with allopurinol prior to the addition of SSe or Res... 161
Figure 7.1. Assessment of RBS performance in vivo... 171
Chapter 1: Introduction to bioluminescence imaging,
programmed cell death and reactive oxygen species
1.1 Introduction
Complete understanding of physiology and disease states requires the capability
to monitor specific cellular and molecular phenomena over biologically relevant time
scales. Molecular imaging technologies provide investigators with the ability to
non-invasively examine a wide variety of biological processes, both in vitro and in animal
models. Bioluminescence imaging (BLI) is a molecular imaging modality wherein
luciferase enzymes oxidize a substrate to produce light. Attributes of BLI include high
sensitivity, cost-effectiveness, simplicity, virtually non-existent background signals,
high-throughput screening potential and ability to acquire temporal information in cells and in
live animal models. While safety concerns regarding transgene expression preclude BLI
usage in humans, it remains a powerful tool for pre-clinical in vivo imaging studies.
Luciferases and their substrates have been engineered to report on gene
expression levels, promoter activity and various other molecular processes, including
programmed cell death (PCD), which is known as an exquisitely regulated ‘cell suicide’
mechanism. PCD is the primary contributor to the removal of excessive and damaged
cells and plays a role in development, aging and the immune response. However, many
pathologies can result from unregulated PCD including cancer, Alzheimer’s disease and
autoimmune disorders. Thus, the ability to monitor aberrant PCD could have widespread
We have found that in cells undergoing PCD, the activity of wild-type Firefly
Luciferase (fLuc) is rapidly lost, and under the same conditions the activity of a Renilla
Luciferase variant (RLuc8) remains relatively stable (Chapter 3). Investigation into the
mechanism behind this disparity suggested that reactive oxygen species (ROS),
particularly hydrogen peroxide (H2O2), play a dominant role (Chapter 4). Therefore it
was hypothesized that when fLuc and RLuc8 were coexpressed in cells, their activity
differential could be used in a ratiometric manner (i.e. RLuc8:fLuc) to relay information
on intracellular ROS levels. It is well established that certain chemotherapeutic agents
can generate ROS in their induction of cell death and that ROS often serve as mediators
in caspase-dependent and –independent pathways. Consistent with these findings, we
have found that levels of intracellular H2O2 increased in multiple cell types treated with a
variety of PCD inducers and that this increase correlated well with RLuc8:fLuc ratios
(Chapter 5 and Chapter 6). The implementation of the ratiometric reporter in murine
models demonstrated that it was capable of detecting PCD in drug-treated tumors and
that this detection was related to intratumoral ROS levels (Chapter 7). In this chapter,
extensive background is provided on BLI, PCD and ROS.
1.2 Background
1.2.1 Bioluminescence Imaging
1.2.1a Overview
in real-time and over biologically relevant time scales. Molecular imaging techniques
can facilitate the ability of investigators to non-invasively scrutinize the spatiotemporal
dynamics of specific biological processes without sacrificing cells or animals (see (1) for
extensive review). The field of molecular imaging encompasses many modalities
including magnetic resonance imaging (MRI), optical imaging, signal photon emission
spectroscopy (SPECT), ultrasound, and positron emission tomography (PET).
Bioluminescence imaging (BLI) is an optical molecular imaging modality that harnesses
the light produced during enzyme (luciferase)-mediated oxidation of a substrate (e.g.
luciferin or coelenterazine) when the enzyme is expressed in cells, tissues or animals (see
(2) for review). BLI has been utilized in studies examining tumor growth and
metastasis(3), gene therapy(4), cell tracking(5), infection progression(6), gene
expression(7) and toxicology(8), among others.
1.2.1b Types of luciferases and their substrates
Various types of luciferases have been identified across diverse phyla; however,
only a few of these have been characterized sufficiently for mammalian use. Even
though structures, sizes, substrates and emission wavelengths of these enzymes are quite
varied, their mechanisms of light production are generally similar: during the oxidation
of luciferin or coelenterazine by luciferase, an excited intermediate is generated and upon
its relaxation to ground state, it emits a photon of light(9). The most commonly used
Table 1.1. Common luciferases and selected characteristics. Adapted from (2).
Luciferase Luciferin
Peak emission (nm)
Size
(kDa) Comments Reference(s)
Firefly (fLuc)
D-luciferin 612 61 Codon-optimized for mammalian expression; requires ATP (10) Click beetle red (cbRed)
D-luciferin 611 61 Requires ATP (10, 11)
Click beetle green (cbGreen)
D-luciferin 544 61 Requires ATP (10, 11)
Renilla reniformis
(RLuc)
Coelenterazine 480 36 Does not require ATP; codon-optimized for mammalian expression
(9, 11, 12)
Gaussia princes
(gLuc)
Coelenterazine 480 36 Does not require ATP; naturally secreted from cells
(12)
The luciferases from Firefly (fLuc) and Renilla reniformis (RLuc) are two of the
most widely used bioluminescent proteins in current research. Fluc emits light at ~600
nm making it more suitable for in vivo imaging compared with the ~480 nm light emitted
by RLuc, as fLuc photons are less absorbed by animal tissue. To produce light, fLuc
must react with its substrate, luciferin, in the presence of ATP, oxygen and magnesium.
RLuc requires its substrate, coelenterazine, and oxygen to produce light. The emission
Despite the low emission wavelength of RLuc, both fLuc and RLuc are
commonly used together in both cell culture(13) and in vivo(14), with RLuc often serving
as a transfection control for studies involving fLuc under the control of a specific
promoter, and vice verse. The distinct substrates of these enzymes also allow for their
use in this manner since after washing or clearance of the substrate for the first enzyme
examined, a second substrate may be administered to specifically examine the second
enzyme (see Table I). An alternative to washing/clearance involves using spectral
separation to distinguish the signal from each protein. Each luciferase emits at a different
wavelength of light; thus if the imaging equipment possesses emission filters appropriate
for each enzyme, substrates can be administered at the same time, and each signal can be
spectrally separated.
1.2.1c BLI: general considerations
There are many advantages of utilizing BLI as a molecular imaging modality.
Since bioluminescent proteins are genetically encoded, once validated, they can be
employed in a range of vectors to investigate a wide variety of intracellular
occurs in cells undergoing thermal and other stresses and can abrogate resulting cellular
damage and programmed cell death (see (18) for review). This group used transgenic
mice expressing fLuc under the control of an HSP promoter to assess spatiotemporal
patterns of HSP70 expression after thermal stress induced by laser irradiation(17). BLI
has been used to investigate many other promoters in addition to HSP, including β
-catenin promoters(19), insulin promoters(20), ubiquitin promoters(21) and hepatitis B
virus promoters(22).
BLI has been used in conjunction with positron emission tomography (PET) to
examine tumor hypoxia and related molecular events (15). Tumor hypoxia was
monitored using a hypoxia-sensitive PET tracer, followed by investigation of hypoxia
inducible factor (HIF), a transcription factor that helps tumor cells adapt to low oxygen
environments(23), using BLI. Specifically, a fusion protein of HIF-1α-luciferase was
monitored to assess the stability of HIF-1α, the subunit of HIF that is a target for
degradation under normoxic conditions and stabilization under hypoxic conditions(24).
In the same study, the gene encoding fLuc was placed downstream of a hypoxia response
element (HRE) promoter to monitor HIF-driven gene expression.
The optical properties of some bioluminescent proteins allow for depths of up to a
few centimeters to be imaged in vivo(25, 26). The emission wavelength of fLuc is ~600
nm, making it less likely than fluorescent light to be attenuated in animal tissue. Tumor
cells expressing fLuc have been imaged in rat colon(25) and mouse lungs(26), illustrating
to fluorescence. For example, when using fluorescence imaging, the autofluorescence of
tissues causes unwanted background signal, effectively reducing this ratio.
In addition to its cost-effectiveness, robustness and simplicity, BLI has recently
proven to be quite useful in high-throughput screening assays(27-29). For example,
malignant cells expressing fLuc were cultured with non-fLuc stromal cells and this
co-culture was screened with anti-neoplastic candidates(27). Here, it was possible to
specifically identify the effects of the compounds on malignant cells in an environment
more representative of in vivo conditions as tumor-stroma interactions play key roles in
tumor biology(30, 31). This ability to distinguish between cancerous and normal cells
using this method holds an advantage over traditional viability assays (discussed later)
where the high background of the stromal cells could skew information on malignant cell
viability.
However, like any imaging modality, BLI possesses certain disadvantages that
should be considered before its use in study design. Safety concerns preclude genetically
encoded reporters (including bioluminescent proteins) from being used in humans, with
the exception of gene therapy. Additionally, while the multi-centimeter depth penetration
of bioluminescent proteins is greater than that of fluorescent molecular reporters, it
nonetheless limits their in vivo application to small rodents. Another consideration
regarding BLI is the potential for the proteins themselves to interfere with intracellular
processes and possible phenotypic changes. Notably, it has been shown that colon cancer
cells expressing fLuc were unable to grow into tumors in immunocompetent rats as
issues with substrate administration include altered substrate catalysis and
pharmacokinetics due to disease states and cellular transporters, respectively. The tumor
microenvironment is often hypoxic, and since the fLuc-luciferin reaction is oxygen
dependent, this reaction may be impeded and resulting light output diminished.
Additionally, the cellular membrane pumps ABCG2(29) and MDR1 P-glycoprotein(33)
have been shown to transport luciferin and coelenterazine, respectively, out of cells,
potentially hindering light output of the bioluminescent enzymes. Taken together, these
issues can lead to inaccurate findings and ambiguous conclusions.
1.2.2 Programmed Cell Death
1.2.2a Overview
Programmed cell death (PCD) is a major contributor to the removal of excessive
and damaged cells through an exquisitely regulated ‘cell suicide’ mechanism and is an
essential process that is involved in development(34), aging(35), homeostasis(36) and the
immune response(37). Apoptosis, or Type I PCD, is mechanistically characterized by a
proteolytic cascade involving cysteine-aspartic proteases (caspases)(38); these caspases
can be distinguished by the specific amino acid sequences wherein they cleave(39).
Many types of caspases can be activated during apoptosis, however, the activation of
caspase-3, an effector caspase, is required to complete the process (40); this necessity
makes caspase-3 an often utilized target in studies assessing PCD. Additional
While apoptosis has been thoroughly characterized and is generally accepted as
the most prevalent form of PCD, a number of alternative cell death pathways have been
identified and are referred to as ‘caspase-independent cell death pathways’. These
pathways serve many purposes in vivo including embryonic removal of interdigital
webs(41), the death of chondrocytes controlling bone growth(42), and the negative
selection of lymphocytes(34, 35).
One form of caspase-independent PCD involves the mitochondria. Under certain
stimuli the mitochondria release the apoptosis-inducing factor (AIF) from the
intermembrane space(43); AIF enters the nucleus and eventually causes the degradation
of chromatin into large (50 kb) chromatin fragments, in contrast to the oligonucleosomal
DNA fragments that are formed when certain DNase’s are activated by caspases(43, 44).
The exact mechanism behind chromatin degradation by AIF remains unknown. Another
mitochondrial-related PCD mechanism involves signaling from the tumor necrosis factor
receptor 1 resulting in mitochondrial production of reactive oxygen species (ROS) and
necrosis-like PCD(40).
Autophagy, or type II PCD, is a type of caspase-independent cell death that
mechanistically manifests cellular metabolism through the cell’s own lysosomal
machinery (see (45) for review). In cells undergoing type II PCD, autophagic vesicles
are formed to engulf various cytoplasmic components and these vesicles subsequently
fuse with lysosomes to form autophagolysosomes. Various digestive enzymes are
present in the lysosomal machinery, including aspartate, zinc and cysteine proteases
multiple roles as it can be a method for cells to adapt to cellular stresses and avoid
apoptosis, or it can be an alternative method of PCD if apoptosis is inhibited(46).
Figure 1.2 illustrates pathways involved in both dependent and
caspase-independent cell death. Caspase-dependent PCD can result from various onslaughts;
however, regardless of induction method, this process is characterized by the activation
of initiator caspases (e.g., caspases-2 and –8), eventually leading to the activation of
effector caspases (e.g., caspase-3). Various stimuli can also induce caspase-independent
PCD, however this type of cell death is usually characterized by increased proteolysis.
Given the myriad processes in which PCD is involved, it is not surprising that
unregulated PCD can result in various devastating pathologies, including autoimmune
diseases, neurodegenerative disorders, and cancer (see (48) for review). Table 1.2 lists
conditions that may result from either increased or inhibited PCD. Accordingly, many
sensors have been developed to monitor and image PCD both in vitro and in vivo with the Figure 1.2. Illustration of caspase-dependent and caspase-independent PCD pathways. Reprinted with
impression that these sensors will aid in the development and evaluation of therapeutics
designed to combat the many ailments associated with unregulated PCD.
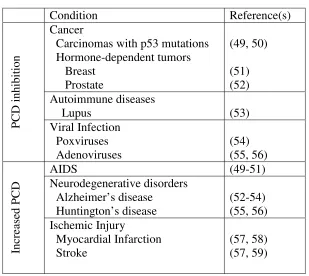
Table 1.2. Pathogenic conditions related to PCD.
Condition Reference(s)
Cancer
Carcinomas with p53 mutations Hormone-dependent tumors Breast Prostate (49, 50) (51) (52) Autoimmune diseases
Lupus (53)
P C D i nhi bi ti on Viral Infection Poxviruses Adenoviruses (54) (55, 56)
AIDS (49-51)
Neurodegenerative disorders Alzheimer’s disease Huntington’s disease (52-54) (55, 56) Inc re as ed P C D Ischemic Injury Myocardial Infarction Stroke (57, 58) (57, 59)
1.2.2b Current Sensors for Apoptosis
Over the past decade, a large number of probes have been specifically developed
for assessing apoptosis in cell culture and animal model studies. Since apoptosis occurs
via a complex signaling cascade that is tightly regulated, these probes have been designed
to take advantage of a number of different molecular targets to identify apoptosis. Some
rely on caspase activity. Phosphatidylserine (PS) targeting agents are designed to detect
PS phospholipids that have flipped from the inner-leaflet to the outer-leaflet of
membranes of cells undergoing apoptosis. Also, various commercial sensors are
available to detect DNA fragmentation levels, dead-cell proteases and enzymes related to
cellular viability. The following subsections will expand upon each of these types of
sensors.
Fluorogenic Peptide Probes
Fluorogenic peptide probes for caspases are typically comprised of a peptidic
protease substrate, e.g. a caspase recognition motif, intervening between two
fluorophores or a fluorophore and a quencher(57-63). Peptidic cleavage by the target
enzyme separates the fluorescent/quenching moieties and the subsequent change in the
fluorescent emission spectrum is used to indicate enzymatic activity. Figure 1.3
represents a schematic of fluorogenic peptide probes for caspase-3; a quencher is attached
to a fluorophore via a DEVD amino acid linkage, effectively quenching the fluorescence
of the excited fluorophore. After caspase-3 cleavage of DEVD (its recognition
While fluorogenic peptide probes represent an important breakthrough in caspase
activation detection, their sensitivity can be less than ideal, due to incomplete quenching
before cleavage or spectral overlap of the two fluorophores in fluorescence resonance
energy transfer (FRET)-based assays. Additional problems are manifested in vivo where
autofluorescence of the living subject and/or pharmaceuticals can further reduce
sensitivity. As both caspase activity and the biodistribution/pharmacokinetics of these
probes affect the fluorescence intensity over time, imaging the temporal dynamics of
apoptosis using these sensors can be challenging. Finally, cytoplasmic delivery of these
probes can present additional issues as they may become non-specifically trapped and
degraded in the lysosomes.
Figure 1.3. Schematic of a fluorogenic peptide probe for caspase-3. A fluorophore is conjugated to a
quenching molecule via the DEVD amino acid sequence. Thus when excited, the fluorophore’s emission is
quenched. However upon caspase-3 mediated cleavage of its target sequence, DEVD, the quencher is
Fluorescent Molecular Reporters
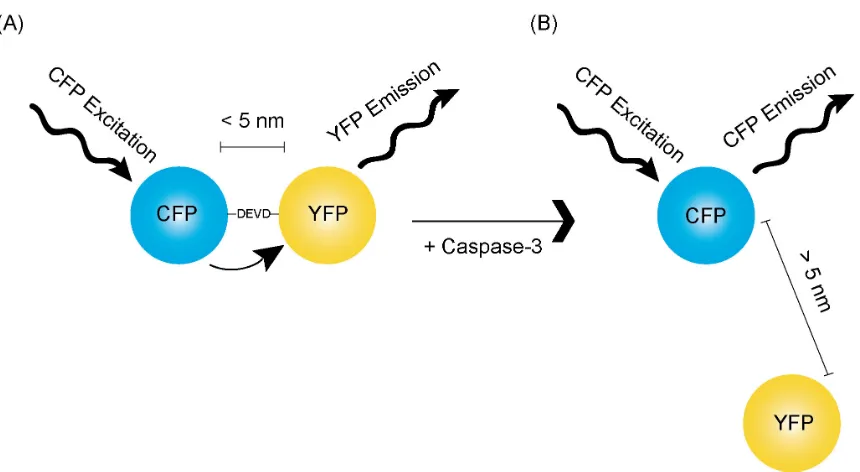
Another category of fluorescent imaging sensors for apoptosis consists of
fluorescent molecular reporters (64-66). These probes are defined by two fluorescent
proteins with overlapping emission-excitation wavelengths that are linked by a
protease-specific recognition sequence. For example, the emission spectrum of cyan fluorescent
protein (CFP) significantly overlaps the excitation spectrum of yellow fluorescent protein
(YFP). When these two proteins are in close proximity (i.e., connected by the amino acid
sequence DEVD), the excitation of CFP results in emission from YFP, as a result of
FRET. This phenomenon is depicted in Figure 1.4A. The tethering of YFP to CFP with
DEVD effectively creates an activatable sensor for caspase-3; with increasing caspase-3
activation, the DEVD sequence is cleaved, the proteins separate, YFP emission decreases
and CFP emission increases with CFP excitation(66). A summary of this mechanism is
illustrated in Figure 1.4B.
Fluorescent molecular reporters are genetically encoded, thus their synthesis costs
are typically less than fluorogenic peptide probes. Another advantage of these reporters
is their constitutive expression reduces their chances of lysosomal degradation and
endosomal entrapment, two concerns of fluorogenic peptide probes. However
fluorescent molecular reporters still suffer from similar background and autofluorescence
issues, especially given the dearth of highly fluorescent near-infrared (NIR) molecular
reporters available. It should be noted that very recently, an NIR fluorophore has been
developed that could allow for much improvement on these sensors in regards to in vivo
Figure 1.4. Schematic of FRET and its use in a reporter for caspase-3 activity. (A) In an activatable
reporter for caspase-3 activity, CFP and YFP are fused together via the DEVD sequence, resulting in
FRET. (B) Upon caspase-3 activation, its target DEVD sequence is cleaved, and CFP emission increases
Bioluminescent Reporters
To avoid sensitivity issues commonly associated with fluorogenic sensors, several
groups have recently employed bioluminescent caspase reporter systems for PCD
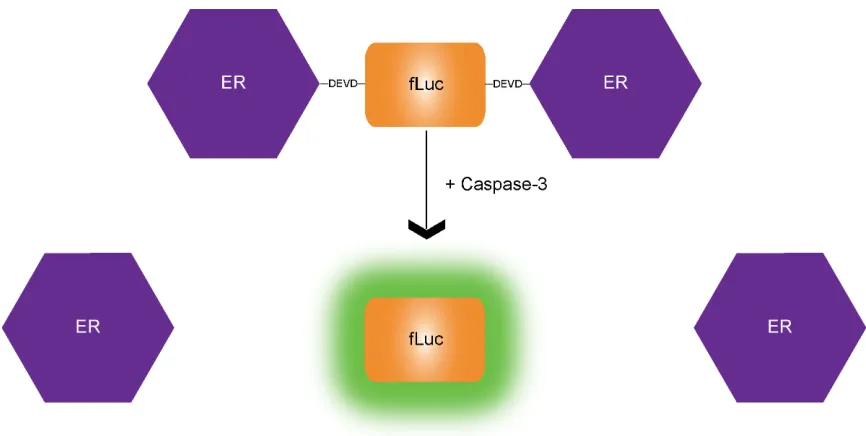
detection. One of these sensors utilized a recombinant Firefly luciferase (fLuc) reporter
protein that was flanked on both sides by an estrogen receptor regulatory domain protein
(ER)(68). The presence of these two large ER proteins (35 kDa each) effectively
silenced the enzymatic activity of fLuc by ~90%. Additionally, a DEVD sequence was
included between fLuc and each ER protein, which allowed for caspase-3 mediated
removal of the silencing ER domains and thus restoration of fLuc activity. An
illustration of this sensor is shown in Figure 1.5.
Figure 1.5. Schematic of ER-fLuc-ER sensor for caspase-3. Under normal cellular conditions, the large
ER proteins flank the fLuc protein via DEVD linkages, hindering its enzymatic activity. When caspase-3 is
activated in PCD inducing conditions, the DEVD sequences are cleaved, the ER proteins are released and
A number of drawbacks to this design exist, including that two proteolytic events
are required to completely restore luciferase activity, the protease cleavage sites may be
inaccessible due to the large flanking ER proteins, and that the usage of ER proteins
themselves, which are endogenously expressed in mammalian cells, could provoke overly
complex intracellular localization/dynamics, potentially leading to alternative proteolytic
pathways and ambiguous bioluminescent signals. Furthermore, it should be noted that
although the fLuc bioluminescence increases with increasing caspase-3 activity, this may
be abrogated by accelerated degradation of functional enzyme under apoptotic
conditions, as observed in this thesis.
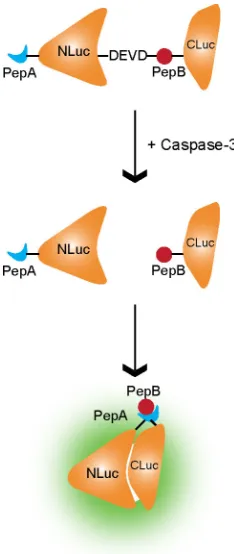
Another bioluminescent approach for imaging apoptosis via caspase-3 activation
in vivo made use of a split fLuc reporter strategy (69). In this sensor, fLuc is expressed in
two parts, NH2- and COOH-terminal sections, rendering it functionally inactive. When
the two halves are brought into close enough proximity, enzymatic activity is restored,
producing a bioluminescent signal in the presence of proper substrate. In the apoptotic
probe design, small, yet strongly interacting, peptides and the DEVD sequence were
incorporated to create a caspase-3 activatable sensor(70). Specifically, strongly
interacting peptides, peptide A and peptide B (71, 72), were fused to the N- and
C-terminal halves of fLuc, respectively, creating ANLuc and BCLuc (Figure 1.6). These
fusions are positioned sequentially with and intervening DEVD sequence. Under
apoptotic conditions, active caspase-3 cleaves at the DEVD site, which allows peptide A
Although this probe exhibits improvements over previous split reporter
technologies, where drawbacks can include high-background and non-ideal
signal-to-noise ratios (73), the requirement of two explicit events (i.e., DEVD cleavage and
peptideA-peptideB interaction) to generate a functionally indicator of cell death, and the
potential for an accelerated rate of enzyme degradation in cells undergoing PCD may Figure 1.6. Schematic of split fLuc reporter for caspase-3. Under normal conditions, the NH2- and
COOH-terminal sections of fLuc (NLuc and CLuc, respectively) are attached to small, strongly
interacting peptides (PePA and PepB) with and intervening DEVD sequence. Under apoptotic
conditions, caspase-3 is activated and cleaves the DEVD sequence. The fLuc fragments are separated
and PepA and PepB interact to bring the fragments into close enough proximity to reconstitute the
Another activatable bioluminescent sensor for apoptosis that has found success in
vivo makes use of the DEVD sequence conjugated to aminoluciferin(74, 75). This
conjugation renders the luciferin unable to act as a proper substrate for fLuc until the
peptide sequence is cleaved off upon caspase-3 activation. This method allowed for the
detection of caspase-3 in murine tumor models, however some potential limitations must
be addressed. First, it has been reported that the DEVD-luciferin is toxic to the
animals(74, 75), forcing all imaging experiments to be ceased 2 hours after
DEVD-luciferin injection, thus limiting the temporal dynamic range of this sensor significantly.
Additionally, extraneous background signal due to nonspecific degradation in serum,
extracellular space, lysosomes and non-apoptotic cells may decrease the sensitivity of this
approach. Also, the peptide conjugation may affect the biodistribution and
pharmacokinetics of the caged aminoluciferin and this reagent can be quite
cost-inefficient.
Phosphatidylserine Targeting Agents
Phosphatidylserine (PS) is a phospholipid that is typically found in the
inner-leaflet of cell membranes. In apoptotic cells, PS is often flipped to the outer inner-leaflet of the
cell membrane(76). This biological phenomenon has brought about the use of PS as a
molecular marker for apoptotic cells, most commonly with Annexin V, a naturally
occurring protein with avid binding affinity for PS(77). It has been found that apoptotic
them an attractive choice for the routine imaging of apoptosis; however autofluorescence
remains a concern, as does the non-specific localization of the labeled Annexin V agents
in untreated tumors due to the enhanced permeability and retention (EPR) effect.
Commercial Sensors for Apoptosis
Many commercial sensors have been developed to investigate apoptosis and its
related molecular processes. The terminal deoxynucleotidyl transferase dUTP nick end
labeling (TUNEL) assay, first developed in 1992(82), detects DNA strand breaks after
terminal deoxynucleotidyl transferase (TdT) incorporates labeled dUTP at break sites;
DNA fragmentation is a hallmark of cells undergoing PCD(83). CytoTox Glo is a
bioluminescent assay that measures the activity of certain intracellular proteases
(dead-cell proteases) that are released from (dead-cells with compromised membranes. Additionally,
assays that measure the reduction of various tetrazolium salts, such as MTT(84),
XTT(85) and WST-1(86), by intracellular dehydrogenases which are active only in living
cells are commonly used. However, it is important to note that these reduction assays are
actually a measure of cell viability as opposed to cell death. Although all of these assays
clearly have utility in measuring PCD in cell culture, most of them are not appropriate for
real-time imaging/detection and/or imaging in animal models of disease. These
limitations arise from the need for cell lysis, the use of membrane impermeable
substrates, and/or the use of green fluorescent dyes, which are generally masked by
1.2.2c Current Sensors for Caspase-Independent PCD
While caspase-3 activation is considered a gold standard for identification of cells
undergoing apoptosis, caspase-independent PCD has recently been attracting attention in
regards to cancer drug development. Anticancer drug resistance and tumorigenesis have
been linked to the ability of certain cancer types to evade caspase activation(87, 88); thus
it can be envisioned that therapeutics developed to induce caspase-independent PCD
could have widespread impact. To date, there exist no molecular imaging sensors to
specifically monitor caspase-independent PCD in vivo. Certainly, some of the
aforementioned assays, namely TUNEL, CytoTox-Glo, MTT, and WST-1 have the
capability to provide information on caspase-independent cell death, but suffer from the
1.2.3 Reactive Oxygen Species, Oxidative Stress and Cell Death
1.2.3a Overview
Reactive oxygen species (ROS) are natural byproducts of intracellular metabolic
processes, such as oxidation of xanthine by xanthine oxidase(89), uncoupling of the
mitochondrial transport chain(90, 91) and oxidation of NADPH by NADPH oxidase(92,
93), and have been shown to play a role in cell signaling and function(94-96). For
example, it has been shown that the growth factors tumor necrosis factor alpha (TNF
alpha) and basic fibroblast growth factor (bFGF) induce increases in ROS production in
chondrocytes(97). The ROS production seen here can stimulate the expression of early
response genes (e.g., c-fos and c-jun), which play roles in cell proliferation and
differentiation. Types of ROS include the hydroxyl radical (•OH), the superoxide radical
(O2•-), hydrogen peroxide (H2O2) and the peroxynitrite anion (ONOO-). In a balanced
cellular state, the level of ROS is typically controlled by various antioxidants that are
either expressed in cells (e.g. glutathione(98), superoxide dismutase(99) and
catalase(100)) or supplied through diet (e.g. vitamin E(101) and β-carotene(102)). When
unnecessary excesses of ROS are present, cells enter a state of ‘oxidative stress,’ wherein
various cellular components can be damaged, including DNA(103), RNA(104),
proteins(101-104) and lipids(105). Pathological conditions that have been linked to
oxidative stress include atherosclerosis(106), cancer(107), cystic fibrosis(108), type-2
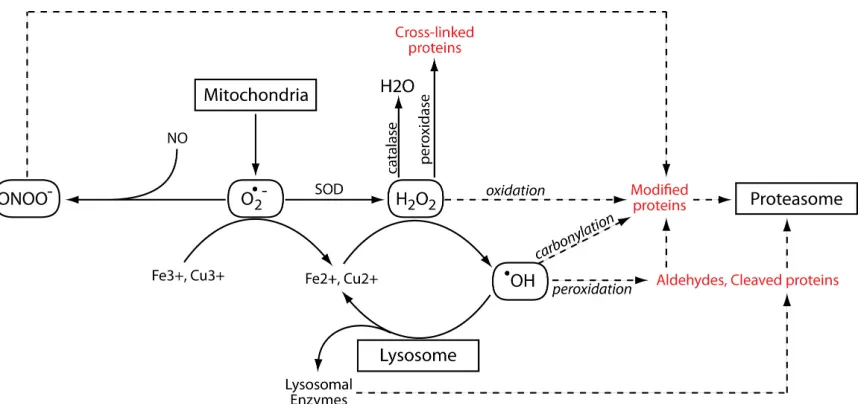
1.2.3b Protein modification, damage and degradation by ROS
While ROS-mediated damage of DNA, RNA and lipids are significant topics for
discussion, the body of work included in this thesis focuses on the effects of oxidative
stress on proteins. A summary of common ROS and mechanisms of protein oxidation is
provided in Figure 1.7 and these mechanisms are described in more detail in subsequent
sections.
Superoxide
Superoxide (O2•-) is the primary free radical formed within the cell by the
reduction of molecular oxygen and it can act as either an oxidant or reductant. The
mitochondria produce a large fraction of this radical (see (111) for review) due to their Figure 1.7. Schematic representing potential pathways for intracellular protein modification and/or
rather it serves as a precursor to other oxidizing agents. The principal reaction of O2•- is
to react with itself to produce H2O2 and oxygen (O2), a reaction known as dismutation.
Superoxide dismutation can be spontaneous or can be catalyzed by superoxide dismutase
(SOD, (99)). Additionally, O2•- is important in the production of the highly reactive
hydroxyl radical (•OH). In this process, O2•- reduces metal ions (e.g. Fe3+ Fe2+) by
donating one electron, and these metal ions then act as catalysts to convert H2O2 into
•
OH.
Hydrogen Peroxide
Hydrogen peroxide (H2O2) is a natural byproduct of oxygen metabolism and is
necessary for the function of many enzymes in the intracellular environment (e.g. protein
tyrosine phosphatases and the lipid phosphatase PTEN)(113). An important attribute of
H2O2 is that it is small enough to pass through cell membranes and thus cannot be
excluded from cells. H2O2 is a powerful oxidizing agent that can directly and indirectly
modify many amino acids (see (114) for review), often creating hydroxyl- or
carbonyl-derivatives. While the effect of protein oxidation can vary, it has been shown in some
cases that oxidation can destabilize a protein’s native structure and result in the
impairment of protein function and activity loss(115, 116). Loss of secondary structure
has also been shown to enhance the rate of protein degradation by the 20S
proteasome(117). In contrast, the presence of oxidized amino acids alone does not seem
to be a signal for degradation even though in vitro studies have suggested that proteins
cyclooxygenase) H2O2 can also produce tyrosyl radicals, which can subsequently
dimerize to form dityrosine, which can further lead to protein cross-linking and
aggregation(119-121).
Hydroxyl Radical
The hydroxyl radical (•OH) is generally considered to be the most powerful
oxidizing species in biological systems, and similarly to H2O2, can also pass through
membranes and thus cannot be kept out of cells. The oxidative attack of protein
backbones is initiated by the •OH-dependent abstraction of the α-hydrogen atom of an
amino acid residue to form a carbon-centered radical(122). Here, the •OH may be
created by the radiolysis of water or the metal-catalyzed cleavage of H2O2. In biological
systems, the majority of •OH radicals are produced when iron or copper react with H2O2,
commonly referred to as the Fenton reaction.
Once a carbon-centered radical is formed, it can give rise to protein cross-links,
peptide-bond cleavage (via diamide or α-amidation pathways), or direct oxidation of
amino acids(122). The direct oxidation of lysine, arginine, proline and threonine residues
may result in the formation of carbonyl derivatives (e.g. semialdehydes)(121, 122).
Alternatively, carbonyl groups may be introduced into proteins by reactions with
aldehydes produced during lipid peroxidation(123) or with other reactive carbonyls
generated by the reduction or oxidation of carbohydrates(109). Lipid peroxidation
prevalent than carbonylation from direct amino acid oxidation(125). The degradation of
carbonylated proteins typically occurs via the 20S proteasome; however, the 26S
proteasome has also been shown to play a role in the degradation of oxidatively modified
proteins(126, 127).
Besides the direct effect of •OH on proteins, they may also damage and
destabilize lysosomal membranes, causing the subsequent release of moderate amounts of
lysosomal hydrolytic enzymes into the cytosol(128, 129). The release of some of these
enzymes, namely cathepsins, has been implicated in PCD(130, 131). Recently, it has
been suggested that an intralysosomal pool of redox-active iron is also released upon
lysosomal permeabilization, which can lead to the further production of •OH if reacted
with intracellular H2O2(132).
Peroxynitrite
Peroxynitrite (ONOO-) is formed as a result of the reaction between O2•- and
nitric oxide (NO)(133). ONOO- can be cytotoxic through various mechanisms including
initiating lipid peroxidation(134), ssDNA cleavage(135) and glutathione depletion(136).
Methionine and cysteine residues are especially vulnerable to oxidation by ONOO-,
however tyrosine and tryptophan residues are also selective targets for nitration(122).
Tyrosine nitration is particularly damaging to cells because it can interfere with protein
phosphorylation, thus compromising intracellular signal transduction networks(122, 137).
As with previously mentioned ROS, mild ONOO- modification leads to the selective
1.2.3c Common Probes for Imaging ROS/Oxidative Stress
Leuco dyes and fluorescein derivatives
There currently exist a number of activatable fluorescent probes for detecting
ROS. Many of these sensors fall under the category of non-fluorescent leuco dyes, i.e.
‘dihydro’ derivatives of fluorescein, rhodamine and other dyes that are oxidized back to
the parent dye by some ROS. Even though these probes have been used to detect
oxidative activity in cells and tissue, their oxidation sometimes does not easily
discriminate between the various types of ROS. It has been reported that
dihydrodichlorofluorescein (H2DCF) and dihydrorhodamine 123 (DHR) only react with
intracellular H2O2 in reactions mediated by peroxidase, cytochrome c or Fe2+, rather than
with H2O2 alone (139-141). Additionally, it has been reported that DHR can also be
rapidly oxidized by ONOO-(142). It has been shown that dihydroethidium (DHE) and,
more recently, the mitochondrial-targeted derivative of DHE, MitoSOX Red, can provide
a more specific signal for superoxide(143, 144); however, the need for these dyes to be
excited with a wavelength of 494-510 nm likely prevents their usage in animal models.
While not as commonly utilized as H2DCF, aminophenyl fluorescein (APF) and
hydroxyphenyl fluorescein (HPF) tend to show much more specific reactivity and greater
resistance to light-induced oxidation than leuco dyes(145). Until reaction with •OH or
ONOO-, these fluorescein derivatives are essentially non-fluorescent. Also, since APF
also reacts with the hypochlorite anion (-OCl), it is possible to use APF and HPF
fluorescein derivatives (494 nm) likely limit their usage to in vitro assays. Table 1.3
summarizes the leuco dyes and fluorescein derivatives for ROS detection.
Table 1.3. Summary of leuco dyes and fluorescein derivatives for ROS detection.
Reporter ROS Detected λEx/λEm (nm)
H2DCF H2O2 494/518
DHR H2O2 505/534
DHE O2•- 510/595
MitoSox Red O2•- 510/580
APF •OH, ONOO-, -OCl 494/518
HPF •
OH, ONOO- 494/518
Luminol and lucigenin
Luminol and lucigenin are chemiluminescent compounds that have been used to
report the presence of ROS(147-149). However, a problematic characteristic of these
sensors is the requirement of two steps for light emission(150, 151). First, either luminol
must be oxidized by •OH(152), ONOO-(153), or peroxidase/H2O2(154) or lucigenin must
be reduced by xanthine oxidase(150), the mitochondrial electron transport chain(155) or
NADPH oxidase present in phagocytes(156). Then, the resulting radicals must react with
O2•- to generate a light-emitting product. The intermediate radicals present complicating
issues as they can themselves reduce oxygen to O2•-. Therefore, luminol and lucigenin
can be both sources and detectors of O2•-, which can obviously lead to ambiguous results.
Despite these complications, luminol was recently reported to be a successful method to
Electron Spin Resonance
Electron spin resonance (ESR) spectroscopy is an imaging technique for species
that have one or more unpaired electrons, analogous to the spins of atomic nuclei in
nuclear magnetic resonance. Theoretically ESR can be used to image ROS in living
subjects, however ROS generally do not accumulate enough to be detected(158). To
overcome this issue, ROS ‘traps’ have been developed to intercept reactive/unstable
radicals and react with them to form stable radicals that can thus be detected by ESR(159,
160). While initially promising, ROS traps suffer from numerous drawbacks including
loss of the ESR signal by enzymatic and/or molecular reductions, potential toxicity from
the high concentration of traps needed to generate an ESR signal and perturbations of the
traps on normal physiological function(158).
Luciferase-based sensors
The commercial assay GSH-Glo (Promega) is the only luciferase-based assay
designed to investigate oxidative stress; it detects intracellular glutathione (GSH) levels,
which generally tend to decrease in the presence of reactive species. This assay involves
the cleavage of an inactive luciferin derivative by GSH to render the native form of
luciferin. The luciferase provided in the assay can then catalyze the luciferin and produce
a bioluminescent signal. However there are currently no established luciferase-based
sensors designed to directly detect ROS. If achieved, luciferase-based sensors could offer
it is expected that a luciferase-based sensor would provide unique insight into the role of
ROS in disease progression and in response to therapy under natural biological
conditions. Furthermore, the ability to image ROS in animal models would most
certainly be expected to facilitate the development and evaluation of new therapeutics,
assist with the development of strategies to improve the efficacy of current therapeutics,
or limit the unwanted side effects of current therapeutic agents.
1.2.4 The Role of ROS/Oxidative Stress in PCD
It is well established that certain chemotherapeutic agents, such as
rituximab(161), bortezomib(162) and adaphostin(163), among others(164-166), generate
ROS in their induction of malignant cell death. However, there is growing evidence that
ROS may be involved in the regulation of both apoptotic and non-apoptotic
(caspase-independent) cell death pathways(167, 168). Recent studies have suggested that various
cell death triggers can lead to the direct production of ROS or enhanced mitochondrial
outer membrane permeability (MOMP(169, 170)). The direct production of ROS can
induce lysosomal membrane permeabilization and the subsequent release of lysosomal
enzymes can either induce MOMP or cause lysosomal degradation-mediated autophagic
cell death(171, 172). If MOMP is induced, cytochrome c and other pro-apoptotic factors
are released into the cytosol; additionally, NADH dehydrogenase and reduced enzyme
Q10 divert electrons from the electron transport system to oxygen, and O2•- are
formed(169, 170). Illustration of these processes can be seen in Figure 1.1. These
is envisioned that ROS/oxidative stress can be used as robust, versatile markers for the
various morphologically distinct pathways of cell death.
1.3 References
1. Weissleder R, Mahmood U. Molecular imaging. Radiology 2001;219:316-33.
2. Prescher JA, Contag CH. Guided by the light: visualizing biomolecular processes
in living animals with bioluminescence. Curr Opin Chem Biol;14:80-9.
3. Wetterwald A, van der Pluijm G, Que I, et al. Optical imaging of cancer
metastasis to bone marrow: a mouse model of minimal residual disease. Am J Pathol
2002;160:1143-53.
4. Ofek P, Fischer W, Calderon M, Haag R, Satchi-Fainaro R. In vivo delivery of
small interfering RNA to tumors and their vasculature by novel dendritic nanocarriers.
FASEB J.
5. Tang Y, Shah K, Messerli SM, Snyder E, Breakefield X, Weissleder R. In vivo
tracking of neural progenitor cell migration to glioblastomas. Hum Gene Ther
2003;14:1247-54.
6. Rocchetta HL, Boylan CJ, Foley JW, et al. Validation of a noninvasive, real-time
imaging technology using bioluminescent Escherichia coli in the neutropenic mouse
thigh model of infection. Antimicrob Agents Chemother 2001;45:129-37.
8. Redshaw N, Dickson SJ, Ambrose V, Horswell J. A preliminary investigation into
the use of biosensors to screen stomach contents for selected poisons and drugs. Forensic
Sci Int 2007;172:106-11.
9. Wilson T, Hastings JW. Bioluminescence. Annu Rev Cell Dev Biol
1998;14:197-230.
10. Zhao H, Doyle TC, Coquoz O, Kalish F, Rice BW, Contag CH. Emission spectra
of bioluminescent reporters and interaction with mammalian tissue determine the
sensitivity of detection in vivo. J Biomed Opt 2005;10:41210.
11. Miloud T, Henrich C, Hammerling GJ. Quantitative comparison of click beetle
and firefly luciferases for in vivo bioluminescence imaging. J Biomed Opt
2007;12:054018.
12. Tannous BA, Kim DE, Fernandez JL, Weissleder R, Breakefield XO.
Codon-optimized Gaussia luciferase cDNA for mammalian gene expression in culture and in
vivo. Mol Ther 2005;11:435-43.
13. Liu X, Kramer JA, Hu Y, Schmidt JM, Jiang J, Wilson AG. Development of a
high-throughput human HepG(2) dual luciferase assay for detection of metabolically
activated hepatotoxicants and genotoxicants. Int J Toxicol 2009;28:162-76.
14. Bhaumik S, Gambhir SS. Optical imaging of Renilla luciferase reporter gene
expression in living mice. Proc Natl Acad Sci U S A 2002;99:377-82.
15. Lehmann S, Stiehl DP, Honer M, et al. Longitudinal and multimodal in vivo
imaging of tumor hypoxia and its downstream molecular events. Proc Natl Acad Sci U S
16. Liu AC, Welsh DK, Ko CH, et al. Intercellular coupling confers robustness
against mutations in the SCN circadian clock network. Cell 2007;129:605-16.
17. O'Connell-Rodwell CE, Mackanos MA, Simanovskii D, et al. In vivo analysis of
heat-shock-protein-70 induction following pulsed laser irradiation in a transgenic reporter
mouse. J Biomed Opt 2008;13:030501.
18. Hightower LE. Heat shock, stress proteins, chaperones, and proteotoxicity. Cell
1991;66:191-7.
19. Naik S, Piwnica-Worms D. Real-time imaging of beta-catenin dynamics in cells
and living mice. Proc Natl Acad Sci U S A 2007;104:17465-70.
20. Chen X, Larson CS, West J, Zhang X, Kaufman DB. In vivo detection of
extrapancreatic insulin gene expression in diabetic mice by bioluminescence imaging.
PLoS One;5:e9397.
21. Gazdhar A, Bilici M, Pierog J, et al. In vivo electroporation and ubiquitin
promoter--a protocol for sustained gene expression in the lung. J Gene Med
2006;8:910-8.
22. Zhao F, Liang SQ, Zhou Y, et al. Evaluation of hepatitis B virus promoters for
sustained transgene expression in mice by bioluminescence imaging. Virus
Res;149:162-6.
23. Semenza GL, Nejfelt MK, Chi SM, Antonarakis SE. Hypoxia-inducible nuclear
factors bind to an enhancer element located 3' to the human erythropoietin gene. Proc
24. Wang GL, Jiang BH, Rue EA, Semenza GL. Hypoxia-inducible factor 1 is a
basic-helix-loop-helix-PAS heterodimer regulated by cellular O2 tension. Proc Natl Acad
Sci U S A 1995;92:5510-4.
25. Contag CH, Spilman SD, Contag PR, et al. Visualizing gene expression in living
mammals using a bioluminescent reporter. Photochem Photobiol 1997;66:523-31.
26. Edinger M, Sweeney TJ, Tucker AA, Olomu AB, Negrin RS, Contag CH.
Noninvasive assessment of tumor cell proliferation in animal models. Neoplasia
1999;1:303-10.
27. McMillin DW, Delmore J, Weisberg E, et al. Tumor cell-specific
bioluminescence platform to identify stroma-induced changes to anticancer drug activity.
Nat Med;16:483-9.
28. O'Leary DA, Sharif O, Anderson P, et al. Identification of small molecule and
genetic modulators of AON-induced dystrophin exon skipping by high-throughput
screening. PLoS One 2009;4:e8348.
29. Zhang Y, Byun Y, Ren YR, Liu JO, Laterra J, Pomper MG. Identification of
inhibitors of ABCG2 by a bioluminescence imaging-based high-throughput assay. Cancer
Res 2009;69:5867-75.
30. Grigorieva I, Thomas X, Epstein J. The bone marrow stromal environment is a
major factor in myeloma cell resistance to dexamethasone. Exp Hematol
1998;26:597-603.
31. Karnoub AE, Dash AB, Vo AP, et al. Mesenchymal stem cells within tumour