Lincoln
University
Digital
Dissertation
Copyright
Statement
The
digital
copy
of
this
dissertation
is
protected
by
the
Copyright
Act
1994
(New
Zealand).
This
dissertation
may
be
consulted
by
you,
provided
you
comply
with
the
provisions
of
the
Act
and
the
following
conditions
of
use:
you
will
use
the
copy
only
for
the
purposes
of
research
or
private
study
you
will
recognise
the
author's
right
to
be
identified
as
the
author
of
the
dissertation
and
due
acknowledgement
will
be
made
to
the
author
where
appropriate
you
will
obtain
the
author's
permission
before
publishing
any
material
from
the
dissertation.
The effect of nitrogen on the yield of
four pasture grass species
A dissertation/thesis
submitted in partial fulfillment
of the requirement for the Degree of
Bachelor of Agricultural Science (Hons)
at Lincoln University
by
Nick Wilson
Lincoln University
i
ABSTRACT
Abstract of a Thesis submitted in partial fulfillment of the requirement for
the Degree of Bachelor of Agricultural Science (Hons)
The effect of nitrogen on the yield of four pasture grass species
By
Nick Wilson
This research examined the morpho-physiological attributes of four pasture grass species
under two nitrogen (N) treatments. The experiment was a split plot design with main
plots of N+ and N-and subplots of cocksfoot (Dactylisglomerata), pasture brome
(Bromusvaldivianus), perennial ryegrass (Loliumperenne) and tall fescue
(Festucaarundinacea). Leaf length, leaf area and specific leaf area (SLA) decreased by
30%, 36% and 7% under N-, whereas leaf dryness (percentage dry matter) increased by
18%. Total accumulated aboveground plant dry matter (DM) yield decreased by 13% in
response to the N- treatment. Chlorophyll levels, measured as SPAD units, predicted yield
under N+ conditions which was also reflected in the leaf length, leaf area and SLA
measurements. The findings also suggest that species with higher green DM
compensated for external N reduction by utilising higher internal available N within the
plant. Brome and cocksfoot, and to a lesser degree tall fescue, showed superior
morphological leaf attributes under mixed N-availability and can be proposed as suitable
alternatives in dryland and low nitrogen farming systems as an alternative to perennial
ryegrasses.
Keywords: nitrogen, brome, cocksfoot, perennial ryegrass, tall fescue,
Bromusvaldivianus, Dactylisglomerata, Loliumperenne, Festucaarundinacea, dry matter,
ii
ACKNOWLEDGEMENTS
I am very grateful for the opportunity to do my honours dissertation in my final year of
study at Lincoln University. I have learnt a lot in the four years of my degree and am very
appreciative of all the lecturers who have shared their knowledge in all my courses.
I would like to thank Professor Rainer Hofmann for organising the project to fit into an
existing trial in a short space of time. I am very grateful for the support, guidance and
help solving issues throughout the year. Thank you for taking the time and having the
patience to explain and demonstrate techniques to obtain results in the trial and proof
read my work, it was very helpful and I gained a lot of knowledge.
Thanks, must go to Keith Pollock and ShirinSharifiwho helped in harvesting results,
discussing results and answering any queries I had. I appreciate the help I was given
byAnna Mills on statistical analysis and from DaliyaCyriac on leaf elongation. I would like
to acknowledge with gratitude Professor Derrick Moot for his invaluable input into my
education over the past four yearsand the help over this year in organising my honours
and providing feedback.
I would like to thank all the people I have had the pleasure of meeting at university and
those I am lucky enough to have as friends and flat mates, it has made university very
enjoyable and that much more beneficial. Finally, I would like to thank my family for
continually encouraging me to do my best and have fun throughout university, especially
iii
TABLE OF CONTENTS
ABSTRACT ... i
Acknowledgements ... ii
Table of Contents ... iii
List of Tables ... vi
List of Figures ... vii
List of Plates ... ix
List of Appendices ... x
1 INTRODUCTION ... 1
2 REVIEW OF THE LITERATURE ... 3
2.1 New Zealand Pastures ... 3
2.2 Grass species ... 5
2.2.1 Cocksfoot (Dactylis glomerata) ... 5
2.2.2 Pasture brome (Bromus valdivianus) ... 8
2.2.3 Perennial ryegrass (Lolium perenne) ... 9
2.2.4 Tall fescue (Festuca arundinacea) ... 10
2.3 Morphological features ... 12
2.3.1 Leaf attributes ... 12
2.3.2 Leaf DM ... 15
2.3.3 Roots ... 16
2.4 ENVIRONMENT ... 17
2.4.1 Temperature and light ... 18
2.4.2 Moisture and wind ... 19
2.4.3 Soil ... 19
2.4.4 Water/rainfall/drought... 21
2.5 Nitrogen ... 22
3 MATERIALS AND METHODS ... 25
3.1 Experimental site ... 25
3.2 Paddock history... 25
3.3 Soil characteristics ... 26
3.4 Meteorological conditions ... 26
3.5 Agronomic management ... 27
iv
3.5.2 Seedbed preparation ... 30
3.5.3 Establishment ... 30
3.5.4 Soil fertility ... 30
3.5.5 Weed control after establishment ... 31
3.5.6 Mowing and defoliation management ... 31
3.5.7 Nitrogen fertilizer ... 32
3.6 Measurements ... 33
3.6.1 Dry matter production... 33
3.6.1.1 Destructive harvests ... 33
3.6.2 Botanical composition ... 33
3.6.3 SPAD chlorophyll meter ... 33
3.6.4 Morphological leaf measurements ... 33
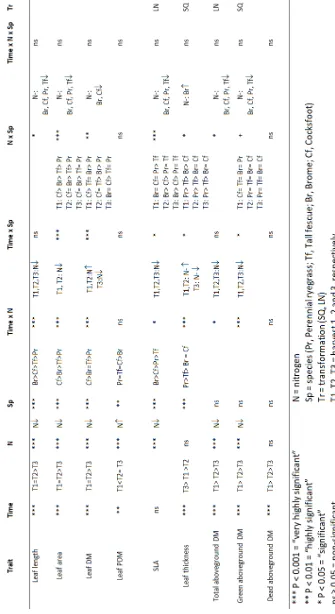
4 RESULTS ... 36
4.1 Leaf length ... 37
4.2 Leaf area ... 40
4.3 Leaf DW ... 43
4.4 Leaf percentage DM ... 46
4.5 Specific Leaf Area (SLA) ... 48
4.6 Leaf thickness ... 51
4.7 SPAD ... 54
4.8 Total aboveground DM ... 55
4.9 Green aboveground DM ... 58
4.10 Senesced aboveground DM ... 61
4.11 Relationships ... 63
5 DISCUSSION ... 66
5.1 Leaf length ... 66
5.2 Leaf area ... 66
5.3 Leaf DW ... 67
5.4 Leaf percentage DM ... 67
5.5 Specific leaf area (SLA) ... 67
5.6 Leaf thickness ... 68
5.7 SPAD chlorophyll reading... 68
5.8 Aboveground DM ... 68
5.9 Aboveground green and senesced DM ... 69
v
vi
LIST OF TABLES
Table 1: Mean leaf and stubble dry matter (DM; g plant−1) of cocksfoot (CF), perennial
ryegrass (PR) and tall fescue (TF) ... 16
Table 2:Overall survival of grasses ... 22
Table 3: Monthly means from 1975 to 2012 for total solar radiation (Ro), maximum
(Tmax), minimum (Tmin) and mean (Tmean) air temperatures (°C), rainfall
(mm), Penman potential evapotranspiration (EP), wind run (km/day), and
vapour pressure deficit (VPD) ... 27
Table 4: Cultivars, sowing rate (kg/ha) and germination percentage of four grass species
at Ladbrooks. ... 30
Table 5: Soil test results (0-150 mm) from Ladbrooks site, Canterbury, New Zealand. ... 31
vii
LIST OF FIGURES
Figure 2-1: Annual dry matter yields (t/ha/yr) of the sown grass ... 7
Figure 2-2: Average annual yields of perennial ryegrass and tall fescue ... 11
Figure 2-3: Fully expanded area (cm2) per blade ... 14
Figure 2-4:The effect of soil pH on nutrient availability. ... 20
Figure 3-1:Ladbrooks experimental site. ... 29
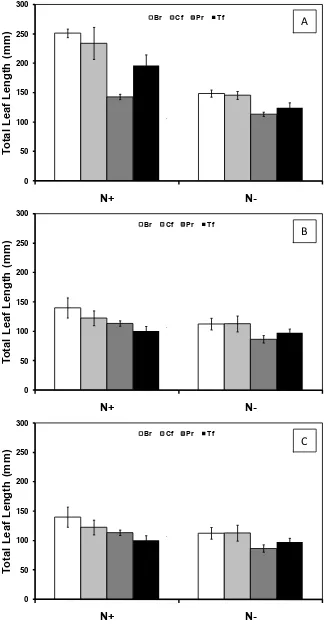
Figure 4-2: Total leaf length in response to nitrogen ... 38
Figure 4-3: Total leaf thickness in response to nitrogen ... 39
Figure 4-4:Total leaf area in response to nitrogen ... 41
Figure 4-5:Total leaf area in response to nitrogen ... 42
Figure 4-6:Total leaf DW in response to nitrogen. ... 44
Figure 4-7:Total leaf DW in response to nitrogen ... 45
Figure 4-8:Total leaf percentage DM response to nitrogen ... 46
Figure 4-9:Leaf percentage DM in response to nitrogen ... 47
Figure 4-10:SLA in response to nitrogen (N) treatments. ... 49
Figure 4-11: SLA in response to nitrogen (N) treatments ... 50
Figure 4-12:Total leaf thickness in response to nitrogen (N) treatments ... 52
Figure 4-13:Total leaf thickness in response to nitrogen (N) treatments ... 53
Figure 4-14: SPAD in response to nitrogen (N) treatments. ... 54
Figure 4-15:Total dry matter in response to nitrogen (N) ... 56
viii
Figure 4-17:Total green dry matter in response to nitrogen (N) treatments ... 59
Figure 4-18:Total green dry matter in response to nitrogen (N) treatments ... 60
Figure 4-19: Total dead dry matter in response to nitrogen (N) treatments. ... 61
Figure 4-20:Total dead dry matter in response to nitrogen (N) treatments ... 62
Figure 4-21: Relationship between total DM yield and leaf greenness ... 63
Figure 4-22:Relationship between change in leaf length and the change in total DM yield. ... 64
ix
LIST OF PLATES
Plate 3-1: Ladbrooks experiment site. ... 25
Plate 3-2: Nitrogen treatment split plot design at Ladbrooks 2017. ... 32
x
LIST OF APPENDICES
Appendix 1: Application date and rate of nitrogen fertilizer (urea (46,0,0,0)) at Ladbrooks.
... 82
1
1
INTRODUCTION
Many farming systems in New Zealand operate within an environment where water and
nitrogen (N) availability is often limited, especially along the east coast. This results in a
period of feed deficit over summer months (Clark and Woodward, 2007). Perennial
ryegrass (Loliumperenne) is the major pasture grass species used in New Zealand and is
commonly the main dietary component of New Zealand’s most intensively grazed
livestock species (Easton et al., 2001). Whilst it is the most commonly sown pasture grass
in New Zealand (Kemp et al., 2002), perennial ryegrass often struggles to persist and
produce high quality pasture when exposed to dry and low nutrient conditions (Turner et
al., 2006). Based on recent climate change predictions, regional variation in annual
rainfall will increase moisture deficits, alongside rising temperatures increasing rates of
evapotranspiration experienced in the eastern and northern regions of the country
(Hollis, 2014; Salinger, 2003). These changes, combined with lack of N availability in
pastures are likely to decrease the survival of perennial ryegrass. Recent research has
turned towards investigating alternative pasture grass species that can persist and
produce high quality pasture during the hot and dry summer months when finishing
young stock is paramount to farming systems profitability.
However, despite extensive knowledge on dry matter (DM) production of different grass
species used in New Zealand, knowledge is less defined on plant attributes by which
these species show different DM production under different N regimes. Identifying these
morphological and physiological traits may give an insight into how improvements in
grazing management, species and cultivar breeding development, and N application can
be achieved to increase overall DM yields.
In the current study, the pasture grass species; cocksfoot (Dactylisglomerata), pasture
brome (Bromusvaldivianus) and tall fescue (Festucaarundinacea) were compared to
perennial ryegrass (Loliumperenne). Two nitrogen treatments were imposed during the
autumn 2017 on a dryland site at Ladbrooks near Lincoln University. Through monitoring
2
availability it was expected that differences in these attributes could be established
3
2
REVIEW OF THE LITERATURE
2.1 New Zealand Pastures
The pastoral industry is an important component of the New Zealand economy. The
production of agricultural commodities such as meat, wool and milk depend on the
availability of feed from pastures (Clark and Woodward, 2007). Farmers continually seek
to improve the production of their livestock systems by adopting technologies and
management techniques that improve the growth and consumption of pasture (Caradus,
2008). Improving the yield and feeding value of pasture in a cost-effective way is key in
maintaining New Zealand agriculture and the products it produces stays competitive on
world markets. Nitrogen (N) is essential in these pastoral systems for plant growth and
producing high quality pasture. Nitrogen makes the use of water more efficient (Moot et
al., 2008), obtaining N through legumes and additions of N containing fertilisers is the
primary way pastures obtain N. Finding pastures that are more efficient at using N is a
way in which we can increase pasture production efficiencies.
Dryland pastoral agriculture in New Zealand has been based around perennial ryegrass
(Loliumperenne)/white clover (Trifoliumrepens) based pasture mixes for the last 70 years
(Mather et al., 1995). This has led to extensive research to adapt both species to a wide
and variable range of New Zealand climatic conditions. In areas of high fertility and
reliable rainfall their persistence and productivity has been high (MacFarlane, 1990).
However, in dryland environments potential evapotranspiration is greater than rainfall
through September to April, especially on the East Coast of New Zealand (Rickard and
Radcliffe, 1976). Agricultural systems aim to take advantage of the short period of high
growth in spring. At other times of the year growth is restrained by summer drought and
low winter temperatures. Drought can halt growth and is more severe in free draining
soils with low water holding capacity. Droughts are variable and unpredictable in duration
which effects on-farm decision making (Hoglund and White, 1985). Irrigation on a large
number of east coast farms is not possible due to topography, cost and environmental
4
Water is a critical limiting factor for pasture production. Plants require water to carry out
a range of biophysical processes. When placed under water stress plants respond by
initiating strategies to mitigate water loss, ranging from reducing leaf expansion to
closing stomata pores (Brown, 2004). The duration and severity that a plant is exposed to
water stress (drought), will determine the strategy used to increase the chances for plant
survival and the resultant effects on plant production/crop yields (Jamieson, 1999).
Growth of pasture will not occur when there is no available water. The ability of a pasture
under water stress to survive, how quickly it can recover and a crops water use efficiency
are the most beneficial factors to mitigate drought conditions in dryland farming
environments.
The financial cost to the agricultural industry with perennial ryegrass/white clover
pasture mixes in summer dry agricultural systems associated to reduced persistence and
production has lead to the introduction of alternative pasture species that may be more
suited to dryland environments (Mather et al., 1995). Increasing water use efficiency
(WUE) (biomass increase per unit of water transpired), has been an area where crop
yields have been looked at for improvement in recent years especially in drought prone
regions and environments of New Zealand (Brown, 2004).
New Zealand’s temperate climate has fewer sunlight hours and lower temperatures in
the winter than in the summer which limits the quality and yield of winter forage crops.
Baars and Waller (1979) identified rainfall and temperature as the main climatic variables
which affect pasture production, with temperature being crucial for pasture growth
especially in winter and early spring. Reduced incident solar radiation in winter means
less radiation is available for crop interception in winter. Low temperatures can reduce
the conversion of intercepted radiation to dry matter (DM) or radiation use efficiency
(RUE) which can result in a reduced biomass (Monteith, 1977). In addition, low
temperatures have been shown to slow leaf appearance and expansion, which results in
canopy closure taking longer (Kirby et al., 1982). These factors cause seasonal variation in
pasture supply which complicates management of pastoral systems. Temperature could
also affect the phenological development of crops described in terms of thermal time (Tt)
5
the accuracy in predicting crop development to determine optimum sowing and harvest
dates.
2.2 Grass species
2.2.1 Cocksfoot (Dactylisglomerata)
Cocksfoot (Dactylisglomerata) is a major pasture grass used in New Zealand in dryland
farming systems. It is drought tolerant, persistent and has a main growth period that
occurs during summer (Charlton and Stewart, 2000). In Canterbury annual yields have
been reported from 7.5 t DM/ha to >22.5 t DM/ha (Mills et al., 2005). Lower yields
occurred under dryland conditions with no nitrogen and the higher yields occurred under
non-limiting nitrogen and water conditions. It is a valuable grass in drier regions with
moderate fertility and is suited to light and free-draining soils (Charlton and Stewart,
1999).
In New Zealand, for many dryland farmers, cocksfoot (Dactylisglomerata) is the most
persistent grass species because it survives dry periods during the summer. Cocksfoot is a
persistent perennial grass that tolerates moderate soil fertility, moisture stress, insect
attack and set stocking (Mills, 2007). It is a small seeded grass with a thousand seed
weight of 0.65 g (Lancashire and Brock, 1983) to 1.0 g (Moloney, 1993). Perennial
ryegrass has a larger thousand seed weight of 1.87-2.48 g. Thus, there are less seed
reserves for cocksfoot to establish at first when compared to ryegrass, therefore a slower
establishment is seen.
Cocksfoot has a relatively slow establishment when compared to perennial ryegrass
(Charlton and Stewart, 1999). Stephens and Hickey (2000) reported cocksfoot pasture
having a peak production four years after establishment, but measurements ceased after
the fourth year. Korteet al. (1991) reported similar results with cocksfoot content
increasing three to four years after sowing. Cocksfoot generally has lower seasonal
production during spring than ryegrass but this is offset by increased production during
6
was 7.6 t DM/ha compared with 4.9 t DM/ha from ryegrass pastures (Stevens et al.,
1992). The difference in annual yield occurred because cocksfoot produced 131% more
DM than ryegrass in summer and 74% more DM in autumn. Floral initiation in Cocksfoot
occurs later in a growing season (late summer/autumn) (Mills, 2007). Cocksfoot becomes
a valuable pasture for finishing stock as high quality pasture continues to grow over the
summer.
Persistence during dry periods is a key component of dryland pastures survival to drought
conditions. Cocksfoot forms a dense fibrous root in the top 0.25m of the soil profile
(Ridley and Simpson, 1994). Both cocksfoot and ryegrass have been shown to extract
water from similar soil profile depths (Evans, 1978). The mechanisms by which
cocksfoot's superiority allows it to recover and persist when subjected to water stress
may be due to differences between the two species in i) water use efficiency: ii) the
ability to access and extract soil moisture and/or: iii) the mechanism used to recover from
drought (Mills, 2007).
Cocksfoot is normally sown with legumes, such as white clover and has more recently
been grown with Caucasian (Trifoliumambiguum), subterranean (Trifoliumsubterraneum)
and balansa (Trifoliummichelianum) clovers (Mills et al., 2008). Mills et al. (2008) found
that annual dry matter yields of these four legumes sown with cocksfoot were higher in
four of the five measurement years than annual dry matter yields of ryegrass/white
clover in the 'MaxClover' experiment at Lincoln University (Fig. 2.1). Ryegrass production
dropped from 8 to 4 t/ha while cocksfoot averaged about 6 t/ha in the fifth year.
Cocksfoot forage quality is lower than that of perennial ryegrass, being particularly poor
when seedheads are present. Grazing management is based around preventing excessive
seedhead development. Under dry conditions cocksfoot may dominate white clover to
such an extent that pastures become protein-deficient, unproductive and unpalatable
(Moloney, 1993).
Mills et al. (2008), shows the sown grass component of five dryland pastures
(cocksfoot/sub clover, CF/Sub; cocksfoot/white clover, CF/WC; cocksfoot/balansa clover,
7
It shows that the sown grass component of the RG/WC declined from 7.4 t DM/ha/year in
2002/03 to slightly more than 4 t DM/ha/year in 2005/06 and 2006/07. The sown grass
yield of CF/WC pastures declined from 8.7 t DM/ha/year in 2002/03 to ~6 t DM/ha/year
in 2005/06 and 6.3 t DM/ha/year in 2006/07. In the CF/Sub pastures the grass
component dropped from 8.5 t DM/ha/year in 2002/03 to ~5.5 t DM/ha/year in 2005-06
and 6.1 t DM/ha/year in 2006/07. These results obtained by Mills et al. (2008) show that
cocksfoot was a more suitable grass species for dryland Canterbury where summer
moisture stress occurs regularly.
Figure 2-1: Annual dry matter yields (t/ha/yr) of the sown grass component of dryland
CF/Sub (●),CF/Bal (○), CF/Wc (▼), CF/Cc (▽) and RG/Wc (■) pastures over five growth season. The error bar is the maximum SEM(Mills et al., 2008).
Peri et al. (2002) showed leaf photosynthesis in cocksfoot to be at an optimum between
19-23°C. This was similar to the 20-22°C optimum range reported in controlled
environments (Mitchell and Lunacus, 1962). Thermal time is used to show the
Material removed due to copyright
8
relationship between temperature and plant development between two development
stages of a plant (heats unit/growing degree days (°Cd)). It shows seasonal variations in
pasture growth rates and the impact of temperature on pasture growth rates (Moot et
al., 2000). Moot et al. (2000) calculated cocksfoot thermal time with a base temperature
of 3°C and the optimum of 23°C (growing degree days is the time spent between these
two values).
2.2.2 Pasture brome (Bromusvaldivianus)
Brome grass is found throughout temperate New Zealand (Kon and Blacklow, 1995). The
annual lifecycle of the Bromus species is typical of many annual grasses, including
perennial ryegrass, with most germination occurring over the winter months, rapid
growth during spring and seed production over the summer months (Kon and Blacklow,
1995). The root systems of brome are fibrous and concentrated in the upper soil profile
(Hulbert, 1955). There is limited research around pasture brome (Bromusvaldivianus),
used in this experiment, in New Zealand, resulting in little literature based around the
characteristics of pasture brome. Most studies have focused on invasive Bromus species
such as rigid brome (B. rigidus) and ripgut brome (B. diandrus), which are noted as being
serious weeds of cereal crops and pasture (Williams, 1986). Therefore most studies
concentrate on management of brome grass as a weed. However, pasture brome is
described as a medium tillered, perennial brome grass species that is more persistent
than prairie grass under grazing (Charlton and Stewart, 1999). It provides strong spring–
summer growth with drought tolerance with moderate winter growth. Pasture brome is
persistent on fertile and free-draining soils, but does not tolerate pugging or
waterlogging. However, it may tolerate higher rainfall conditions than other brome
grasses. It is suited to the dry East Coast and inland regions of New Zealand, where it is
9
Harkesset al. (1990) found organic matter digestibility (OMD) of brome over three years
to be higher than cocksfoot, but not higher than ryegrass. In the same experiment in
Edinburgh, experiments were established on a sandy loam soil that was imperfectly
drained. N concentrations were ranked with cocksfoot > brome grass > perennial ryegrass
over three years, with the respective means being 17.8, 17.1 and 15.3 g kg DM-1.
2.2.3 Perennial ryegrass (Loliumperenne)
Perennial ryegrass is the most widely used temperate grass in New Zealand as it grows
well in a wide range of fertile situations, is easily established and managed, and usually
forms a compatible mixture with white clover and other pasture species (Charlton and
Stewart, 1999). Perennial ryegrass requires moist fertile conditions and withstands hard
grazing and treading. However, it has been reported to perform poorly during hot dry
conditions, when many other deeper rooted grasses maintain production (Charlton and
Stewart, 1999; Hogland and White, 1985).
Perennial ryegrass cultivars are classified into types according to flowering time (Charlton
and Stewart, 1999). Seedhead emergence is associated with a spring growth flush, with
earlier heading cultivars being more productive in August–September than later heading perennial ryegrasses. However, a decline in feed quality is associated with seedhead
development, thus later flowering cultivars will retain their leafiness and pasture quality
longer (Charlton and Stewart, 1999). This is useful in a dryland finishing system where
stock are finished over late spring and into the summer. Cultivars can also vary according
to the number of chromosomes they have with diploid and tetraploid types. Perennial
ryegrasses occur naturally only as diploid plants, with a standard set of 14 chromosomes
in each cell. However, plant breeders can double the number of chromosomes to form
tetraploid types, which results in larger plants with bigger cells, greater water content
and a larger seed (Charlton and Stewart, 1999).
The annual dry matter (DM) production of perennial ryegrass in New Zealand ranges
between 9 – 20 tonnes DM ha⁻1 yr-1 (Easton et al., 2001). The large variation in
10
temperature, and soil moisture and fertility (Stewart et al., 2014). Significant changes in
the seasonal production and morphology of perennial ryegrass pastures are based largely
on temperature, and therefore the region it is grown. The use of irrigation increased dry
matter production by 13% in the Waikato (Clark et al., 2010) and 80% in Canterbury
(Mcbride, 1994). Perennial ryegrass DM production is lowest during winter.
2.2.4 Tall fescue (Festucaarundinacea)
Tall fescue is a deep-rooted, perennial grass that is productive and drought tolerant and
best suited to heavy or wetter soils with high fertility (Charlton and Stewart, 1999). It can
withstand acid, alkaline soils and poor drainage. Milne et al. (1998) similarly reported tall
fescue required high soil fertility and responded well to nitrogen application. Tall fescue is
useful in dry conditions as a summer purpose pasture that grows well in all seasons,
especially summer and autumn. It is becoming increasingly popular as an alternative to
ryegrass-based mixtures in drier regions and in areas where subtropical grass invasion is
an increasing problem (Charlton and Stewart, 1999). Tall fescue’s natural range of habitat is limited in regions of rainfall below 450 mm/yr (Easton et al., 1994).
Dry matter production of tall fescue is important in dryland areas, with successful
establishment being crucial to productivity and persistence. Tall fescue is slower to
establish than perennial ryegrass due to its slow mobilization of seed reserves and
seedling growth (Kemp et al., 1999). However, once established tall fescue has a similar
DM production to perennial ryegrass where water is not limiting but in dryland conditions
tall fescue has greater pasture production, as it can recover quicker after a water deficit
(Kemp et al., 1999). Tall fescue becomes an important cool season perennial when
summer moisture stress limits the persistence and yield of perennial ryegrass in the dry
east coast of New Zealand (Easton et al., 1994). Brock (1982) showed that both tall fescue
cultivars, ‘Roa’ and ‘S170’, yielded significantly higher than ‘Ruanui’ ryegrass by 172% and
163%, respectively, with only 55% of the normal rainfall occuring in the summer to
autumn period (January-April) of the first year. Both tall fescue cultivars also out-yielded
‘Ruanui’ during the same period of the wetter second year, by 40% and 54%, respectively.
11
Rollo et al. (1998) found that the average annual tall fescue yield over a 5 year period was
greater than perennial ryegrass across three dryland sites in New Zealand (Fig. 2-2).
Annual yields reflected local climatic conditions between the dryland sites. Pasture
production for both grass species was greatest at the Taranaki Agricultural Research
Station (TARS) which had the highest summer rainfall (290 mm) and lowest water deficit
(161 mm) out of the three sites. At this site, tall fescue produced 17 t DM ha⁻¹ which was
13.5% more than ryegrass. The Winchmore site had the lowest summer rainfall (256
mm), highest water deficit (235 mm), and lowest soil temperature (15.6°C) over summer,
resulting in lower herbage production. Tall fescue produced an average 11.2 t DM ha⁻¹ compared with 10.1 t DM ha⁻¹ from perennial ryegrass at Winchmore. The Poukawa site,
located in Hawke’s Bay showed no significant difference in the yields of the two grasses
as hot dry conditions restricted tall fescue production to 570 kg DM ha⁻¹.
Figure 2-2: Average annual yields of perennial ryegrass and tall fescue across three dryland sites (Poukawa, Taranaki Agricultural Research Station (TARS) and
Winchmore) in New Zealand over a 5 year period from 1990/91 to 1994/95
(Rollo et al., 1998).
Fertility and grazing management influence the persistence of tall fescue in New Zealand
(Easton et al., 1994). Rollo et al. (1998) stated that rhizome development does not begin
Material removed due to copyright
12
until 2 years after autumn sowing and can be reduced by poor grazing management. Tall
fescue grazing management in spring should be more frequent to prevent excessive
seedhead development, to prevent the development of stemmy pastures that result in
poor quality feed. Tall fescue is usually sown as the sole grass component with clover, or
with low rates of erect cocksfoot types. It is not recommended to be sown in mixtures
with ryegrass as ryegrass dominates and tall fescue soon disappears (Charlton and
Stewart, 1999). Tall fescue sowing rates are recommended to be 15–30 kg/ha with clover. Seed establishment is faster in warm soils, so tall fescue-based mixtures should be sown
in September-October, or in February–March (Charlton and Stewart, 1999).
Tall fescue cultivars vary in their flowering time, more so than perennial ryegrass.
Early-flowering types grow well in August–September with a decline in quality seen earlier than in later-flowering types as seedheads develop. Cultivars also vary in establishment rate
but are slow in comparison to ryegrass. Additionally, cultivars vary in tiller density.
Traditional types are larger, with more broad foliage when compared to perennial
ryegrass, with others as fine-leaved as perennial ryegrass. The broad-leaved types suit
rotational grazing, whereas the fine-leaved dense types can withstand close continuous
sheep grazing (Charlton and Stewart, 1999).
2.3 Morphological features
2.3.1 Leaf attributes
Over many years of experimentation with ryegrasses and fescues, information about leaf
development in these grasses and their hybrids is still fragmentary. Sometimes leaf
appearance rate and leaf extension rate have been recorded, but to the best of my
knowledge there is no information on differences in leaf expansion rate. This may be due
to large differences in between grasses in leaf blade width and therefore differing
elongation rates. The final area and weight of individual leaf blades are further important
characteristics of which there are few published comparisons of different grasses grown
13
Available evidence suggests that leaf appearance rate can be expected to be higher in
ryegrasses than in tall fescue (Peacock 1976; Wilman& Mohamed 1980, 1981). Also, leaf
extension rate may be higher in Italian ryegrass than in tall fescue and it may be higher in
Italian than in perennial ryegrass (Peacock 1976; Wilman& Mohamed 1981; Davies et al.,
1989). It appears that tall fescue, in established swards, can be expected to have larger,
heavier leaf blades than ryegrasses (Wilman& Mohamed 1980, 1981). The leaf blades of
Italian ryegrass may be larger and sometimes heavier than those of perennial ryegrass
(Wilmanet al., 1977; Wilman& Mohamed 1981).
Gao and Wilman (1994) studied eight related grasses, grown in field swards cut at 5-week
intervals over two years in Wales, UK. The rate of leaf expansion was recorded in the
order of Westerwolds ryegrass > Italian ryegrass (Loliummultifloruni), Italian ryegrass x
meadow fescue > hybrid ryegrass > perennial ryegrass x meadow fescue, meadow fescue
(Festucapratensis), tall fescue and perennial ryegrass (Fig. 2-3). This is similar to the
findings of Peacock (1976), Wilman& Mohamed (1981), and Davies et al., (1989). Gao and
Wilman (1994) found the order of grasses for rate of leaf appearance, rate of leaf
extension, weight of leaf blade emerging per shoot per week and rate of increase in
length of the exposed leaf sheath to be similar to that of the order of rate of leaf
expansion, the order was approximately the reverse for weight per unit area of emerging
leaf blade. The area per leaf blade in tall fescue increased greatly between May-July of
14
Figure 2-3: Fully expanded area (cm2) per blade of leaf 2 in six periods of study in
Westerwolds ryegrass (○), Italian ryegrass (●), perennial ryegrass (∆), meadow
fescue (▲) and tall fescue (□) (Gao &Wilman, 1994).
Expanded leaves constitute the yield a pasture has and also the means of which it has to
capture light energy through photosynthesis (Ryle, 1964). It has been reported that the
final leaf lamina size in grasses is influenced by temperature and N (Ryle, 1964). An
increased supply of N generally promoted all aspects of growth, while temperature was
noted to have a more complex effect. Leaf length was increased and leaf width decreased
by raising the temperature. Light intensity, and especially day length are also known to
influence leaf size. Ryle (1964) also found fescues and cocksfoot to have the largest leaf
area above ryegrass. A high rate of leaf production and a large number of living leaves,
rather than leaf size, were presumed to be responsible for the performance of cocksfoot,
in contrast to the fescues which appeared to attain a larger leaf area per shoot due to
their ability to develop large leaves. A significant effect of N application was seen with an
increase of leaf area of main shoots by about 25%. In conclusion, perennial ryegrass and
Material removed due to copyright
15
meadow fescue were found to produce more leaves more quickly than tall fescue, while
tall fescue had larger leaves than perennial ryegrass, with fescue in between. The
experiment was carried out in glasshouses.
Leaf percentage DM (PDM), or relative water content, is the amount of water a plant leaf
contains. Relative water content can provide an indication of the severity of a water
deficit and the degree of stress a plant is under.Plants that maintain a high leaf
percentage DMunder water deficits are likely to have an improved performance under
drought conditions (Pasket al., 2011). Perennial ryegrass has been reported to have a
decline in leaf expansion rate when relative water content is below 88% (Wilson, 1975).
There are gaps in literature in regards pasture grass species relative water content in
leaves.
Specific leaf area (SLA) is a predictor of effective plant productivity. A higher SLA means
more leaf area, resulting in more light interception for photosynthesis per leaf DM. Leaf
thickness is another leaf attribute calculated by (SLA * PDM)-1. There is no literature on
leaf thickness measurements in pasture grass species to the best of my knowledge but it
has been discussed that thicker leaves are a sign that leaves are more stressed and less
palatable(Pasket al., 2011).
2.3.2 Leaf DM
Turner et al. (2012) reported on leaf DM production in a glasshouse trial of tall fescue,
perennial ryegrass and cocksfoot, under different water treatments. The experiment used
applications of 133, 100, 66 and 33% of the replacement water required to maintain
volumetric soil water content at 0.255 mm3 mm-3, similar to the experiment that will be
carried out at Ladbrooks where water was non-limiting over the course of the experiment
(April-June). Table 1 shows the leaf DM production by the three species was consistently
in the order: tall fescue > perennial ryegrass > cocksfoot. Stubble DM of cocksfoot was far
16
Table 1: Mean leaf and stubble dry matter (DM; g plant−1) of cocksfoot (CF), perennial
ryegrass (PR) and tall fescue (TF) under 33, 66, 100 and 133% of the
replacement water required to maintain a soil water potential of −10 kPa, during two regrowth phases and subsequent recovery phase. Adapted from
Turner et al. (2012).
While leaf DM was consistently lower for cocksfoot than for perennial ryegrass and tall
fescue in Turner et al. (2012), cocksfoot was the least drought sensitive of the three
species, and had the smallest relative reduction in DM due to moisture stress. While
perennial ryegrass suffered a 78% reduction in leaf DM owing to the 33% water
treatment (compared with the 100% water treatment), cocksfoot leaf DM only decreased
by 52%. Similarly, in the recovery phase, there was a 58% difference in leaf DM between
perennial ryegrass plants previously watered at 33% compared with 100%, versus a 35%
difference for cocksfoot. Tall fescue displayed an intermediate drought response in this
regard. For tall fescue and perennial ryegrass, there was a pattern of increased leaf DM
with increased prior water allocations during the recovery phase of this experiment. Leaf
extension rate was found to respond to water availability with a pattern of decreased leaf
extension with decreased water availability.
2.3.3 Roots
17
Rooting depth and water use efficiency (WUE) can determine how productive a pasture
is. Moot et al. (2008) calculated the water use efficiencies (WUE) of a range of temperate
pasture species from several different dryland and irrigated pastures in Canterbury. Nine
different data sets were summarised from 2000-2007 and the data collated. The data set
is comprehensive and gives a greater importance to the research as it was spread out
over 7 years with multiple experiments showing similar results. The annual WUE found
ranged from 6.7 kg DM/ ha/mm for a dryland cocksfoot pasture to 18 kg DM/ha/mm for
perennial ryegrass grown on a Wakanui silt loam soil. Perennial ryegrass extracted 243
mm of water to 1.5 m depth. On a stony Lismore soil, perennial ryegrass extracted 129
mm of water to a depth of 1.5 m.
In the same study (Moot et al., 2008) during the year WUE of the ryegrass pasture ranged
from 3 to 22 kg DM/ha/mm. This showed how pasture growth was affected by seasonal
variability in soil moisture deficits, soil evaporation and drainage. When moisture was
non-limiting (spring), clover monocultures and pasture mixtures had higher WUEs than
pure grass swards due to higher herbage nitrogen (N). The results found suggested that
WUE can be maximised annually and seasonally by adopting grazing management
strategies to enhance clover production, strategic applications of N fertiliser and growing
monocultures of legumes, such as lucerne, to maximize growth when soil moisture is
available. This was further backed up by a cocksfoot monoculture having an annual WUE
of 38 kg DM/ha/mm when fertilised with N but only 17 kg DM/ha/mm when unfertilised
(Moot et al., 2008). Cocksfoot forms a dense fibrous root in the top 0.25m of the soil
profile (Ridley and Simpson, 1994), maximising water extraction. Both cocksfoot and
ryegrass have been shown to extract water from similar soil profile depths (Evans, 1978).
2.4 ENVIRONMENT
2.4.1 Climate
Pasture production is variable throughout New Zealand with temperature and rainfall
being the two most important environmental factors affecting pasture growth. Seasonal
18
solar radiation (Biscoe and Gallagher, 1977), creates inconsistency in feed supply (Baars
and Waller, 1979). For instance, pasture production in Central Otago is ~5.0 t DM ha-1 yr-1
compared with 18.0 t DM ha-1 yr-1 for Northland and the Waikato (Matthews et al., 1999).
Annual pasture production is mostly affected by low temperature in winter and soil
moisture content in summer. Annual herbage yield in the Waikato were 11.7 t DM ha-1 yr
-1, 10.9 t DM ha-1 yr-1 in the Wairarapa, 5.9 and 10.2 t DM ha-1 yr-1 for dryland and under
irrigation, respectively, in Canterbury (Valentine and Kemp, 2007). Soil fertility also has a
major effect on productivity. However, a key driver of annual productivity for perennial
pastures is radiation interception (Valentine and Kemp, 2007). After canopy closure, solar
radiation (light interception) will be the main factor responsible for DM production but
prior to canopy closure, temperature will affect the rate at which the canopy expands
(Radcliffe and Baars, 1987). At suboptimal temperatures the photosynthetic rate of plants
is reduced. These environmental variations show how difficult it can be to balance feed
supply and demand of pasture in dryland systems for growing animals.
The influence of environment and climate on the yield of a pasture or crop can be broken
into four levels (de Wit, 1986). The first level, the potential yield for a crop in a region,
determined by local solar radiation and temperature influences on radiation interception
and radiation use efficiency (RUE). Solar radiation and temperature are correlated so
potential yield changes with season and latitude (Monteith, 1977). The second level
relates to the impact of water limitations on potential yield (Jamieson, 1999). Levels three
and four relate to soil conditions in relation to mineral availability/toxicity (Fageriaet al.,
1997). A combination of all four levels contribute to season and location specific yield of
any pasture or crop.
2.4.1 Temperature and light
Temperature influences the rate of leaf appearance and expansion (Thomas, 1975). Light
influences the rate of photosynthesis as well as the rate of tiller and leaf expansion and it
controls the timing of floral development and associated seed production and hence the
distribution of dry matter in the plant (Cooper, 1972). Peacock (1975) reported higher
19
rather than vegetative tillers and not to a temperature response. Thomas & Norris (1977)
also found that both leaf appearance and leaf extension at a given temperature were
greater in spring than autumn.
2.4.2 Moisture and wind
Pasture growth is often restricted by suboptimal levels of soil moisture and nitrogen.
Gates (1974) reported on the effects of water stress on plants, emphasising that moisture
stress lowered the demand and uptake of nutrients by plants and as synthesis rates
declined, the demand for nutrients decreased further. Once water became available
again, young tissues developed rapidly and increased demand for nutrient uptake,
particularly phosphorus.
Gloyne (1976) reviewed crop responses, drawing attention to the lack of experimental
work on pastures. Shelter was shown to increase plant growth in many situations
probably because evapotranspiration may be reduced and sheltered plants have better
root development with a more effective utilization of water. Wind may not necessarily
increase rates of transpiration (Grace 1975). It may even lower leaf temperatures and
decrease the leaf to air water vapour pressure difference so that transpiration rates are
decreased. Plant physiological processes in response to wind are difficult to measure in
on farm scenarios.
2.4.3 Soil
A lot New Zealand of dryland farm systems are based on hill and high country
topography. The high country of New Zealand is largely made up of yellow grey and
yellow brown earths. These soils tend to be more acidic, predominantly with a pH equal
to or less than 5.5. High country soils are acidic due to being shallow and exposed, heavily
leached, low temperatures, high altitudes and exposed slopes and steep terrain all
contribute to acidic soils (McClaren& Cameron, 1996). Because of these factors, high
country areas are less productive than lower rolling country. With soil acidity, pasture
20
Nutrient availability is affected by soil pH (McClaren& Cameron, 1996). New Zealand soils
vary over very short distances which can restrict nutrient supply to pastures (Moiret al.,
2010). Thus, plants can be limited in growth and productivity at varying soil pH. Fig. 2-4
shows as pH levels increase, nitrogen, phosphorus, sulphur, molybdeum, magnesium and
calcium availability increase. At lower pH levels (<5.5), zinc, manganese, iron and copper
availability increase as well as Al levels which can lead to Al toxicity and reduction in
pasture production, especially legumes (Moiret al., 2010). Liming is a management
practice that can raise pH levels in soils and has been shown to increase pH by 0.15 per
tonne of lime application in the 0-7.5 cm soil horizon (Moiret al., 2010). This reduces the
risk of Al toxicity and increases the availability of essential nutrients such as N, P and S.
Applying 1.25 t/ha of lime was reported by Edmeades (1985) to be economical on dryland
farms.
Figure 2-4:The effect of soil pH on nutrient availability (McClaren and Cameron, 1996).
Material removed due to copyright
21
2.4.4 Water/rainfall/drought
New Zealand has a temperate climate (White, 1999), characterised by a low evaporation
and reduced likelihood of water shortages affecting pasture growth when compared to
tropical and Mediterranean climates. However, the east coast of New Zealand is in the
rain shadow of the Alpine mountain ranges and predominant westerly winds. Therefore,
from Gisborne to North Otago, and in inland Central Otago and the McKenzie Basin, there
is a sub-humid climate (400-800 mm rainfall) with dry periods restricting pasture
production during late spring, summer and autumn months (White, 1999). For example,
Lincoln (Canterbury) has an evenly distributed annual rainfall (long-term) of 460 mm per
month, but potential evaporation exceeds this from September-April, reaching a peak of
150 mm per month in December/January. Pasture production in these regions is usually
greatest during the spring, which then declines in the dry summer due to water stress,
increasing again with autumn rainfall and decreases with a decreased temperature in
winter (Radcliffe and Baars, 1987).
Sheep breeding systems occur in theses dryland East Coast areas, where lambs are born
outside in late winter and grown on spring pasture. Surplus stock are then sold in late
spring/early summer so only the breeding stock are carried through the dry summer
period. Breeding stock are generally mated on fresh autumn pasture growth and
wintered on pasture or green-feed crops carried over from the autumn. Alternatively,
stock can be wintered on pasture conserved from a spring surplus or purchased
supplementary feed. 8-16 stock units to a hectare are run on high intensive farms in
these regions. Reductions in pasture production due to rainfall variability each year
impacts on the productivity of stock and farming businesses (Young, 1989). A dry spring
will reduce pasture production and availability to lambs, and in turn reduce sale weights
and values (Rattray et al., 1987). A very dry summer/autumn will reduce the body weight
of ewes, which can effect mating success and conception rates and the number of lambs
born in the following spring.
Woodman et al. (1992) reported on grass performance in dryland environment in
22
= excellent. The pastures were mob grazed twice a year. Cocksfoot performed the best
with a drought tolerance score of 4.25 (Table 2). This is most likely due to the deeper
rooting plant having a greater access to water for a longer period of time during a dry
period when compared to the other grasses. Brome and tall fescue performed fairly well
with a score of 3.50, although were noted to not persist as well during the dry. Perennial
ryegrass had a poor drought tolerance score of 2.50 during the experiment, highlighting
the issue of persistence during dry periods. It must be noted however, that during the
experiment that winter and seasonal rainfall were below averages for the area during the
trial.
Table 2: Overall survival of grasses with mean plant survival ≥20% on lower sunny slopes
at Tara Hills, Omarama. Adapted from Woodman et al., 1992.
2.5 Nitrogen
Nitrogen is an essential macro-element that can limit growth and development in plants
(Andrews et al., 2013). It is important in agricultural systems for pasture and crop growth.
Nitrogen is a component of DNA, RNA, protein and therefore enzymes, chlorophyll, ATP
23
(NO₃⁻) is the main form of nitrogen taken up by plants that is readily available and assimilated by most crop plants in cultivated soils. Nitrate can be assimilated in either the
root or shoot of plants depending on plant species and form of nitrogen supply. Ammonia
(NH₄⁺) can also be the main form of nitrogen taken up by plants in undisturbed soils.
(Andrews et al., 2013).
Nitrogen is assimilated by plants (Andrewset al., 2013). Nitrogen assimilation is the
process where NO₃⁻ and NH₄⁺ in the soil, through nitrification and nitrogen fixation, are incorporated into the shoots and the roots of the plant. Once inside the plant metabolism
occurs, normally starts with reduction of nitrate to nitrite, and then reduces to form
ammonium with the presence of relevant enzymes. This reaction occurs more rapidly in
leaves in the presence of light as photo-reduction of nitrate occurs as the plant uses
energy from the light reactions of photosynthesis in chloroplasts to fuel nitrate
assimilation (CO₂ is fixed in chloroplast as well) (Andrews et al., 2013). If nitrate is assimilated in roots, it is respiration driven, requiring sugars to be transported from the
shoots, down the phloem to the roots.
Increased nitrogen supply will increase the leaf area and chlorophyll pigment density,
hence increasing the rate of photosynthesis. This is important with crop plants due to the
high growth rates shown in the shoot of the plants with high N (Rogers et al., 1996). After
ammonia is formed, it enters into the biosynthetic pathways of plant cells (via
transpiration) to produce different amino acids. Amino acids form proteins and other
nitrogenous compounds that help in body building (increasing cell size, leaf expansion).
Radiation, gaseous factors, soil pH, the presence of metals and the amount of nitrate in
the soil are environmental factors that affect absorption and reduction of nitrogen in
plants (Mokheleet al., 2012).
An indication of pasture or crop N status can be measured by a chlorophyll meter,
measuring leaf greenness and is based on the relationship between plant chlorophyll
concentration and plant nitrogen status. Every chlorophyll molecule contains four
nitrogen atoms and as leaf nitrogen concentration increases, the density of chlorophyll
24
measurement of leaf greenness can be a way of determining leaf N status which in turn is
a good predictor of crop N status and yield of pasture (Rowarth& Archie, 1996; Griffiths &
Thomson, 1996). Kantetyet al. (1996) reported that the chlorophyll meter is an easy and
efficient method of detecting tall fescue N status.
Based on this literature review the following conclusions have been drawn:
•
Cocksfoot, tall fescue and brome are viable alternate pasture species that can be used in dryland systems in New Zealand.•
Pasture production is variable throughout New Zealand with temperature and rainfall being the two most important environmental factors affecting pasturegrowth.
•
Leaf elongation and area is influenced by temperature, water and nitrogen.•
Rooting depth and water use efficiency (WUE) can determine pastureproductivity.
25
3
MATERIALS AND METHODS
This chapter describes the methodology and data analysis for the field experiment which
provided the results presented in Chapter 4. The experiments focus on the production of
cocksfoot, tall fescue, brome, and perennial ryegrass monocultures under two levels of
soil moisture and two levels of nitrogen fertilizer. The plants were established from the
seeds sown in October 2014.
3.1 Experimental site
Ladbrooks (43.37ʹS, 172°.30ʹE, 12 m.a.s.l) is the site where the experiment was established on 0.357 ha of a flat land in 2014. It is a Field Research Farm for Seed Force
Limited and was monitored from 1st April through to 30th June 2017.
Plate 3-1:Ladbrooks experiment site.
3.2 Paddock history
In 2012 Ladbrooks was planted in kale (Brassica oleracea) and in rape (Brassica napus). In
26
When annual ryegrass was sown in March 2013, a mixture of Urea and 200 kg/ha/year of
Cropmaster 20 (19.3, 10, and 12.5) was applied to the entire area. From January to
September 2014, immediately prior to this experiment, the area was uncultivated. It was
sprayed with Roundup (glyphosate) at 1.4 kg a.i/ha, at the end of September 2014.
3.3 Soil characteristics
Ladbrooks site is flat to very gently undulating land with severe drainage/permeability
restrictions. The experimental site is located over the boundary of an imperfectly drained
Wakanui silt loam (Mottled Immature Pallic) soil at the northeast end and a poorly
drained Temuka clay (TypicOrthicGley) at the southwest
(http://smap.landcareresearch.co.nz). Ladbrooks soil is deep (>1m) and stone less with
50-100 cm potential for rooting depth (http://smap.landcareresearch.co.nz). It has very
poor drainage and very limited aeration in the root zone. Water logging vulnerability at
Ladbrooks site is high and the drought vulnerability (if irrigated) is low.
3.4 Meteorological conditions
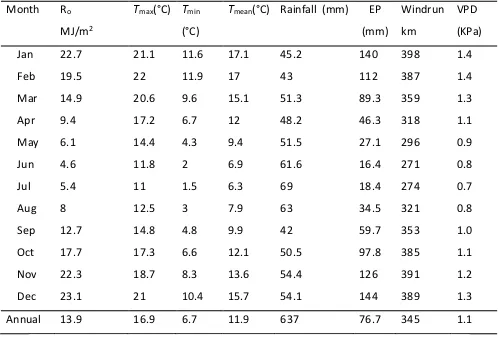
Long term average for meteorological data from 1975-2012 are presented in Table 3.
Canterbury’s climate is categorised as cool and temperate with an average annual rainfall
of 636.5 mm equally spread over the year. Annual mean temperature is 12°C, ranging
from an average of 6.3°C in July to 17.1°C in January (Table 3). Annual average Penman
27
Table 3: Monthly means from 1975 to 2012 for total solar radiation (Ro), maximum (Tmax), minimum (Tmin) and mean (Tmean) air temperatures (°C), rainfall
(mm), Penman potential evapotranspiration (EP), wind run (km/day), and
vapour pressure deficit (VPD). From 1975-2000 measurements were taken at
EdlBroadfields Meteorological Station, Lincoln, Canterbury, New Zealand. From
2000-2012 measurements were taken from EwsBroadfields Meteorological
Station, Lincoln, Canterbury, New Zealand.
Month Ro
MJ/m2
Tmax(°C) Tmin
(°C)
Tmean(°C) Rainfall (mm) EP
(mm)
Windrun
km
VPD
(KPa)
Jan 22.7 21.1 11.6 17.1 45.2 140 398 1.4
Feb 19.5 22 11.9 17 43 112 387 1.4
Mar 14.9 20.6 9.6 15.1 51.3 89.3 359 1.3
Apr 9.4 17.2 6.7 12 48.2 46.3 318 1.1
May 6.1 14.4 4.3 9.4 51.5 27.1 296 0.9
Jun 4.6 11.8 2 6.9 61.6 16.4 271 0.8
Jul 5.4 11 1.5 6.3 69 18.4 274 0.7
Aug 8 12.5 3 7.9 63 34.5 321 0.8
Sep 12.7 14.8 4.8 9.9 42 59.7 353 1.0
Oct 17.7 17.3 6.6 12.1 50.5 97.8 385 1.1
Nov 22.3 18.7 8.3 13.6 54.4 126 391 1.2
Dec 23.1 21 10.4 15.7 54.1 144 389 1.3
Annual 13.9 16.9 6.7 11.9 637 76.7 345 1.1
3.5 Agronomic management
3.5.1 Experimental design and treatments
In the first year of the study (2014/15), both Experiments 1 and 2 were a Latin square
design with four grasses and four replicates. This was due to the environmental gradients
including a ditch in the Northern corner of the paddock and variability in soil nitrogen
background which was extended from the North to South of the paddock at Ladbrooks. In
28
experimental design was modified to include ±N fertiliser treatments. The 16 plots at
each site were halved to accommodate the additional treatments and the experiment
was subsequently analysed as a strip-plot designed experiment with ±N as the rows and
pasture species as columns (Fig 3-1). The 2017 experiment carried out at Ladbrooks is the
same as the 2015/16 design. Nitrogen was applied as strip lines in each block and
randomized within each block. There were 32 plots and individual plot size for the
strip-plot experiment 6.3 x 9 m for Experiment 1 at Ladbrooks. There was limited available
30
3.5.2 Seedbed preparation
MCPB (4-(4-chloro-o-tolyloxy) butyric acid; 1.5 kg a.i./ha) was used to control weeds on
4/8/2014. The main weeds at Ladbrooks were fathen (Chenopodium album), wire weed
(polygonumarenastrum), stinging nettle (Urticadioica), shepherd's-purse (Capsella
bursa-pastoris), and white clover (T. repens).
3.5.3 Establishment
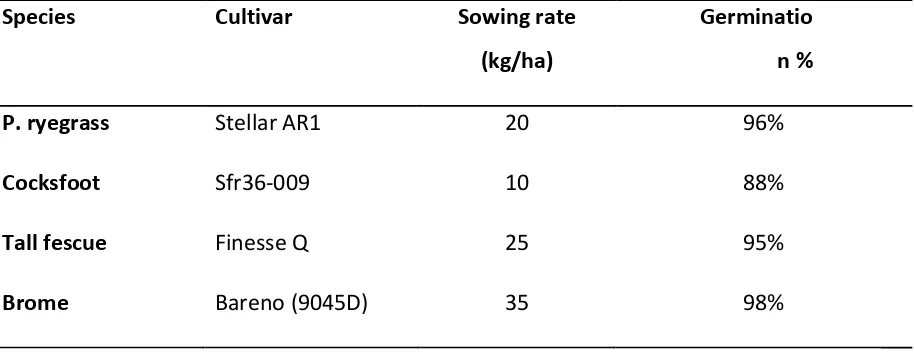
A single application of 350 kg/ha of Cropzeal 20 (NPKS) was applied to the site on
9/9/2014. On 10/10/2014 cultivation took place at Ladbrooks. On 16/10/2014 the site
was Cambridge-rolled just before sowing. Sowing rates are found below in Table 4.
Table 4: Cultivars, sowing rate (kg/ha) and germination percentage of four grass species at Ladbrooks.
Species Cultivar Sowing rate
(kg/ha)
Germinatio n %
P. ryegrass Stellar AR1 20 96%
Cocksfoot Sfr36-009 10 88%
Tall fescue Finesse Q 25 95%
Brome Bareno (9045D) 35 98%
3.5.4 Soil fertility
Soil samples were taken on 30/7/2014 at Ladbrooks. The samples contained 12 cores
taken randomly to a depth of 150 mm of the top soil from each experimental site (Table
5).
To assess the amount of nitrogen fertilizer required to be applied to the nitrogen
fertilised (N+) sub-plots, on 9/9/2015 soil samples were taken from the both sites. In
2015, once plants established at Ladbrooks, uneven growth was visible within different
31
of the paddock, separate soil samples were taken from areas with nitrogen background
as well as other areas. Based on soil test results (Table 5), in the first application of nitrogen fertilizer, less nitrogen fertilizer was applied (Appendix 1) to the area with
nitrogen background.
Table 5:Soil test results (0-150 mm) from Ladbrooks site, Canterbury, New Zealand.
Year Site pH Olsen P
(μg/ml)
SO4-S
(μg/g)
Ca2+ K+ Mg2+(m
eq/100g
)
Na+ Available N
(kg/ha)
2014 Ladbrooks 6.5 83 25 18.4 0.51 2.34 0.39 -
2015 Ladbrooks(
a)
6.1 47 - 13.8 0.32 2.23 0.41 103
2015 Ladbrooks(
b)
5.9 73 - 18.5 0.53 2.72 0.48 128
3.5.5 Weed control after establishment
On 1/1/2015 site was sprayed with Trimec (600g/L mecoprop, 150g/L MCPA and 18.7g/L
dicamba; 13.30 kg/a.i/ha) to control fathen, wire weed, stinging nettle and
shepherd's-purse.
3.5.6 Mowing and defoliation management
At the end of each growth cycle, herbage was mown to a residual cutting height of ~30
mm by a Field Master Forage Harvester with a collection cage. This machine was unable
to mow around and between the neutron access tubes. So, an area of 2 m2 around each
tube was hand cut followed by the use of a lawn mower to cut the grass area between
the tubes. On all mowing dates, mown herbage mass was carried with the collection cage
and removing out of the experimental site. The frequency of mowing and regrowth
32
3.5.7 Nitrogen fertilizer
In 2015/16, a total annual application of 900 kg N/ha/y was applied in eight split
applications of 100 kg N/ha and one application of 200 kg N/ha, at the beginning of each
regrowth cycle.
Based on the soil test results, six sub-plots at Ladbrooks (plots 22, 23, 24, 26, 27, 28)
showed a background nitrogen (Table 5). Therefore, on 18/9/2015, 50 kg N /ha was
applied to the +N sub-plots located in those areas. 100 kg N/ha was applied to the rest of
+N sub-plots at the same date. 50 kg N/hanitrogen fertilizer was applied to all N+ plots on
10th March 2017.
Plate 3-2:Nitrogen treatment split plot design at Ladbrooks 2017.