SHORT REPORT
Poor glycaemic control is associated
with reduced exercise performance and oxygen
economy during cardio-pulmonary exercise
testing in people with type 1 diabetes
Othmar Moser
1,2*, Max L. Eckstein
1,2, Olivia McCarthy
1,2, Rachel Deere
1,2, Stephen C. Bain
1, Hanne L. Haahr
3,
Eric Zijlstra
4and Richard M. Bracken
1,2Abstract
Background: To explore the impact of glycaemic control (HbA1c) on functional capacity during cardio-pulmonary exercise testing in people with type 1 diabetes.
Methods: Sixty-four individuals with type 1 diabetes (age: 34 ± 8 years; 13 females, HbA1c: 7.8 ± 1% (62 ± 13 mmol/ mol), duration of diabetes: 17 ± 9 years) performed a cardio-pulmonary cycle ergometer exercise test until volitional exhaustion. Stepwise linear regression was used to explore relationships between HbA1c and cardio-respiratory data with p ≤ 0.05. Furthermore, participants were divided into quartiles based on HbA1c levels and cardio-respiratory data were analysed by one-way ANOVA. Multiple regression analysis was performed to explore the relationships between changes in time to exhaustion and cardio-respiratory data. Data were adjusted for confounder.
Results: HbA1c was related to time to exhaustion and oxygen consumption at the power output elicited at the sub-maximal threshold of the heart rate turn point (r = 0.47, R2
= 0.22, p = 0.03). Significant differences were found at time to exhaustion between QI vs. QIV and at oxygen consumption at the power output elicited at the heart rate turn point between QI vs. QII and QI vs. QIV (p < 0.05). Changes in oxygen uptake, power output and in oxygen consump-tion at the power output elicited at the heart rate turn point and at maximum power output explained 55% of the variance in time to exhaustion (r= 0.74, R2
= 0.55, p < 0.01).
Conclusions: Poor glycaemic control is related to less economical use of oxygen at sub-maximal work rates and an earlier time to exhaustion during cardio-pulmonary exercise testing. However, exercise training could have the same potential to counteract the influence of poor glycaemic control on functional capacity.
Trial registration NCT01704417. Date of registration: October 11, 2012
Keywords: Glycaemic control, Exercise performance, Oxygen economy, Type 1 diabetes, Heart rate turn point
© The Author(s) 2017. This article is distributed under the terms of the Creative Commons Attribution 4.0 International License (http://creativecommons.org/licenses/by/4.0/), which permits unrestricted use, distribution, and reproduction in any medium, provided you give appropriate credit to the original author(s) and the source, provide a link to the Creative Commons license, and indicate if changes were made. The Creative Commons Public Domain Dedication waiver (http://creativecommons.org/ publicdomain/zero/1.0/) applies to the data made available in this article, unless otherwise stated.
Introduction
Type 1 diabetes (T1D) is associated with an increased risk of cardio-vascular disease (CVD) compared to peo-ple without diabetes. Although regular physical activity
is encouraged as a cornerstone of good diabetes man-agement [1, 2], physical inactivity rates remain high [3]. Patients often cite low functional capacity and loss of metabolic control (short-term and/or long term glycae-mic disturbances) as barriers to beginning or maintaining regular physical activity [4].
Functional capacity, defined as the ability to perform aerobic work during maximal exercise testing can be assessed by means of cardio-pulmonary exercise (CPX)
Open Access
*Correspondence: [email protected]
2 Applied Sport, Technology, Exercise and Medicine Research Centre
(A-STEM), College of Engineering, Swansea University, Fabian Way, Crymlyn Burrows, Skewen, SA1 8EN Swansea, UK
testing. This non-invasive, sensitive test provides an assessment of integrative responses of cardiovascular, pulmonary and musculoskeletal systems across a sub-maximal to sub-maximal continuum and can be utilised to identify fatigue of cardiovascular or respiratory ori-gin [5]. Most reported studies in people with T1D have assessed maximum cardio-pulmonary values such as the peak oxygen uptake (VO2peak) [6–8]. VO2peak is the
high-est rate of oxygen that can be consumed during exercise involving the majority of muscle mass at sea-level and is defined by the Fick equation as the product of cardiac output and arteriovenous oxygen difference [5]. Achiev-ing a true VO2peak requires strong motivation and
physi-cal fitness, but for people with T1D with ‘low exercise tolerance’ the perception of exercise-induced pain may encourage premature test termination. In addition, the presence of diabetes complications such as neuropathy, nephropathy and underlying CVD may exacerbate pain or damage during exercise and reduce the validity of CPX testing in detailing accurate maximum cardio-respira-tory parameters e.g. VO2 plateau, maximum heart rate
(HRmax).
Most activities in daily life are performed at low-to moderate intensity and do not require maximum cardio-respiratory effort. It may be more relevant in people with T1D to explore cardio-respiratory data obtained dur-ing sub-maximal stages of CPX testdur-ing. The rate of oxy-gen use at sub-maximal exercise intensities provides an indication of the economy of use of oxygen for an indi-vidual to the work rate and has been shown to predict endurance performance in healthy individuals [9]. Fur-thermore, identification of the sub-maximal work rate at which there is an increase in use of non-oxidative fuel sources (i.e. cellular glycolysis) results in a greater pro-duction of carbon dioxide (CO2), pyruvate and lactic acid
fermentation. Identification of such ‘thresholds’ involv-ing ventilation, heart rate and/or blood lactate have been studied as sub-maximal predictors of endurance capac-ity in healthy cohorts and in people with chronic disease [5]. As an example the heart rate turn point (HRTP), which is based on findings from Conconi et al., was sig-nificantly associated with the second lactate threshold [10–13]. This heart rate derived threshold is defined as the intersection of two regression lines of the heart rate to performance curve between early stages of CPX test-ing [peri-first lactate turn point (LTP1)] and maximum
power output (Pmax), determined from a second-degree
polynomial representation satisfying the condition of least error squares [14]. However, there is a lack of infor-mation about their use in people with T1D in predicting functional capacity.
Lower maximum cardio-respiratory variables have been reported in participants with T1D compared to
healthy individuals in some studies but not in others [8,
15]. A review by Baldi et al. [16] shed some light on the influence of glycaemic control within people with T1D and when compared to healthy individuals. Patients with poor glycaemic control demonstrated a lower peak func-tional capacity than those patients with good glycaemic control. No information currently exists on the influence of glycaemic control on sub-maximal cardio-respiratory parameters obtained from a CPX test. Such information might reveal additional insights on the impact of glycae-mia on the functioning of the cardio-vascular and res-piratory system and provide further support for the use of moderate intensity exercise tests that reduce stress on the patient.
The aim of this study was to examine the relationship of glycaemic control to sub-maximal and maximum cardio-pulmonary markers obtained during CPX testing in peo-ple with T1D.
Materials and methods Participant characteristics
Adults (aged 18–45 years, both inclusive) with T1D eligible for the study had a body mass index (BMI) of 18–27 kg/m2, glycated haemoglobin (HbA
1c) level ≤ 9.5%
(80 mmol/mol) and were performing regular physi-cal cardiorespiratory exercise during the last 3 months before screening. Exclusion criteria included cancer, cardiac diseases, supine blood pressure outside the range 90–140 mmHg for systolic blood pressure or 50–90 mmHg for diastolic blood pressure, recurrent severe hyperglycaemia or hypoglycaemia unawareness and smoking [17]. Sixty-four people with T1D were included for analyses (Table 1). Data were extracted from a clinical trial (NCT01704417) [17].
Study procedures
(> 19.4 mmol/l) occurred before or during CPX testing. The timing of bolus insulin injection was not exactly pre-defined, but participants were told to avoid the peak action of bolus insulin during CPX testing (this means avoiding bolus insulin injections less than 120 min prior to the start of CPX testing). Participants performed a CPX test until volitional exhaustion on a cycle ergom-eter (Ergospiromergom-eter PowerCube®-Ergo, Ganshorn Medizin Electronic, GER). Participants sat quietly on the cycle ergometer for 3 min (0 W) before they started the warm-up period of 3 min cycling at a workload of 30 W for females and 40 W for males. Then, the workload was increased by 30 W for females and 40 W for males every 3 min until maximum volitional exhaustion. Finally, a cool-down period was performed for 1 min.
Measurements
Pulmonary gas exchange variables were collected con-tinuously by breath-by-breath measurement and then averaged over 10 s. VO2peak was defined as the 1 min
average in oxygen (O2) consumption during the
high-est work rate. Heart rate and blood pressure were
measured continuously via a 12-lead electrocardiogram and an automatic sphygmomanometer (Ergospirometer PowerCube®-Ergo, Ganshorn Medizin Electronic, GER).
The non-invasive anaerobic threshold was defined by the HRTP [18]. HRTP was demarcated as the intersection of two regression lines of the heart rate to performance curve between post-warm-up and maximum power out-put (Pmax), determined from the second-degree
polyno-mial representation satisfying the condition of least error squares [14]. Additionally, the second ventilatory thresh-old (VT2) was determined by means of the ventilation/
carbon dioxide (VE/VCO2) slope [19] to control for the
accuracy of HRTP.
Statistical analysis
Data (10 s average) were expressed as absolute values and relative to maximum physiological variables and Pmax. Data were tested for distribution via Shapiro-Wilks
normality test and non-normal distributed data were log transformed. Stepwise linear regression was used to explore relationships between glycaemic control (HbA1c)
and CPX obtained cardio-respiratory data and perfor-mance markers with p ≤ 0.05. Data were adjusted for sex, age, BMI, blood glucose concentration at the start of CPX testing and duration of diabetes. Post hoc power analysis for the primary outcome [stepwise linear regres-sion: dependent variable HbA1c levels, independent
vari-ables time to exhaustion (Timemax) and oxygen economy
at HRTP] resulted in a power (1-beta error probability) of 0.96.
Participants were divided into quartiles (Q) based on HbA1c levels, and respective sub-maximal and maximal
CPX derived cardio-respiratory data and performance markers were analysed by one-way analysis of variance (ANOVA) followed by a fishers least significant differ-ence multiple comparison post hoc test (LSD). Multiple regression analysis was performed to explore relation-ships between changes in Timemax and independent
vari-ables, VO2peak and oxygen uptake at the heart rate turn
point (VO2HRTP), body mass adjusted values of Pmax and
power output at the heart rate turn point (PHRTP) as well
as oxygen economy at Pmax [VO2peak/Pmax (ml/min/W)]
and at HRTP [VO2HRTP/PHRTP (ml/min/W)]. All
statis-tics were performed with a standard software package of SPSS software version 22 (IBM Corporation, USA) and Prism Software version 7.0 (GraphPad, USA).
Results
Exercise performance data
Maximum physiological parameters were found at HRmax
of 185 ± 11 b/min, VO2peak 37 ± 5 ml/kg/min, respiratory
exchange ratio (RER) 1.22 ± 0.09 and Pmax 231 ± 47 W.
No significant differences were found between the HRTP
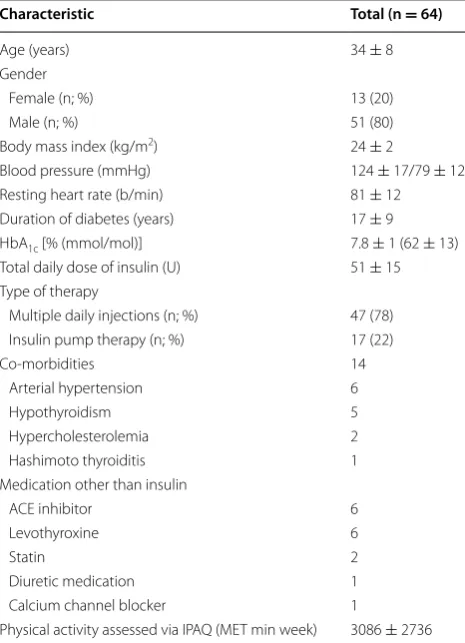
Table 1 Participant characteristics given as mean ± SD and percentage (%)
Characteristic Total (n = 64)
Age (years) 34 ± 8
Gender
Female (n; %) 13 (20)
Male (n; %) 51 (80)
Body mass index (kg/m2) 24 ± 2
Blood pressure (mmHg) 124 ± 17/79 ± 12
Resting heart rate (b/min) 81 ± 12
Duration of diabetes (years) 17 ± 9
HbA1c [% (mmol/mol)] 7.8 ± 1 (62 ± 13)
Total daily dose of insulin (U) 51 ± 15
Type of therapy
Multiple daily injections (n; %) 47 (78)
Insulin pump therapy (n; %) 17 (22)
Co-morbidities 14
Arterial hypertension 6
Hypothyroidism 5
Hypercholesterolemia 2
Hashimoto thyroiditis 1
Medication other than insulin
ACE inhibitor 6
Levothyroxine 6
Statin 2
Diuretic medication 1
Calcium channel blocker 1
and the VT2 as well as for the comparison of pre- and
post-exercise blood glucose concentration as given in Table 2.
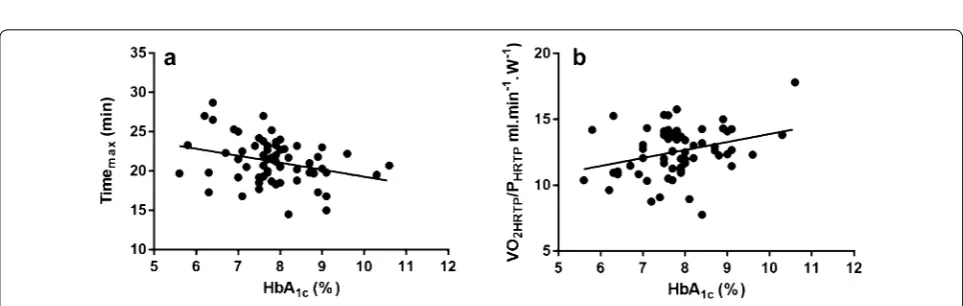
Glycaemic control and functional capacity
As shown in Fig. 1, sex-, age-, BMI-, blood glucose con-centration at the start of CPX testing- and duration of diabetes-adjusted stepwise linear regression model revealed that HbA1c was related to Timemax and oxygen
consumption at the power output elicited at the sub-maximal threshold of the heart rate turn point (VO2HRTP/
PHRTP) (r = 0.47, R2 = 0.22, p = 0.03).
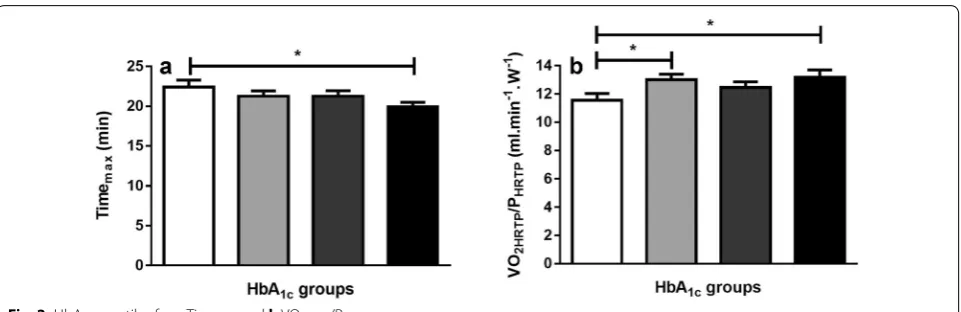
Grouped HbA1c levels and functional capacity
Grouping participants based on quartiles of glycae-mic control resulted in HbA1c levels of 6.7 ± 0.5%
(49 ± 6 mmol/mol) for quartile I, 7.6 ± 0.1% (60 ± 1 mmol/mol) for quartile II, 8.0 ± 0.1% (63 ± 1 mmol/mol) for quartile III and 9.1 ± 0.6% (76 ± 7 mmol/mol) for quartile IV (p < 0.01). No sig-nificant differences were found for physical activity (p = 0.68), resting HR (p = 0.42), systolic blood pres-sure (p = 0.18) and diastolic blood pressure (p = 0.83) between groups.
Significant differences were found at Timemax between
QI vs. QIV (mean difference 2.5 ± 1.0 min, p = 0.02) and at VO2HRTP/PHRTP between QI vs. QII (− 1.5 ± 0.6 ml/
min/W, p = 0.02) and QI vs QIV (− 1.6 ± 0.71 ml/ min/W, p = 0.01) (Fig. 2).
White bar = QI (HbA1c 6. ± 0.5%; 4 ± 6 mmol/
mol), bright-grey bar = QII (HbA1c 7. ± 0.1%;
60 ± 1 mmol/mol), dark-grey bar = QIII (HbA1c
8. ± 0.1%; 6 ± 1 mmol/mol) and black bar = QIV (HbA1c
9.1 ± 0.6%; 7 ± 7 mmol/mol). Values are given as mean and SD. “*” represents p ≤ 0.05.
Relationships of time to exhaustion and cardio‑pulmonary responses during CPX testing
Multiple regression analysis revealed that changes in VO2peak, VO2HRTP, Pmax, PHRTP, VO2HRTP/PHRTP as well
as VO2peak/Pmax constitute independent predictors of
Timemax (r = 0.74, p < 0.01) and those variables could
explain 55% of the alteration in Timemax.
Discussion
This study demonstrated an important relationship between glycaemic control and the cardio-respiratory responses to CPX testing in people with T1D. Exercise
Table 2 Comparison of the anaerobic thresholds derived from HRTP and VT2 as well as pre- and post-exercise blood glu-cose levels
Results are given as mean ± SD
HRTP VT2 p value
VO2 (l/min) 2.09 ± 0.50 2.17 ± 0.50 0.41
HR (b/min) 158 ± 14 157 ± 17 0.63
P (W) 169 ± 39 172 ± 38 0.45
VE (l/min) 55 ± 13 58 ± 14 0.26
Pre‑exercise Post‑exercise p value
BG (mmol/l) 9.3 ± 3.4 10 ± 3.2 0.06
economy is defined as the rate of oxygen use at a given workload. We found that individuals with poorer glycae-mic control (higher HbA1c values) displayed a higher rate
of O2 use at a sub-maximal work rate (HRTP) and
ear-lier Timemax. This result is confirmed by the findings from
Tagougui et al. in which the increase in deoxyhemoglobin (reflection of relative tissue deoxygenation) in the vastus lateralis was blunted in patients with T1D and with poor glycaemic control during CPX testing [20]. Interestingly, the maximum oxygen consumption was negatively corre-lated with changes in deoxyhemoglobin.
Our findings are in contrast to recent studies evaluating the association between glycaemic control and functional capacity [6, 8]. Stubbe et al. could not find an association between HbA1c levels and the O2 uptake at the anaerobic
lactate threshold [8]. This contrast in comparison to our results might explained by lower and more homogene-ous HbA1c levels as observed in our cohort. The variation
in glycaemic control and its upper and lower extremes clearly contributed to the association between HbA1c
lev-els and rates of O2 use at the HRTP. Turinese et al. also
did not find significant relationships between the glycae-mic control and CPX derived markers [6]. However, the lack of associations might be originated by the low num-ber of participants (N = 17).
There may be several postulated reasons for our find-ings. During exercise, skeletal muscle consumes most of the inhaled O2 and a greater O2 cost for a given exercise
intensity might indicate fibre atrophy and/or morpho-logical abnormalities in the mitochondria [21]. Reduced skeletal muscle mitochondrial ATP production rates have also been associated with poor glycaemic control [22]. Furthermore, the capillary density surrounding skeletal muscle has been shown to be lower in individu-als with T1D [23]. A reduced oxidative capacity within prime mover muscles increases dependence on support-ing muscles, and increases the overall oxygen cost of the activity for a given workload. Furthermore, an earlier
limit on O2 use within a muscle shifts energy metabolism
towards non-oxidative glycolysis and an earlier lowered pH [24]. Alternatively, oxygen supply systems may be compromised more in individuals with poorer glycaemic control. Red blood cell dynamics have been shown to be altered in T1D rats [25] with velocity and flux reduced in comparison to non-diabetics, albeit with a similar haematocrit.
People with T1D may display cardiomyopathy and this seems dependent on the HbA1c value which has been
hypothesised to alter cardiac structure, e.g. increased left ventricular wall thickness and mass, and impaired dias-tolic function. Interestingly, poor glycaemic control was associated with reduced stroke volume and cardiac out-put in athletes with T1D compared with non-diabetic individuals, despite an equivalent amount of training [26]. This reduction in stroke volume might be caused by earlier diastolic dysfunction, which reduces the atrioven-tricular pressure gradient and causes early diastolic left ventricular filling [16].
The decreased economy at early stages during CPX testing translated to shorter exercise test duration. Indeed, approximately 55% of the shorter total exer-cise time could be accounted for lowered O2 uptake,
decreased power output and less economical use of O2
for both at the HRTP and maximum power. Taken this into account, it might be that regular exercise training, which increases these physiological parameters, might have similar potential to neutralise the negative influence of glycaemic control on functional capacity [27] and even on cardiovascular autonomic regulation [28].
catecholamine response which in turn altered cardiac function during CPX testing.
Conclusions
In conclusion, in this well-characterised study, individu-als with T1D and poorer glycaemic control displayed less economical use of oxygen at sub-maximal work rates and an earlier time to exhaustion during CPX testing. Nev-ertheless, exercise training could have the same potential to counteract the influence of poor glycaemic control on functional capacity.
Abbreviations
T1D: type 1 diabetes; CVD: cardio-vascular disease; CPX: cardio-pulmonary exercise; VO2peak: peak oxygen uptake; HRmax: maximum heart rate; CO2:
carbon dioxide; HRTP: heart rate turn point; LTP1: first lactate turn point; Pmax:
maximum power output; IPAQ: International Physical Activity Questionnaire; VT2: second ventilatory; VE/VCO2 slope: ventilation/carbon dioxide slope;
BMI: body mass index; HbA1c: glycated haemoglobin; O2: oxygen; Q: quartiles;
ANOVA: analysis of variance; LSD: fishers least significant difference multiple comparison post hoc test; Timemax: time to exhaustion; VO2HRTP: oxygen
uptake at the heart rate turn point; PHRTP: power output at the heart rate turn
point; RER: respiratory exchange ratio; HRHRTP: heart rate at the heart rate turn
point.
Authors’ contributions
OM, RMB, EZ, SCB and HLH designed the study. EZ supervised exercise testing. OM, RMB, MLE, OMc and RD analysed and interpreted the data. OM, RMB and SCB wrote the first draft of the paper. EZ, MLE, OMc, RD and HLH edited the paper. All authors contributed to the writing of the paper. All authors read and approved the final manuscript.
Author details
1 Diabetes Research Group, Medical School, Swansea University, SA2
8PP Swansea, UK. 2 Applied Sport, Technology, Exercise and Medicine
Research Centre (A-STEM), College of Engineering, Swansea University, Fabian Way, Crymlyn Burrows, Skewen, SA1 8EN Swansea, UK. 3 Novo Nordisk
A/S, Vandtårnsvej 108, 2860 Søborg, Denmark. 4 Profil, Hellenbergsstraße 9,
41460 Neuss, Germany.
Acknowledgements
Data were extracted from a clinical trial (NCT01704417).
Competing interests
OM has received lecture fees from Medtronic and received a grant from Sêr Cymru II COFUND fellowship/European Union. MLE has received a KESS2/ European Social Fund scholarship. SCB reports having received honoraria, teaching and research grants from the Abbott, Astra Zeneca, Boehringer Ingel-heim, BMS, Diartis, Eli Lily and Company, GlaxoSmithKline, Johnson & Johnson, Merck Sharp& Dohme, Novartis, Novo Nordisk, Pfizer, Roche, Sanofi-Aventis, Schering-Plough, Servier and Takeda. RMB reports having received honoraria, travel and educational grant support from, Boehringer-Ingelheim, Eli Lily and Company, Novo Nordisk, Sanofi-Aventis. EZ, RD and OMc have no disclosures to report. HLH is employee and shareholder in Novo Nordisk A/S.
Availability of data and materials
The datasets used and/or analysed during the current study are available from the corresponding author on reasonable request.
Consent for publication
Informed consent for publication was obtained before any trial related activities.
Ethics approval and consent to participate
All procedures performed were in accordance with Good Clinical Practice (GCP) the ethical standards of the national research committee and with
the 1964 Helsinki Declaration and its later amendments. The study protocol was approved by an independent ethics committee (Ethikkommission der Ärztekammer Nordrhein; Reference Number: 2012269). Written informed consent was obtained before any trial related activities.
Funding
The study was sponsored by Novo Nordisk A/S. Novo Nordisk A/S contributed only as a sponsor for this trial.
Publisher’s Note
Springer Nature remains neutral with regard to jurisdictional claims in pub-lished maps and institutional affiliations.
Received: 3 October 2017 Accepted: 15 November 2017
References
1. Riddell MC, Gallen IW, Smart CE, et al. Exercise management in type 1 dia-betes: a consensus statement. Lancet Diabetes Endocrinol. 2017;8587:1– 14. https://doi.org/10.1016/S2213-8587(17)30014-1.
2. Codella R, Terruzzi I, Luzi L. Why should people with type 1 diabetes exer-cise regularly? Acta Diabetol. 2017;54:615–30. https://doi.org/10.1007/ s00592-017-0978-x.
3. Plotnikoff RC, Taylor LM, Wilson PM, et al. Factors associated with physi-cal activity in Canadian adults with diabetes. Med Sci Sports Exerc. 2006;38:1526–34. https://doi.org/10.1249/01.mss.0000228937.86539.95. 4. Brazeau AS, Rabasa-Lhoret R, Strychar IMH. Barriers to physical activity
among patients With type 1 diabetes. Diabetes Care. 2008;31:2108–9. https://doi.org/10.2337/dc08-0720.
5. Balady GJ, Arena R, Sietsema K, et al. Clinician’s guide to cardiopulmonary exercise testing in adults: a scientific statement from the American heart association. Circulation. 2010;122:191–225. https://doi.org/10.1161/ CIR.0b013e3181e52e69.
6. Turinese I, Marinelli P, Bonini M, et al. Metabolic and cardiovascular response to exercise in patients with type 1 diabetes. J Endocrinol Invest. 2017. https://doi.org/10.1007/s40618-017-0670-6.
7. Gusso S, Pinto TE, Baldi JC, et al. Diastolic function is reduced in ado-lescents with type 1 diabetes in response to exercise. Diabetes Care. 2012;35:2089–94. https://doi.org/10.2337/dc11-2331.
8. Stubbe B, Schipf S, Schäper C, et al. The influence of type 1 diabetes mellitus on pulmonary function and exercise capacity—results from the study of health in pomerania (SHIP). Exp Clin Endocrinol Diabetes. 2017;125:64–9. https://doi.org/10.1055/s-0042-112219.
9. Yoshida T, Udo M, Iwai K, Yamaguchi T. Physiological characteristics related to endurance running performance in female distance runners. J Sports Sci. 1993;11:57–62. https://doi.org/10.1080/02640419308729964. 10. Conconi F, Ferrari M, Ziglio PG, et al. Determination of the
anaero-bic threshold by a noninvasive field test in runners. J Appl Physiol. 1982;52:869–73.
11. Ribeiro JP, Fielding RA, Hughes V, et al. Heart rate break point may coin-cide with the anaerobic and not the aerobic threshold. Int J Sports Med. 1985;6:220–4. https://doi.org/10.1055/s-2008-1025844.
12. Hofmann P, Bunc V, Leitner H, et al. Heart rate threshold related to lactate turn point and steady-state exercise on a cycle ergometer. Eur J Appl Physiol Occup Physiol. 1994;69:132–9.
13. Bunc V, Hofmann P, Leitner H, Gaisl G. Verification of the heart rate thresh-old. Eur J Appl Physiol Occup Physiol. 1995;70:263–9.
14. Hofmann P, Pokan R, Duvillard S, et al. Heart rate performance curve dur-ing incremental cycle ergometer exercise in healthy young male subjects. Med Sci Sport Exerc. 1997;195:762–8.
15. Veves A, Saouaf R, Donaghue VM, et al. Aerobic exercise capacity remains normal despite impaired endothelial function in the micro- and macrocir-culation of physically active IDDM patients. Diabetes. 1997;46:1846–52. 16. Baldi JC, Hofman PL. Does careful glycemic control improve
• We accept pre-submission inquiries
• Our selector tool helps you to find the most relevant journal
• We provide round the clock customer support
• Convenient online submission
• Thorough peer review
• Inclusion in PubMed and all major indexing services
• Maximum visibility for your research
Submit your manuscript at www.biomedcentral.com/submit
Submit your next manuscript to BioMed Central
and we will help you at every step:
17. Heise T, Bain SC, Bracken RM, et al. Similar risk of exercise-related hypo-glycaemia for insulin degludec to that for insulin glargine in patients with type 1 diabetes: a randomized cross-over trial. Diabetes Obes Metab. 2016;18:196–9. https://doi.org/10.1111/dom.12588.
18. Beckers PJ, Possemiers NM, Van Craenenbroeck EM, et al. Comparison of three methods to identify the anaerobic threshold during maximal exer-cise testing in patients with chronic heart failure. Am J Phys Med Rehabil. 2012;91:148–55. https://doi.org/10.1097/PHM.0b013e3182411d69. 19. Wasserman K, Whipp BJ, Davis JA. Respiratory physiology of exercise:
metabolism, gas exchange, and ventilatory control. Int Rev Physiol. 1981;23:149–211.
20. Tagougui S, Leclair E, Fontaine P, et al. Muscle oxygen supply impairment during exercise in poorly controlled type 1 diabetes. Med Sci Sports Exerc. 2015;47:231–9. https://doi.org/10.1249/MSS.0000000000000424. 21. Reske-Nielsen E, Harmsen A, Vorre P. Ultrastructure of muscle biopsies in
recent, short-term and long-term juvenile diabetes. Acta Neurol Scand. 1977;55:345–62.
22. Karakelides H, Asmann YW, Bigelow ML, et al. Effect of insulin deprivation on muscle mitochondrial ATP production and gene transcript levels in type 1 diabetic subjects. Diabetes. 2007;56:2683–9.
23. Krause MP, Riddell MC, Hawke TJ. Effects of type 1 diabe-tes mellitus on skeletal muscle: clinical observations and
physiological mechanisms. Pediatr Diabetes. 2011;12:345–64. https://doi. org/10.1111/j.1399-5448.2010.00699.x.
24. Crowther GJ, Milstein JM, Jubrias SA, et al. Altered energetic properties in skeletal muscle of men with well-controlled insulin-dependent (type 1) diabetes. Am J Physiol Endocrinol Metab. 2003;284:E655–62. https://doi. org/10.1152/ajpendo.00343.2002.
25. Kindig CA, Sexton WL, Fedde MR, Poole DC. Skeletal muscle micro-circulatory structure and hemodynamics in diabetes. Respir Physiol. 1998;111:163–75. https://doi.org/10.1016/S0034-5687(97)00122-9. 26. Baldi JC, Cassuto NA, Foxx-Lupo WT, et al. Glycemic status affects
cardiopulmonary exercise response in athletes with type I diabe-tes. Med Sci Sports Exerc. 2010;42:1454–9. https://doi.org/10.1249/ MSS.0b013e3181d1fdb3.
27. Gusso S, Pinto T, Baldi JC, et al. Exercise training improves but does not normalize left ventricular systolic and diastolic function in adolescents with type 1 diabetes. Diabetes Care. 2017. https://doi.org/10.2337/ dc16-2347.