Iran J Public Health, Vol. 46, No.1, Jan 2017, pp.93-102
Original Article
Determination the Levels of Subjective and Observer Rating of
Drowsiness and Their Associations with Facial Dynamic
Changes
Mohsen POURSADEGHIYAN
1, Adel MAZLOUMI
2, *Gebraeil NASL SARAJI
2, Ali
NIKNEZHAD
3, Arash AKBARZADEH
4, Mohammad Hossein EBRAHIMI
51. Research Center in Emergency and Disaster Health, University of Social Welfare and Rehabilitation, Tehran, Iran
2. Dept. of Occupational Health, School of Public Health, International Campus, Tehran University of Medical Sciences, Tehran, Iran 3. Dept. of Mechatronics, Faculty of Engineering, Islamic Azad University South Tehran Branch, Tehran, Iran
4. Dept. of Biostatistics, School of Medicine, Tehran University of Medical Sciences, Tehran, Iran
5. Occupational and Environmental Health Research Center, Shahroud University of Medical Sciences, Shahroud, Iran
*Corresponding Author: Email: [email protected]
(Received 23 Mar 2016; accepted 12 Jul 2016)
Introduction
Detecting drowsiness can aid the reduction of a number of fatal road accidents. Studies have shown that more than 1.3 million and 20 to 50 million people are killed and injured in road acci-dents, respectively (1). Statistics issued by theUS
National Highway Traffic Safe Administration (NHTSA) have indicated that 100000 car crashes happen every year which is only caused by driver sleepiness. Road accidents cost over 12.5 billion Abstract
Background: We determined the levels of subjective and observer drowsiness and facial dynamics changes.
Methods: This experimental study was done in the virtual reality laboratory of Khaje-Nasir Toosi University of Tech-nology in 2015. Facial dynamics changes like changes in eyes, mouth and eyebrows were surveyed on twenty-five driv-ers in 2015byKSS (Karolinska Sleepiness Scale) and ORD (Observer Rating of Drowsiness). ANOVA Repeated Measure and MANOVA Repeated Measure tests were used for data analysis. Also, neural network and Viola-Jones were used to detect facial characteristics. PERCLOS (Percentage of Eye Closure), blink frequency and blink duration were inspected for eyes parameters. The size of open mouth during drowsiness was inspected for mouth parameter. During the inspection of eyebrow, the number 50 denoted eyebrow in normal position. For eyebrows above the nor-mal position, a range of 50 to 55 was specified; in addition, 45-50 was found as the specified range for eyebrows under normal position.
Results: Descriptive statistics of the dynamic changes in mouth and eyes illustrated that during the driving process, the level of sleepiness increased as well as changes of eyes and mouth. However, statistical findings during car driving revealed that dynamic changes in eyebrows had clear expression with a constant trend. Similar studies on data ob-tained from KSS and ORD showed that both of these parameters simultaneously increased as well as the level of drowsiness. In addition, a significant relationship existed between facial expression and drowsiness.
Conclusion: This research would be an effective and efficient tool for timely alarming and detecting the drowsiness quickly and precisely.
which resulted in 1550 mortalities and 71000 in-juries (2).
Car accidents in urban and sub-urban areas are mainly caused by human factors. According to statistics, human error is the main reason for a range of 90 to 95%of car accidents. It is assumed that drivers fatigue causes 25% of accidents and particularly 60% of fatal or injurious road acci-dents (3). In a research conducted by National Highway Traffic Safety Administration (NHTSA) with 107 randomly selected vehicles, the driver drowsiness was the principal reason of 58% of car accidents (4).
In Britain the drivers fatigue is the main cause of20% of the road accidents (5). In recent years, smart systems and the use of wireless sensors have been broadly utilized for monitoring and transferring the vehicle and driver’s situation (WSN). Smart vehicles have improved the quality of driving. This improvement is the result of computer program and software designs for gear, brake system, steering wheel etc. AD hoc net-works were initial systems that developed auto-matic steerage in vehicles delay in responding to the changes in ambient space was the weakness of these systems (6, 7). When the driver is driving the vehicle, time is an important factor for ap-propriate response. Numerous techniques have been developed by famous car manufacturing companies to detect the level of driver’s drowsi-ness particularly during night time. Several weak-nesses and advantages are attributed to these techniques. Techniques developed for announc-ing driver fatigue are categorized in three sets: 1) Mathematical and statistical surveillance sys-tems, 2) Vehicle monitoring syssys-tems, 3) Crew by using sensor networks and 4) Smart systems for driver’s fatigue detection.
In 2009, a system was developed by Hosking and Liu to detect the level of alertness (8).This system detects driver’s fatigue using a facial features-based model. Also, signals as the threshold of sleep were extracted based on EEG waves analy-sis in Barbato et al study (9).Connor et al studied the risk of accidents of large vehicles like tracks caused by drivers’ drowsiness and suggested techniques based on intelligent systems in 2002
(10). Maislinand Dinges introduced intelligent control steering system when the driver is fati-gued which is consistent with new the technology (11). The process of monitoring and immediate surveillance was done by Jo et al to forecast driv-er’s fatigue (12). Bergasa created the immediate surveillance system and smart monitoring in 2006 (13). The blinking rate, as a new method for monitoring and controlling driver’s drowsiness, was suggested by Johns in 2003 (14). He then tested the level of drowsiness by shining infra-red rays and analyzing the reflected rays in 2007(15). Driver’s drowsiness detection techniques have been used in several investigations in order to reduce the road accidents; such systems detect the sleepiness and alertness of the driver by shacking the steering ball or the seat (16).The following parameters were used to detect drowsi-ness:
1) Based on physiological signals (ECG and EEG) (17)
2) Based on of driver performance (number of line crossing and car spacing) (18)
3) Based on facial expression (19).
Physiological methods detect high precision drowsiness, perfectly. However, in these methods some sensors should be set on the body which might be annoying for the user. In methods based on driver performance so much time is required and consequently micro-sleeps are not detected. Researchers mostly used inspection of apparent changes to detect drowsiness (20). The behaviors of drivers are obviously seen in apparent changes of their head and facial expres-sions.
si-multaneously utilized to reduce the weaknesses of the methods. As far as there was no complex and plenary system, the purpose of this research was to employ simultaneously methods on the basis of the changes of eyes, mouth and eyebrows and find the relationship between these parameters with KSS and ORD so as to promote the preci-sion and accuracy of the data collected in the drowsiness detection
Methods
This experimental research was carried out among Twenty-five professional suburban driv-ers in virtual reality lab of Khaje-Nasir Toosi University of Technology in 2015.Inclusion crite-ria were having no eyesight weakness (wearing no glasses), two years of driving experience and normal appearance (with no abnormal beard and mustache). In this regard, eligible subjects were selected randomly.
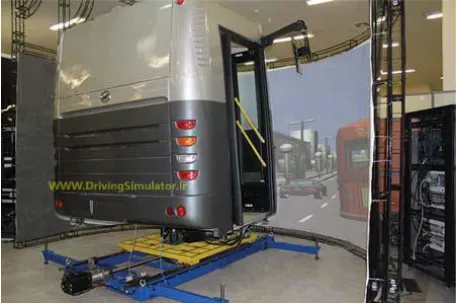
Virtual-reality driving simulator in a temperature and audial controlled quiet room was provided to take photos of the driver. This study was done on driving simulator model AKIA-BI 301 (Fig 1)(25).When drivers began to drive the simulator, some facial photos were taken to find out drow-siness. Before the test, they were asked to drive a vehicle tentatively for some minutes. Then, sub-jects were requested not to take care of unreali-ties of the simulator, and drive based on traffic rules.
Fig. 1: Driving simulator model AKIA-BI 301
A camera was mounted at the start point, to take photos from subjects’ facial features and conti-nuously, KSS appeared on the road every ten minutes. ORD was done by the observer every ten minutes at the same time. The test was con-ducted between9 A.M to 12 A.M in order to control for circadian rhythm (26).Controlled light of vehicles ahead was simulated by bright light shock, which led to the reduction of subjec-tive sleepiness. In order to prevent interruptions during the test, camera and simulator were con-tinuously monitored. Mounting the camera and simulator continuously, prevented the interrup-tions. After all wheels exited the road, the test ended. Then, a software was built for receiving images of eyes, eyebrows and mouth as well as for checking the dynamic changes of facial fea-tures according to the information. Dynamic changes in facial features has been based on eye closure (PERCLOS), eye blink duration and eye blink frequency. By recording deviations from normal situations, eyebrows and mouth were be-ing tracked. After matchbe-ing and synchronizbe-ing, available data from the previous studies were used in rudimentary model from facial dynamic changes.
Viola- Jones algorithm, as a popular quick algo-rithm, was used to detect objects immediately and facial expressions (particularly the area of eyes) as well as to facilitate the detection of drowsiness. Head, in this algorithm, is detected as an area with oval shape by the ratio of its di-ameters with the hole of eyes and the final target is the option with similar color and hue of hu-man (27).
Also, erosion and dilation operators were em-ployed for removing tiny black spots. Finally, the ratio of black pixels related to the whole pixels of upper and lower parts was calculated and used to detect close eyes.
Changes of size of open mouth due to yawning, was the main reason for approximating the open month in the present study. The place of mouth was transferred to Fuzzy C-Means (FCM) unit which is a clustering method in which a part of data is subdivision of two or more clusters. In this phase, calculations pertained to centers of clusters and membership functions in spectral amplitude. A calculation method of the correct number of clusters was required for independent functioning. This target was achieved by using numerous iterations of FCM for a spectrum of hypothesis numbers of clusters along with selec-tion of eligible parts on the basis of validity of cluster. In the next step, this information was transferred to special FCM. In order to remove noise from the image, the special information produced by FCM was used. For specification of a cluster to one-pixel, defuzzification was done after convergence of c-FCM and results revealed an output of FCM in a binary format image that led to mouth detection.
For inspecting the accuracy of mouth detection process, also, two more tests were conducted. The first test was begun from central part of lips and the second test, calculated value of angle be-tween the position of lips and area bebe-tween the eyes. The central area of lips is perpendicular to the area between eyes.
The ratio of area of mouth and degree of open mouth was employed for detecting the size of open mouth in different frames as the formula: 1)DoO=w/h=w/(h×cosϴ)
Where
"w"= breadth of the rectangle (the distance be-tween two corners of lip)
"h"= the height of the rectangle of the lips calcu-lated as the distance between upper and lower lines
Changes in the rectangle open mouth coupled with yawning can be derived through
calcula-tions. As expected, the size of open mouth spe-cifically changed while yawning (28).
During the inspection of eyebrows, the number 50 denoted eyebrow in normal position. A range of 50 to 55 was specified for eyebrow above the normal position and a range of 45 to 50 was for eyebrow below the normal position. So, highest eyebrow is +5 and lowest eyebrow is -5. The output of this section is transferred to another software section for extraction and recognizing the characteristics of detected areas in previous section. These traits were considered as driver's characteristics and were saved in personal files provided by the software. Inspecting recorded frames were done for surveying the level of dy-namic changes of facial features. Finally, data were merged based on the level of drowsiness, KSS and ORD. Due to multivariate analysis of these variables during the time, the requirements for detecting drowsiness and level of sleepiness were provided via a statistical model.
Results
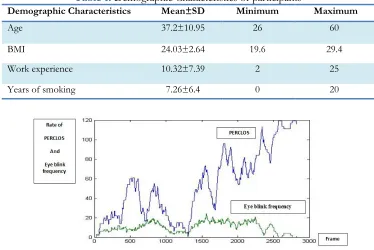
The method was applied on 32 suburban bus drivers aged in a range of 26 to 60 years old that 25 of them got drowsy during the test. As the driving began, photos were taken by a camera placed in front of the driver and ORD was done every ten minutes. Also, data from KSS was si-multaneously obtained every ten minutes. Then, the relation between the information of different parameters was investigated. Demographic cha-racteristics of these drivers presented in Table 1.
Eyes Features during Drowsiness
Table 1: Demographic Characteristics of participants Maximum Minimum Mean±SD Demographic Characteristics 60 26 37.2±10.95 Age 29.4 19.6 24.03±2.64 BMI 25 2 10.32±7.39 Work experience 20 0 7.26±6.4 Years of smoking
Fig.2: Blinking rate and PERCLOS in a part of frame
Having inspected the descriptive statistics of dy-namics of eyes, a considerable increase in eyes drowsiness with increased time was observed. From the rejecting sphericality assumption, Greenhouse-Geisser test was used to validate changes. A considerable change was observed at significance level of 5% of eyes dynamics in time, (F2.74, 65.86=135.26, P<0.001, Partial Eta2=0.849).In other words, it was claimed that a significant ef-fect existed on the time and the level of drowsi-ness had increased in time. Also, the Eta squared coefficient showed that about 85% of total va-riance of this model was determined by this vari-able.
Mouth Features in Drowsiness
According to Figure 4, a significant relationship was indicated between mouth dynamics and pro-gression of time. In addition, based on Green-house-Geisser test, there was a significant change in mouth dynamics in time (F3.47,8.47=89.59, df=2.42, P<0.001, Partial Eta2=0.789).
Fig. 3: changes of eyes dynamics in time
Fig. 4: Dynamic changes of mouth in time
2 4 6 8 10 12
30 40 50 60 70 80 90 Time E ye
1 2 3 4 5 6 7 8 9 10 11 12
30 40 50 60 70 80 90 30 40 50 60 70 80 90
1 2 3 4 5 6 7 8 9 10 11 12
1 2 3 4 5 6 7 8 9 10 11 12
2 4 6 8 10 12
0. 0 0. 1 0. 2 0. 3 0. 4 0. 5 0. 6 0. 7 Time M ou th
1 2 3 4 5 6 7 8 9 10 11 12
0. 0 0. 1 0. 2 0. 3 0. 4 0. 5 0. 6 0. 7
1 2 3 4 5 6 7 8 9 10 11 12
0. 0 0. 1 0. 2 0. 3 0. 4 0. 5 0. 6 0. 7
1 2 3 4 5 6 7 8 9 10 11 12
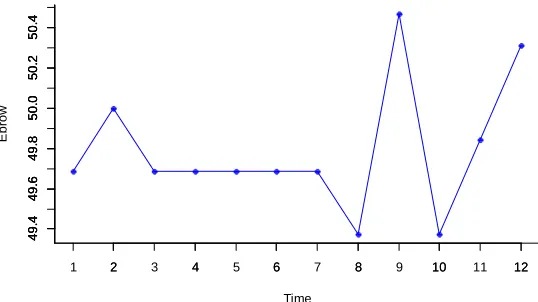
Eyebrow Dynamics during the Drowsiness
Fig. 5 shows the dynamic changes of eyebrows in time. No significant relationship was observed between time progression and dynamic changes of eyebrows, according to the statistical analysis.
Data from KSS and ORD during the Drowsiness
Both KSS and ORD had direct relationship with the level of drowsiness and after 60 minutes an abrupt increase occurred (Fig.6). To survey the relationship between levels of sleepiness, KSS, ORD, MANOVA Repeated Measure were em-ployed. Results indicated that time had significant effect on both KSS and ORD. It is noteworthy these two variables explained 98% of the total
variance. The linear combination of both depen-dent variables over the research periods were sig-nificantly different (F(22,10)=22.52, P<0.001; Wilks’lambda= 0.02; Partial Eta2=0.98). Based on KSS calculations, There was a significant differ-ence between changes of drowsiness in time (F(3.8,90.4) =178.3, P=0.001, Partial Eta2=0.81), as well as for ORD (F(3.8,90.4) =178.3, P = 0.001, Par-tial Eta2=0.79). Pairwise comparisons by bonfer-roni correction were done due to the importance of time. The results of both KSS and ORD indi-cated that many of pairs were significantly differ-ent.
Fig.5: Dynamic changes of eyebrows in time
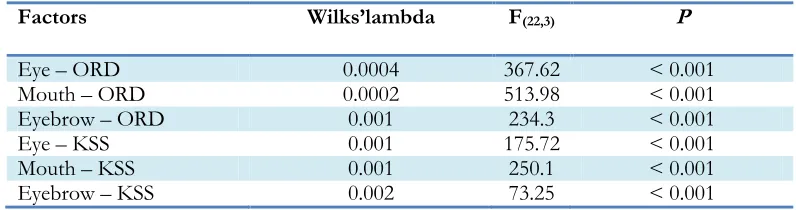
The Relationship between the Results of KSS and ORD and Dynamics of Eyes, Mouth and Eyebrows
MANOVA Repeated Measure, KSS and ORD were used so as to find if any relationship be-tween dynamic changes of eyes, mouth and eye-brows during driving, and changes in the level of drowsiness. Findings showed that time variable
had a significant impression on the dynamic va-riables of facial expressions (eyes and mouth) as well as KSS. Over 99% of the changes of va-riance allocated to these variables. In this regard, there were significant relationships between dy-namic changes of facial features and ORD; also, between linear combination of both dependent variables in 12 periods of the research (Table 2).
Fig. 6: Changes of ORD and KSS in time
2 4 6 8 10 12
4 9 .4 4 9 .6 4 9 .8 5 0 .0 5 0 .2 5 0 .4 Time E b ro w 4 9 .4 4 9 .6 4 9 .8 5 0 .0 5 0 .2 5 0 .4
1 2 3 4 5 6 7 8 9 10 11 12
4 9 .4 4 9 .6 4 9 .8 5 0 .0 5 0 .2 5 0 .4
2 4 6 8 10 12
20 40 60 80 Time O R D 20 30 40 50 60 70 80 90
1 2 3 4 5 6 7 8 9 10 11 12
2 4 6 8 10 12
2 3 4 5 6 7 8 9 Time KSS
1 2 3 4 5 6 7 8 9 10 11 12
2 3 4 5 6 7 8 9 2 3 4 5 6 7 8 9
Table 2: Data related to KSS, ORD and their relationship with dynamics of eyes, mouth and eyebrow
Factors Wilks’lambda F(22,3) P
Eye – ORD 0.0004 367.62 < 0.001
Mouth – ORD 0.0002 513.98 < 0.001
Eyebrow – ORD 0.001 234.3 < 0.001
Eye – KSS 0.001 175.72 < 0.001
Mouth – KSS 0.001 250.1 < 0.001
Eyebrow – KSS 0.002 73.25 < 0.001
Discussion
Driver’s drowsiness causes changes in the eyes and facial features and many techniques and algo-rithms have been developed in order to recognize facial features that detect sleepiness (19). Lopar and Ribarichave shown how quick and accurate Violla- Jones algorithm as a tool was in tracking facial features (20). In this research, image processing based on Violla- Jones algorithm was employed to recognize facial features, detect driver fatigue and determine level of driver alert-ness. Also, KSS, ORD and parameters of dynam-ic changes of eyes, mouth and eyebrow were uti-lized in order to improve the accuracy of recogni-tions. Belz et al’s study by employing KSS and ORD found a significant relationship between the levels of drowsiness (29). Results of multiple variable tests indicated the impressive effect of time on KSS and ORD. Both of the mentioned variables provided 98% of the changes in va-riance.
Eyes dynamic changes can be considered as a key parameter for fatigue detection and numerous inspections have been done on it. Dynamic changes of eyes had a direct relationship with the level of sleepiness, according to gradient of graphs (30). Kumar and Barwin employed a new method by the use of eyes dynamics, blinking rate and Viola-Jones simultaneously (31).This method could detect 92% of driver’s drowsiness and specified the driver. A direct relationship was observed between the level of drowsiness and eyes dynamics. A level of 5% error in eyes dy-namic implied that there was a significant change
in time. GROUP INTERACTION test was uti-lized to provide an appropriate model; linear model provided 89% of the changes of variance. However, dual comparisons test showed that ma-jority of dual differences at the level of 5% with BONFRONI correction were significant.
Ingre et al conducted an inspection on the rela-tionship between eyes dynamic changes and KSS test. They used the information obtained in five-min intervals and concluded that a direct relation had existed between both components (32).In other study, a correlation was found between ORD and dynamic changes of eyes (33) which was in line with our results. Therefore, the accu-racy of the results of dynamic changes of eyes in fatigue detection was confirmed.
Mouth dynamic changes are also a target for drowsiness detection inspections. A similar study (34) detected the lips and the size of open mouth for sleepiness recognition using s-FCM cluster-ing. Determination of frequency of yawning could be another way to identify driver drowsi-ness (28, 35). Therefore, significant correlation was observed between dynamic changes of mouth and time progression. Descriptive statis-tics of the dynamic changes of mouth in time showed that after abrupt increase in 60th min, there was an increase in yawning frequency rather than previous periods.
in the test. Forehead wrinkles were paid attention as signals of drowsiness in other studies (36). Be-cause, while driver feels sleepy, she/he puts eye-brows above the normal position and keeps her/his eyes open. This change was considered as a forecast result of their study. At a 95% confi-dence interval, the results of Greenhouse-Geisser
test showed no significant difference between eyebrows dynamics during driving, against of pi-lot study (37). But, based on KSS and ORD cor-relation whit eyebrow, a significant cor-relationship was observed between dynamic changes of eye-brow and the trend of drowsiness, this result as the same of pilot study (37).
The target of this study was to build a hybrid fa-cial drowsiness detecting model. This research had power points and weaknesses. One advan-tage in the use of this technique was that it rec-ognized intelligent sleepiness by analyzing various criteria, long time intervals and drive’s back-ground to detect sleepiness. It helps to detect driver drowsiness in real time and to give essen-tial announcements and decrease car accidents. Precision of this method relied on enough illumi-nation and appropriate place of camera. This me-thod also processed the real time with high accu-racy in comparison with other methods. Another weak point was that we could not be sure about driver’s sleep, because some of drivers were going to have fake sleeps and finished their tests earlier than others and they could not change their positions too much and also, detection of driver’s eyes in bright light was not possible.
Conclusion
KSS and ORD analysis proved the dynamic changes in eyes and mouth parameters while driver was sleepy. This method could be an effec-tive and efficient tool for quickly and precisely drowsiness detections.
Ethical considerations
The approval of Tehran University of Medical Sciences was obtained for conducting the study. All participants were presented about the
objec-tives of the study, and their informed consent was obtained.
Acknowledgements
This research was supported by the International Campus (TUMS-IC) of Tehran University of Medical Sciences (Tehran, Iran) with grant spon-sor ship number 24957. All of authors contri-buted to this project and article equally. The au-thors declare that there is no conflict of interests.
References
1. WHO (2009). Global Status Report on Road Safety Geneva, Switzerland.
http://www.who.int/violence_injury_prev
en-tion/road_safety_status/report/cover_an d_front_matter_en.pdf.
2. Rau P (2005).Drowsy Driver Detection and Warning System for Commercial Vehicle Drivers, Field Operational Test Design, Analysis, and Progress. National Highway Traffic Safety Administration Washington, DC, USA. Paper Number 05-0192.
3. Bergasa LM, Nuevo Ju, Sotelo MA, Barea R, Lopez E (2008).Visual monitoring of driv-er in attention. In: Studies in Computational Intelligence. Eds. Springer, pp.19-37.
4. Knipling RR, Wang, JS (1994).Crashes and fatalities related to driver drowsi-ness/fatigue. US Department of Transpor-tation, National Highway Traffic Safety Administration, Office of Crash Avoid-ance Research, Research & Development. www.ntl.bts.gov/lib/jpodocs/repts_te/10 04.pdf .
5. Anonymous (2000)."Tomorrow’s Roads": Sa-fer for Everyone, Department of the En-vironment, Transport and the Regions: London.
www.ocs.polito.it/biblioteca/mobilita/To morrowRoads1.pdf.
7. Manvi SS, Kakkasageri MS, Pitt J (2009). Multiagent based information dissemina-tion in vehicular ad hoc networks. Mobile Inform Sys, 5 )4(:363-89.
8. Liu CC, Hosking SG, Lenné MG (2009). Predicting driver drowsiness using vehicle measures:Recent insights and future chal-lenges. J Safety Res, 40 (4): 239-45.
9. Barbato G, Ficca G, Beatrice M, Casiello M, Muscettola G, Rinaldi F (1995). Effects of sleep deprivation on spontaneous eye blink rate and alpha EEG power. Biol Psy-chiatry, 38 (5): 340-1.
10. Conner J, Norton R, Ameratunga S, Robin-son E, Civil I, Dunn R, Bailey j, JackRobin-son R (2002). Driver sleepiness and risk of se-rious injury to car occupants: population based case control study. BMJ, 324 (7346): p.1125.
11. Dinges D, Maislin G, Brewster R M, Krueger G P, Carroll RJ (2005). Pilot test fatigue management technologies. Transp Res Board , 1922:175-182.
12. Ji Q, Zhu Z, Lan P. (2004).Real-time nonin-trusive monitoring and prediction of driv-er fatigue. IEEE Trans veh technol, 53(4): 1052-68.
13. Bergasa LM, Nuevo J, Sotelo MA, Barea R, Lopez ME (2006). Real-Time system for monitoring driver vigilance. IEEE T Intell Transp, 7 (1): 63-77.
14. Johns MW (2003).The Amplitude velocity Ratio of Blinks: A new method for moni-toring drowsiness. Paper presented at the 7th Annual Conference, Associated Professional Sleep Societies.
15. Johns MW, Tucker A, Chapman R, Crowley K, Michael N (2007). Monitoring eye and eyelid movement by infrared reflectance oculography to measure drowsiness in driver. Somnologie, 11 (4): 234-42.
16. Dai Y, Nakano Y (1996). Face-Texture Mod-el Based on SGLD and Its Application in Face Detection in a Color Scene. Pattern Recogn, 29 (6):1007-17.
17. Ying Y, Jing S, Wei Z (2007). The Monitoring Method of Driver’s Fatigue Based on Neural Network. Proc. International Conf. on Mechatronics and Automation, Chi-na.pp.3555-9.
18. Sahayadhas A, Sundaraj K, Murugappan M (2012). Detecting driver drowsiness based on sensors: a review. Sensors,12(12): 16937-16953.
19. Saradadevi M, Bajaj P (2008).Driver Fatigue Detection Using Mouth and Yawning Analysis. IJCSNS, 8(6):183-8.
20. Lopar M, and Ribarić S (2013). An Overview and Evaluation of Various Face and Eyes Detection Algorithms for Driver Fatigue Monitoring Systems. Proceedings of the Croatian Computer Vision Workshop, Year 1. Zagreb, Coroatia, pp.15-18. https://arxiv.org/ftp/arxiv/papers/1310/ 1310.0317.pdf.
21. Ji Q, Yang X (2002).Real-Time Eye, Gaze, and Face Pose Tracking for Monitoring Driver Vigilance. Real-Time Imaging, 8 (5): 357-77.
22. Yang G, Huang T S (1994). Human Face De-tection in Complex Background. Pattern Recogn, 27 (1): 53-63.
23. Otmani S, Pebayle T, Roge J, Muzet A (2005).Effect of driving duration and par-tial sleep deprivation on subsequent alert-ness and performance of car drivers. Phy-siol Behav, 84 (5): 715–24.
24. McDonald AD, Schwarz C, Lee JD, Brown TL (2012). Real-Time Detection of Drow-siness Related Lane Departures Using Steering Wheel Angle. Proc Hum Factors Er-gon Soc Annu Meet.56(1) 2201- 2205. 25. Drivingsimulator.ir (Internet). Tehran: driving
Simulator of Khaje Nasir, Inc; ( Updated
2013 may 16)
http://www.drivingsimulator.ir/services-content/news.html
26. Craig A, Tran Y, Wijesuriya N, Boord PA (2006). A Controlled Investigation in to the Psychological Determinants of Fati-gue. Biol Psychol, 72 (1): 78-87.
27. Viola P(2004).Robust real-time face detec-tion. Int Jcomput vision, 57(2):137–54. 28. Azim T, Jaffar MA , Mirza AM (2009).
29. Belz Steven M, Robinson Gary S, Casali John G (2004). Temporal Separation and Self-Rating of Alertness as Indicators of Driver Fatigue in Commercial Motor Vehicle Op-erators. Human Factors, 46(1):154-69. 30. Timm F, Barth E (2011).Accurate eye Centre
localization by means of gradients. Proc of the Sixth International Conference on Computer Vision Theory and Applica-tions, Vilamoura, Algarve, Portugal. www.inb.uniluebeck.de/fileadmin/files/P UBPDFS/TiBa11b.pdf .
31. Kumar N, Barwar NC (2014).Analysis of Real Time Driver Fatigue Detection Based on Eye and Yawning. IJCSNS,5 (6): 7821-7826.
32. Ingre M, ÅKerstedt T, Peters B, Anund, A, Kecklund G (2006).Subjective sleepiness simulated driving performance and blink duration: Examining individual differenc-es. J. Sleep Res. 15(1): 47–53.
33. Xuanpeng L, Seignez E, Loonis P (2013).Driver drowsiness estimation by fu-sion of lane and eye features using a multi-level evidence theory. IEEE International Conference on Cyber Technology in Automation,
Control and Intelligent Systems. DOI: 10.1109/CYBER.2013.6705481.
34. Karchani M, Mazloumi A, Saraji GN, Ghara-gozlou F, Nahvi A, Sadeghniiat Haghighi Kh, Makki Abadi B, Rahimi Foroshani A (2015). Presenting a model for dynamic facial expression changes in detecting drivers’ drowsiness. Electron Physician, 7(2): 1073-77.
35. Reddy K, Sikandar A, Savant P, Choudhary A (2014).Driver Drowsiness Monitoring Based On Eye Map and Mouth Contour. IJSTR, 3(5): 147- 156.
36. Vural E, Cetin M, Ercil A, Littlewort G, Bar-tlett M, Movellan J (2007).Drowsy Driver Detection through Facial Movement Analysis.Human-Computer Interaction, IEEE International Workshop, HCI, Rio de Ja-neiro, Brazil. Volume 4796 of the series Lecture Notes in Computer Science. pp 6-18.