Iran J Public Health, Vol. 45, No.11, Nov 2016, pp.1420-1426
Original Article
Association of SIRT6 Gene Polymorphisms with Human
Longevity
You LI, Jian QIN, Xiao WEI, Guiyun LIANG, Liwei SHI, Meiyu JIANG, Tianlong XIA,
Xue LIANG, *Min HE, *Zhiyong ZHANG
Dept. of Occupational and Environmental Health, School of Public Health, Guangxi Medical University, Nanning 530021, Guangxi, China
*Corresponding Authors: Email: [email protected], [email protected]
(Received 04 Dec 2015; accepted 20 Apr 2016)
Introduction
Longevity and ageing are a complex and multifac-torial process controlled by both environmental and genetic factors (1). Studies reported hundreds of genetic variants that played a role in extension of lifespan. Population studies of longevity in twins suggested that the genes contributed to 15% to 30% of the heritability to the human li-fespan (2, 3). However, the mechanisms underly-ing the role of genetic factors in human longevity and successful ageing are unknown. Over the last decade, sirtuins attracted significant interests in
died in NAD-dependent lysine deacetylation and a related mono-ADP-ribosylation reaction (4). The histone deacetylase silent information regula-tor (Sir2) is a longevity control gene (5, 6). Sir2 activity depends on the levels of nicotinamide adenine dinucleotide (NAD) (7). Further, Sir2 increases longevity by suppressing ribosomal DNA homologous recombination and calorie restriction (6).
Mammalian genomes encode seven Sir2 homo-logs (SIRT1-7). The human SIRT6 gene is located Abstract
Background: We aimed to identify the role of SIRT6 gene polymorphism rs350846 in human longevity.
Methods: SIRT6 C/G genotypes were determined using Taqman SNP Genotyping Assays in 169 long-lived inhabi-tants (LG group aged 90-110 yr), 158 healthy internal controls (internal control group; aged 26-82 yr) and 176 healthy external controls (external control group; aged 20-82 yr) without a family history of exceptional longevity. Statistical analysis was conducted using SPSS 16.0.
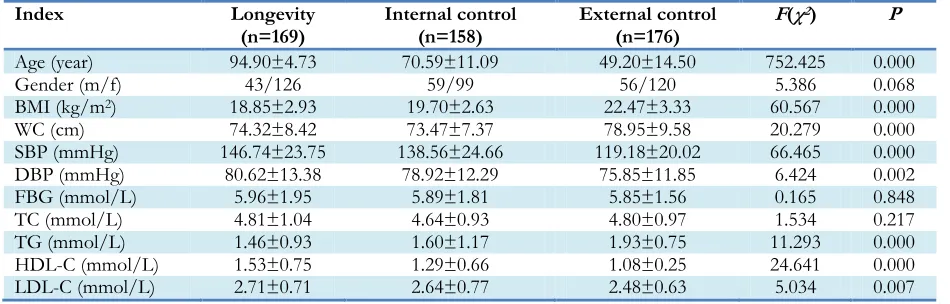
Results: BMI and TG level were lower in the longevity than in the two control groups, while serum LDL-c and HDL-c and SBP and DBP levels in long-lived individuals were higher than in the two HDL-control groups (P<0.01). The waist circumference was obviously different (P=0.001) among the three groups, with the maximum observed in the external group. No statistically significant differences of the gender FBG and TC were seen in long-lived individuals than in the two control groups. Significant genotype differences existed among the different groups except for the longevity and internal control group. The frequency of the minor allele-C was 0.319. The minor allele frequency of rs350846 in SIRT6 was much higher in the external control than in the other groups. BMI, SBP and HDL-c displayed significant effect on longevity.
Conclusion:The C allele of rs350846 in SIRT6 gene, CC and CG genotypes as well as BMI, systolic pressure and HDL-c are associated with longevity. Further studies are needed to validate our results.
encodes a 355-amino-acid protein (8). It regulates the expression of several stress-responsive and metabolism related genes at the molecular level (9, 10). In addition, it plays an important biologi-cal role in heart disease, diabetes, obesity, in-flammation and cancer. Therefore, SIRT6 activity is crucial in many chronic diseases and healthy longevity (11). SIRT6 knockout mice manifested kyphosis, cachexia, greying of fur, decreased bone mineral density, reduced weight and subcu-taneous fat, hypoglycemia, and chronic inflam-mation. Their lifespan was reduced to about one month (12). SIRT6 plays an important role in maintaining normal retinal function and its defi-ciency causes major chromatin changes in the retina of mice (13). SIRT6 is a critical regulator of endothelial senescence. Oxidative stress-induced down regulation of SIRT6 probably mediates the pathogenesis of diabetic retinopathy (14).
However, SIRT6 overexpression extended the lifespan of male mice by 15%, related to decrease in serum insulin-like growth factor (IGF-1s) and increase in IGF-binding protein 1 (15). Transgen-ic mTransgen-ice overexpressing SIRT6 are protected from metabolic disorders associated with triglyceride and accumulation of serum cholesterol and de-creased glucose tolerance (16). Therefore, SIRT6 not only extends lifespan but also improves health quality, which is a major anti-ageing break-through (17). Ageing is a normal process in any living mammal. SIRT6 is related to longevity and ageing in animal studies, with no reported con-nection between human SIRT6 and longevity. The populations of Bama County located in the Hongshuihe River Basin, Guangxi Province, have prolonged lifespan (18, 19). Populations in Hongshuihe River Basin represent the typical groups for studying longevity in Guangxi, China (20, 21). Although studies investigated the rela-tionships between longevity, environmental and genetic factors, the specific mechanisms are still not clear.
In this study, we studied the rs350846 polymor-phism of SIRT6 in the longevity group and the controls in an effort to unravel the genetic basis of longevity.
Methods
Study population
Longevity was defined as survival to age 90 yr or more. Based on the sixth national population census of China in 2010, we selected the Bama County as the sample site, in which there was a higher proportion of the longevous people than other counties. There total of 169 unrelated long-living individuals who satisfied the conditions (43 males and 126 females aged 90-110 yr, the mean ages 94.90 ± 4.73) were randomly selected as longevity group, and 158 unrelated participants (59 males and 99 females aged 26-82 yr, the mean ages 70.59 ± 11.09) from Bama also were enrolled as the internal control group (environ-mentally matched). The external control group consisted of 176 subjects (56 males and 120 fe-males aged 20-82 yr, the mean ages 49.20 ± 14.50) from Nandan County, which is approx-imately 160 km away from Bama County (envi-ronmentally unmatched). No long-lived individu-als existed in both internal and external control groups. Long-lived individuals aware selected based on at least two sibling meetings according to the following inclusion criteria: 1) age 90 or above; 2) subjects with one or more living broth-er or sistbroth-er who satisfied the first critbroth-erion. Age of the participants was authenticated officially through a certificate of identification or house-hold register and the accounts of their offspring and other socio-demographic events. All of the participants were essentially healthy with no ob-vious disease or chronic illness. The study was approved by the ethics committee of Guangxi Medical University. Written informed consents were obtained from all participants. The study complied with the tenets of the Declaration of Helsinki.
serum total triglyceride (TG), serum total choles-terol (TC), HDL-cholescholes-terol (HDL-c) and LDL-cholesterol (LDL-c) in serum samples were
de-termined by standard enzymatic methods using commercially available kits. The demographic characteristics show in Table 1.
Table 1:The general characteristics between the longevity and two control groups
Index Longevity
(n=169) Internal control (n=158) External control (n=176) F(χ
2) P
Age (year) 94.90±4.73 70.59±11.09 49.20±14.50 752.425 0.000
Gender (m/f) 43/126 59/99 56/120 5.386 0.068
BMI (kg/m2) 18.85±2.93 19.70±2.63 22.47±3.33 60.567 0.000
WC (cm) 74.32±8.42 73.47±7.37 78.95±9.58 20.279 0.000
SBP (mmHg) 146.74±23.75 138.56±24.66 119.18±20.02 66.465 0.000
DBP (mmHg) 80.62±13.38 78.92±12.29 75.85±11.85 6.424 0.002
FBG (mmol/L) 5.96±1.95 5.89±1.81 5.85±1.56 0.165 0.848
TC (mmol/L) 4.81±1.04 4.64±0.93 4.80±0.97 1.534 0.217
TG (mmol/L) 1.46±0.93 1.60±1.17 1.93±0.75 11.293 0.000
HDL-C (mmol/L) 1.53±0.75 1.29±0.66 1.08±0.25 24.641 0.000
LDL-C (mmol/L) 2.71±0.71 2.64±0.77 2.48±0.63 5.034 0.007
Note: Values are given as means±SD. BMI=body mass index, WC=waist circumference,
SBP=systolic blood pressure, DBP=diastolic blood pressure, FBG=fasting blood glucose, TG=serum total triglyceride, TC=serum total cholesterol, HDL-c=high-density lipoprotein cholesterol, LDL-c =low-density lipoprotein cholesterol.
Genotyping
Venous blood with ethylenediamine tetraacetic acid (EDTA) anticoagulant was used to extract genomic DNA by the Chelex-100 Method (22). SNPs were selected based on their minor allele frequencies reported in the HapMap or SNP da-tabase (http://www.ims.u-tokyo.ac.jp). TaqMan (Applied Biosystems) reagents were purchased from ABI. SNPs were selected with a frequency >0.1 in the Chinese population.
PCR was performed in a volume of 10μl contain-ing 1μl of genomic DNA, 0.25μl of Assay-on-Demand SNP Genotyping Assay Mix (40×) (Ap-plied Biosystems Co., Ltd. US), 3.75μl ddH2O and 5μl TaqMan Universal PCR Master Mix, No AmpErase UNG (2×). The PCR cycle profile was as follow: predenaturation at 95 °C for 10 min, followed by 43 cycles of denaturation at 92 °C for 15 sec, annealing at 60 °C for 1 min, with fluorescence acquisition during each stage of an-nealing and extension. SIRT6 genes were geno-typed with VIC and FAM as fluorescent tags us-ing the Applied Biosystems 7300 Real - Time PCR System.
Statistical analysis
Statistical analyses were conducted using SPSS 16.0 (Chicago, IL, USA). ANOVA (analysis of variance) was used to compare continuous va-riables (BMI, SBP, DBP, FBG, TC, TG, HDL-c and LDL-c) and Chi-square test was used for ca-tegorical variables. We used the Pearson's chi-square test to evaluate the Hardy–Weinberg equi-librium (HWE). The frequency of the rs350846 SIRT6 gene polymorphisms in the three groups was assessed. P-values were corrected for mul-tiple comparison by Bonferroni analysis (P=0.05/number of comparisons), yielding a new P-value (P<0.017, number of comparisons =3). To estimate the strength of longevity association, the P-value and the odds ratios with 95% confi-dence interval were estimated using multinomial logistic regression models. Statistical significance was set at P<0.05.
Results
Population profile
and DBP in long-lived individuals were higher than in the two control groups (P<0.01). The waist circumference was different (P=0.000) among the three groups and the maximum waist circumference was observed in the external group. No statistically significant differences in gender, FBG and TC levels were noticed in long-lived individuals.
Hardy Weinberg equilibrium test of different groups
Chi-square test revealed that all genotypes were within the limits of the Hardy-Weinberg law us-ing HWE software (P>0.05) (Table 2).
Genotypic frequency
GG was the dominant genotype in longevity and internal control groups with a frequency of 0.53 and 0.54, respectively. However, CG was the dominant genotype in the external control group with a frequency of 0.5. Statistically significant differences were observed among the different genotypes except for the longevity and internal control groups (Table 3).
Minor allele frequency, MAF
The frequency of the minor allele-C was 0.319. The minor allele frequency of rs350846 in SIRT6 was significantly higher in the external control group than in other groups (Table 4).
Table 2:Chi-square test of Hardy-Weinberg equilibrium of rs350846 in SIRT6 genes
Group n Genotype χ2 P
CC CG GG
Longevity 169 17 63 89 1.3418 0.5112
Internal control 158 13 59 86 0.4025 0.8177
External control 176 24 88 64 0.5221 0.7702
Total 503 54 210 239 0.5949 0.7427
Table 3: Genotype frequency of the SIRT6 polymorphism n (%)
Group n Genotype n (%) χ2 P
CC CG GG
Longevity 169 17(10.06) 63(37.28) 89(52.66) 0.346a 0.841
Internal control 158 13(8.23) 59(37.34) 86(54.43) 11.281b 0.004
External control 176 24(13.64) 88(50.00) 64(36.36) 9.281c 0.010
Total 503 54(10.74) 210(41.75) 239(47.51) 13.930d 0.008
Note: a represents longevity vs. internal control, b denotes internal control vs. external control, c suggests longevity vs. external control, P<0.017 indicates statistical significance, d means total χ2 value.
Table 4:Distribution of alleles and MAF in rs350846 of SIRT6 gene
Group C G MAF χ2 P OR 95%CI
n (%) n (%)
Longevity 97(28.7) 241(71.3) 0.287 0.067 0.796a 1.046 0.742~1.476
Internal control 85(27.8) 221(72.2) 0.278 8.653 0.003b 0.611 0.439~0.849
External control 136(38.6) 216(61.4) 0.386 7.615 0.006c 0.639 0.465~0.879
Total 318(31.9) 678(68.1) 0.319 11.336 0.003d
Note: a denotes longevity vs. internal control; b represents internal control vs. external control; c represents lon-gevity vs. external control; P<0.017 suggests statistical significance; Data in italics indicates P<0.05, OR = odds ratio, 95%CI= 95% confidence interval; d indicates total χ2 value.
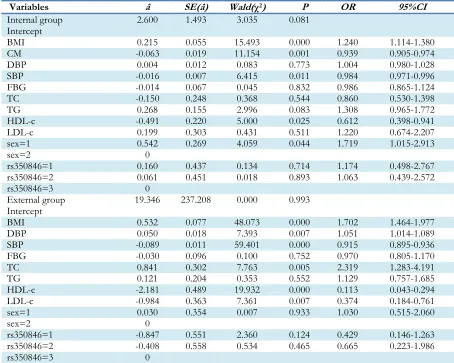
BMI, CM, DBP, SBP, GLU, TC, TG, HDL-c, LDL-c, sex and rs350846 genotype were included in the logistic model. Among these variables, five factors significantly influenced longevity, includ-ing BMI (OR: 1.240; 95%CI: 1.114-1.380), CM (OR: 0.939; 95%CI: 0.905-0.974), SBP (OR: 0.984; 95%CI: 0.971-0.996), HDL-c (OR: 0.612; 95%CI: 0.398-0.941) and sex (OR: 1.719; 95%CI: 1.015-2.913) between the longevity and the
inter-nal control groups. Among these variables, six factors significantly influenced longevity, includ-ing BMI (OR: 1.702; 95%CI: 1.464-1.977), SBP (OR: 0.915; 95%CI: 0.895-0.936), DBP (OR: 1.051; 95%CI:1.014-1.089) , TC (OR: 2.319; 95%CI: 1.283-4.191) , HDL-c (OR: 0.113; 95%CI: 0.043-0.294), and LDL-c (OR: 0.374; 95%CI: 0.184-0.761) between the longevity and the external control groups (Table 5).
Table 5:Multinomial logistic regression analysis of longevity and two control groups
Variables â SE(â) Wald(χ2) P OR 95%CI
Internal group
Intercept 2.600 1.493 3.035 0.081
BMI 0.215 0.055 15.493 0.000 1.240 1.114-1.380
CM -0.063 0.019 11.154 0.001 0.939 0.905-0.974
DBP 0.004 0.012 0.083 0.773 1.004 0.980-1.028
SBP -0.016 0.007 6.415 0.011 0.984 0.971-0.996
FBG -0.014 0.067 0.045 0.832 0.986 0.865-1.124
TC -0.150 0.248 0.368 0.544 0.860 0.530-1.398
TG 0.268 0.155 2.996 0.083 1.308 0.965-1.772
HDL-c -0.491 0.220 5.000 0.025 0.612 0.398-0.941
LDL-c 0.199 0.303 0.431 0.511 1.220 0.674-2.207
sex=1 0.542 0.269 4.059 0.044 1.719 1.015-2.913
sex=2 0
rs350846=1 0.160 0.437 0.134 0.714 1.174 0.498-2.767
rs350846=2 0.061 0.451 0.018 0.893 1.063 0.439-2.572
rs350846=3 0
External group
Intercept 19.346 237.208 0.000 0.993
BMI 0.532 0.077 48.073 0.000 1.702 1.464-1.977
DBP 0.050 0.018 7.393 0.007 1.051 1.014-1.089
SBP -0.089 0.011 59.401 0.000 0.915 0.895-0.936
FBG -0.030 0.096 0.100 0.752 0.970 0.805-1.170
TC 0.841 0.302 7.763 0.005 2.319 1.283-4.191
TG 0.121 0.204 0.353 0.552 1.129 0.757-1.685
HDL-c -2.181 0.489 19.932 0.000 0.113 0.043-0.294
LDL-c -0.984 0.363 7.361 0.007 0.374 0.184-0.761
sex=1 0.030 0.354 0.007 0.933 1.030 0.515-2.060
sex=2 0
rs350846=1 -0.847 0.551 2.360 0.124 0.429 0.146-1.263
rs350846=2 -0.408 0.558 0.534 0.465 0.665 0.223-1.986
rs350846=3 0
Note: Reference was defined as sex= 1, and 2 for male and female; rs350846= 1, 2 and 3 denote GG, CG and CC genotypes, respectively
Discussion
Our data suggest that the basic characteristics of the populations including age, BMI, TG, SBP, DBP, HDL-C, and LDL-C were significantly
was associated with higher levels of SBP, DBP, HDL-c and LDL-c than in the two control groups. All these signs were related to nutrition and lifestyle factors. Although, other investiga-tions (24) showed several changes in diet and life-style in Hongshuihe River Basin including in-creased intake of fats, proteins, and carbohy-drates and additional alcoholic beverages than before. Longevity is mainly associated with easily digestible plant-based foods such as whole grains or corn with less fat and animal protein, and in-take of multiple small meals. Caloric restriction can prolong life (25, 26).
In the present study, the genotypes in Table 3 were significantly different among the external control and the other two groups. The GG was the predominant genotype in both the longevity group and the internal control group compared with the CG type in the external control group. The C allele may promote longevity according to the MAF results. We found no significant gender differences in the final model, in contrast to oth-er longevity studies (27). BMI, SBP and soth-erum TG levels represented the risk or protective fac-tors for longevity. No SIRT6 rs350846 genotypes were associated with longevity, although previous studies reported that SIRT6 was associated with aging (17). The main studies focused on the so-matic cells and mice demonstrating that SIRT6 prolonged the life of male mice (15). Cell senes-cence may be associated with NF-kB signaling pathways (28).
No studies are available correlating SIRT6 and human longevity. Our findings suggest that the SIRT6 rs350846 gene polymorphism was not as-sociated with longevity, due to relative stability in the population and limited sample size. Therefore, the association of SIRT6 rs350846 polymorphism with longevity needs to be confirmed with larger sample sizes and other polymorphisms.
Conclusion
The C allele of rs350846 in SIRT6 gene, CC and CG genotypes are associated with longevity, with BMI, systolic pressure and HDL-c may be
impor-tant factors representing key factors in the long-lived populations of Bama County.
Ethical considerations
Ethical issues (Including plagiarism, informed consent, misconduct, data fabrication and/or fal-sification, double publication and/or submission, redundancy, etc.) have been completely observed by the authors.
Acknowledgments
This work was supported by the National Natural Science Foundation of China grant award to Dr Zh. Zhang (NSFC-81260423, NSFC- 61161009). The authors declare that there is no conflict of interest.
References
1. Witten TM, Bonchev D (2007). Predicting ag-ing/longevity-related genes in the nematode Caenorhabditis elegans. Chem Biodivers, 4(11): 2639-55.
2. Herskind AM, McGue M, Holm NV, et al (1996). The heritability of human longevity: a population-based study of 2872 Danish twin pairs born 1870-1900. Hum Genet, 97(3): 319-23.
3. Iachine IA, Holm NV, Harris JR, et al (1998). How heritable is individual susceptibility to death? The results of an analysis of survival data on Danish, Swedish and Finnish twins.
Twin Res, 1(4): 196-205.
4. Liszt G, Ford E, Kurtev M, et al (2005). Mouse Sir2 homolog SIRT6 is a nuclear ADP-ribosyltransferase. J Biol Chem, 280(22): 21313-20.
5. Tissenbaum HA, Guarente L (2001). Increased dosage of a sir-2 gene extends lifespan in Caenorhabditis elegans. Nature, 410(6825): 227-30.
7. Imai S, Armstrong CM, Kaeberlein M, et al (2000). Transcriptional silencing and longevity protein Sir2 is an NAD-dependent histone deacetylase. Nature, 403(6771): 795-800. 8. Mahlknecht U, Ho AD, Voelter-Mahlknecht S
(2006). Chromosomal organization and fluo-rescence in situ hybridization of the human Sirtuin 6 gene. Int J Oncol, 28(2): 447-56. 9. Zhong L, D'Urso A, Toiber D, et al (2010). The
histone deacetylase Sirt6 regulates glucose homeostasis via Hif1alpha. Cell, 140(2): 280-93.
10. Kawahara TL, Rapicavoli NA, Wu AR, et al (2011). Dynamic chromatin localization of Sirt6 shapes stress- and aging-related tran-scriptional networks. PLoS Genet, 7(6): e1002153.
11. Kugel S, Mostoslavsky R (2014). Chromatin and beyond: the multitasking roles for SIRT6.
Trends Biochem Sci, 39(2): 72-81.
12. Lombard DB, Schwer B, Alt FW, et al (2008). SIRT6 in DNA repair, metabolism and age-ing. J Intern Med, 263(2): 128-41.
13. Silberman DM, Ross K, Sande PH, et al (2014). SIRT6 is required for normal retinal function.
PloS One, 9(6): e98831.
14. Liu R, Liu H, Ha Y, et al (2014). Oxidative stress induces endothelial cell senescence via down-regulation of Sirt6. Biomed Res Int, 2014: 902842.
15. Kanfi Y, Naiman S, Amir G, et al (2012). The sirtuin SIRT6 regulates lifespan in male mice.
Nature, 483(7388): 218-21.
16. Kanfi Y, Peshti V, Gil R, et al (2010). SIRT6 pro-tects against pathological damage caused by diet-induced obesity. Aging cell, 9(2): 162-73. 17. Gertler AA, Cohen HY (2013). SIRT6, a protein
with many faces. Biogerontology, 14(6): 629-39. 18. Yang J (1992). An analysis of the longevous
population in Bama. Chin J Popul Sci, 4(4): 351-56.
19. Xiao Z, Xu Q, Yuan Y (1996). Solving the mys-tery of the status and longevity of centena-rians in Bama. Chin J Popul Sci, 8(4): 385-94.
20. Yang X, Wang X, Yao H, et al (2012). Mito-chondrial DNA polymorphisms are asso-ciated with the longevity in the Guangxi Ba-ma population of China. Mol Biol Rep, 39(9): 9123-31.
21. Pan SL, Wang F, Lu ZP, et al (2012). Cholesteryl ester transfer protein TaqIB polymorphism and its association with serum lipid levels and longevity in Chinese Bama Zhuang popula-tion. Lipids Health Dis, 11: 26.
22. Mari D, Mannucci PM, Duca F, et al (1996). Mu-tant factor V (Arg506Gln) in healthy centena-rians. Lancet, 347(9007): 1044.
23. Feng J, Zhang J, Liu M, et al (2011). Association of mtDNA haplogroup F with healthy lon-gevity in the female Chuang population, Chi-na. Exp Gerontol, 46(12): 987-93.
24. Pan SL, Luo XQ, Lu ZP, et al (2012). Microsomal triglyceride transfer protein gene -493G/T polymorphism and its association with serum lipid levels in Bama Zhuang long-living families in China. Lipids Health Dis, 11: 177.
25. Arum O, Rasche ZA, Rickman DJ, et al (2013). Prevention of neuromusculoskeletal frailty in slow-aging ames dwarf mice: longitudinal in-vestigation of interaction of longevity genes and caloric restriction. PloS one, 8(10): e72255. 26. Colman RJ, Beasley TM, Kemnitz JW, et al
(2014). Caloric restriction reduces age-related and all-cause mortality in rhesus monkeys.
Nat Commun, 5: 3557.
27. Bennati E, Murphy A, Cambien F, et al (2010). BELFAST centenarians: a case of optimised cardiovascular risk? Curr Pharm Des, 16(7): 789-95.
28.Kawahara TL, Michishita E, Adler AS, et al (2009). SIRT6 links histone H3 lysine 9 dea-cetylation to NF-kappaB-dependent gene ex-pression and organismal life span. Cell, 136(1): 62-74.