Available online on 15.06.2019 at http://jddtonline.info
Journal of Drug Delivery and Therapeutics
Open Access to Pharmaceutical and Medical Research© 2011-18, publisher and licensee JDDT, This is an Open Access article which permits unrestricted non-commercial use, provided the original work is properly cited
Open Access
Research Article
Preparation and Characterization of Itraconazole Microsponges using
Eudragit RSPO and Study the Effect of Stirring on the Formation of
Microsponges
Monika
*1, Dua Jagdeep Singh
1, Prasad D.N.
2, Hans Mansi
1, Kumari Satish
1 1 Department of Pharmaceutics, Shivalik College of Pharmacy Nangal, Punjab, India2 Department of Pharmaceutical Chemistry, Shivalik College of Pharmacy Nangal, Punjab, India
ABSTRACT
The purpose of the present study was to prepare and evaluate Itraconazole loaded microsponges using Eudragit for the controlled release of the drug and study the effect of stirring rate on the formation of microsponges. Microsponges containing Itraconazole were prepared by using quasi-emulsion solvent diffusion method at different stirring rate i.e. 500, 800, 1000, 1200 and 1500rpm. Particle size of prepared microsponge was observed in the range of 78.43 to 23.18 µm. Scanning electron microscopy revealed the porous, spherical nature of the microsponges. The production yield, entrapment efficiency, and drug content were found to be 80.88%, 84.53% and 82.89%. The formulation with higher drug to polymer ratio 1:10 (i.e. F5) was chosen to investigate the effect of stirring rate on the morphology of microsponges. As the speed was increased, the particle size of microsponges was reduced and uniform spherical microsponges were formed. As drug polymer ratio increased, Production yield, drug content and entrapment efficiency was found to be increased while drug: polymer ratio has reverse effect on particle size, as drug: polymer ratio increase, particle size decreases. The cumulative percentage drug release upto 8hrs for F5 was 89.54% and the mechanism of drug release from the formulations during the dissolution was determined using the zero order, first order, higuchi equation and Peppas equation. All formulations were best fitted to Zero order and peppas plot. The best formulation F5 follows Zero order release.
Keywords: Microsponges, Itraconazole, stirring rate, Quasi-emulsion solvent diffusion method
Article Info:Received 04 May 2019; Review Completed 03 June 2019; Accepted 06 June 2019; Available online 15 June 2019 Cite this article as:
Monika, Dua JS, Prasad DN, Hans M, Kumari S, Preparation and Characterization of Itraconazole Microsponges using Eudragit RSPO and Study the Effect of Stirring on the Formation of Microsponges, Journal of Drug Delivery and Therapeutics. 2019; 9(3-s):451-458 http://dx.doi.org/10.22270/jddt.v9i3-s.2879
*Address for Correspondence:
Monika, Department of Pharmaceutics, Shivalik College of Pharmacy Nangal, Punjab, India
INTRODUCTION
A microsponge delivery system (MDS) is highly cross- linked porous, polymeric microspheres that can entrap wide range of active agents and in response to trigger or stimuli and
release them onto the skin over a time 1. It is a unique and
effective technology for the controlled release of topical agents. It consists of micro-porous beads, typically 5-300µm in diameter that acquire the flexibility to entrap a wide variety of active ingredients such as fragrances, sunscreens, emollients, anti-fungal, anti-infective, and anti-inflammatory agents etc., that are mostly used to prolong the topical
administration of the drug 2,3. Recently it was investigated
that microsponges also used for oral drug delivery system. Microsponge system has shown to increase the rate of solubilisation of poorly water soluble drugs by entrapping
drugs in the microsponge system’s pores 4. The topical agent
formulation with microsponge delivery system can be
prepared in many different forms, such as cream, gel, or lotion. When the formulation is applied to the skin, the MDS releases its active ingredients on a time and in response to other stimuli (rubbing, temperature, pH etc.). They reduce side effects, enhance stability and modify drug release. Because of the size of the microsponges they cannot pass through the stratum corneum, so they remain on the skin surface and slowly releasing the active ingredients over a period. Slow rate of release from MDS reduce the irritancy associated with the topical agents. Slow and gradual release pattern of MDS prevents excessive build-up of the active agents in the epidermis and dermis. Therefore, these particles, remains on the surface of the skin and its fine lines
delivering the active over prolonged time 5, 6.
purpose of the present study was to prepare and evaluate Itraconazole loaded microsponges using Eudragit RSPO for the controlled release of the drug and study the effect of
stirring rate on the formation of microsponges 7.
MATERIALS AND METHOD
Materials: Itraconazole gift sample obtained from Haustus Biotech. Pvt. Ltd., Tahliwal (Una), dibutylphthalate was procured from SD fine chem. Ltd., Mumbai, Polyvinyl alcohol was procured from GlaxoSmithKline pharmaceuticals Ltd. Mumbai, Dichloromethane procured from RFCL limited Gujarat, India, Ethanol and KBr was procured from Central drug house Pvt. Ltd., New Delhi and Distilled water.
Method of preparation of Itraconazole Microsponges: Itraconazole Microsponges were prepared by quasi-emulsion solvent diffusion method. To prepare the internal phase, Itraconazole was dissolved in 20 ml of dichloromethane:
ethanol (1:1) mixture to dissolve both the drug and the polymer (Eudragit RSPO) and to this add 0.5 ml of Dibutyl phthalate as a plasticizer. The external phase containing 100mg of PVA in water and was placed in the vessel with propeller stirrer rotating at different rpm according to batch , to this add slowly internal phase. The system was thermally controlled at 25° C in a water bath. Agitations up to 30 min permit the formation of microsponges and continue stirring for 8h to get desired rigid microsponges. After 8h stop stirring filter the rigid micro sponges through the filter paper (Whatmann filter paper 0.45 µm), washed with distilled water and dried at room temperature [8]. Itraconazole microsponges were prepared using various drugs: polymer ratios i.e. 1:2, 1:4, 1:6, 1:8 and 1:10 at different stirring rate of 500,800,1000,1200 and 1500rpm. Five formulation batches were formed from F1 to F5. The formulations of various microsponges are shown in table no. 1.
Table 1: Formulations of Itraconazole Microsponges by Quasi- Emulsion Solvent Diffusion Method
Formul-ation Polymer Drug: ratio
Drug
(mg) Eudragit RSPO (mg)
Ethanol+Dichloro-methane
(ml)
Polyvinl alcohol
(mg)
Distilled Water
(ml)
Di-butyl Phthalate (ml)
Stirring rate (RPM)
F1 1:2 100 200 20 100 150 0.5 500
F2 1:4 100 400 20 100 150 0.5 800
F3 1:6 100 600 20 100 150 0.5 1000
F4 1:8 100 800 20 100 150 0.5 1200
F5 1:10 100 1000 20 100 150 0.5 1500
Standard curve of Itraconazole and absorption maxima A precise, sensitive and accurate method for estimating
Itraconazole was developed using UV visible
spectrophotometer.
Preparation of standard stock solution
Accurately weigh 100 mg Itraconazole was taken in a clean and dry 100ml volumetric flask and was dissolved in 7.4 phosphate buffer. Then 1 ml of above solution was taken and then dissolve in another 100ml of 7.4 phosphate buffer ( stock solution) than from the stock solution 1ml of solution was taken and dissolve in 100ml of 7.4 phosphate buffer to make 1μg/ml solution. After that 1,2,3,4,5,6,7,8,9,10μg/ml solutions were made by dissolving1,2,3,4,5,6,7,8,9,10μg/ml solutions in 10 ml 7.4 phosphate buffer.
Procedure:
From stock solution 1,2,3,4,5,6,7,8,9,10ml were withdrawn separately in different 10ml volumetric flasks and volume made in each case up-to 10ml of 7.4 phosphate buffer to
produce the concentration 1,2,3,4,5,6,7,8,9,10μg/ml.
Absorbance of these solutions were recorded at λmax 261nm
against (distilled water) blank using UV-visible
spectrophotometer and standard curve was plotted between concentration v/s absorbance.
Preparation of pH 7.4 Phosphate Buffer: Placed 50ml of 0.2M potassium dihydrogen phosphate in 200ml volumetric flask, added the specified volume of 39.1ml of 0.2M sodium hydroxide and then added water to make up the volume. 0.2M Potassium dihydrogen phosphate: Dissolved 27.218gm of potassium dihydrogen phosphate in distilledwater and diluted with distilled water to 1000ml. 0.2M sodium hydroxide solution: Dissolved 8gm of sodium hydroxide in distilled water and diluted with distilled water to 1000ml.
Characterisation of Microsponges: Average Particle size of Microsponges:
Particle size of all the prepared batches of microsponge was determined using optical microscopy at 10x and 40x. The microsponges were placed on glass slide and observed under optical microsponge. The size of 50-100 microsponges was
measured using optical microscope 7, 8.
Production/ Percentage yield:
The dried microsponges of each batch are weight separately
and percentage yield is calculated 9 by using following
equation:-
Percentage yield
Entrapment efficiency (EE)/ Loading efficiency and Actual Drug Content:
100 mg of microsponges were accurately weighted. They were powdered and extracted with 100 ml of methanol. Further it was serially diluted with pH 7.4 phosphate buffer. The resulting solution was analysed for Itraconazole drug
content by measuring absorbance in a UV
spectrophotometer at 261nm using pH 7.4 phosphate buffer
as blank. The studies were carried out in triplicate 9. The
actual drug content and Encapsulation efficacy were calculated as given below:
Actual drug content(%)=(Mact/Mms)*100 Entrapment efficiency(%)=Mact/Mthe)*100
Where, Mact = actual amount of Itraconazole in weighed
quantity of microsponges
Mms = the weighed quantity of microsponge
Mthe = the theoretical amount of Itraconazole in
Scanning electron microscopy:
Scanning electron microscopy (SEM) is an electron optical imaging technique that provides photographic images and elemental information about prepared microsponges. SEM is useful for characterizing the morphology and size of microscopic specimens with particle size as low as nano meter to deca meter, the sample is placed in an evacuated chamber and scanned by an electron beam in a controlled pattern. When the electron beam interact with the specimen produces a variety of physical phenomena that when detected are used to form images and provide elemental information about the specimens. Microsponge were fixed on aluminium studs and coated with gold using a sputter coater
SC 502, under vacuum [0.1 mm Hg] 10. The microsponge
were then analysed by scanning electron microscopy (SEM). In vitro dissolution studies:
The release of Itraconazole from microponge was investigated in pH 7.4 phosphate buffer as dissolution medium (900ml) using USPXXII type I basket apparatus. A sample of microsponge equivalent to 100mg of Itraconazole was taken in the basket. A speed of 52 rpm and temperature of 37±0.5 °c was maintained throughout the experiment. At fixed intervals, aliquots (5ml) were withdrawn and replaced with fresh dissolution media. The concentration of drug released at different time intervals was then determined by measuring the absorbance using Double beam UV spectrophotometer at 261 nm against blank. The studies
were carried out in triplicate 11, 12.
Kinetic Modeling:
Data obtained from in-vitro release studied was evaluated to check the goodness of fit to various kinetics equations for quantifying the phenomena controlling the release from microspheres. The kinetic models used were zero order, first
order, and Higuchi and Korsemeyer - Peppas model 13, 14, 15.
The goodness of fit was evaluated using the correlation
coefficient value (R2).
The results of in-vitro release profile obtained for all the formulations were plotted in kinetic models as follows, 1. cumulative of drug released versus time (zero order kinetic models).
2. Log cumulative percent drug remaining to be absorbed versus time (First order model)
3. Cumulative amount of drug release versus square root of time (Higuchi model)
4. Log cumulative drug release versus log time (Korsemeyer – Peppas model)
Zero Order Kinetics:
It describes the system in which the rate of drug release is independent of its concentration.
Qt=Qo+Kot
Where
Qt=Amount of drug dissolved in time t
Qos= Initial amount of drug in the solution, which is often
zero and
Ko= zero order release constant.
If the zero order drug release kinetic is obeyed, then a plot of
Qt versus t will give a
Straight line with a slope of Ko and an intercept at zero.
First Order Kinetics
It describes the rate of drug release from the systems is concentration dependent.
Log Qt=log Qo+kt/2.303
Where
Qt=amount of drug released in time t.
Qo=initial amount of drug in the solution
k=first order release constant
If the first order drug release kinetic is obeyed, then a plot of
log (Qo-Qt) versus t will be
Straight line.
With a slope of kt/2.303 and an intercept at t=0 of log Qo
Higuchi Model
It describes that the fraction of drug release from a matrix is proportional to square root of time.
Mt/M∞=kt½
Where
Mt and M∞ = cumulative amounts of drug release at time t and
infinite time,
k = Higuchi dissolution constant reflection formulation characteristics. If the Higuchi model of drug release (i.e.
Fickian diffusion) is obeyed, then a plot of Mt / M∞ versus t1/2
will be straight line with slope of k.
Korsemeyer- Peppas model (Power Law)
The Korsemeyer- Peppas model describes the drug release from the polymeric system in which release deviates from Fickian diffusion, as expressed in following equation. Mt / M∞=ktn
Log [Mt/ = M∞] logk + n log t
Where Mt and M∞ are cumulative amounts of drug release at
time t and infinite time (i.e. fraction of drug release at time t), k =constant incorporating structural and geometrical characteristics of CR device,
n = diffusion release exponent indicative of the mechanism of release for drug Dissolution.
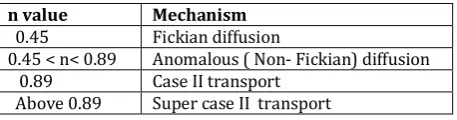
To characterize the release mechanism,
The dissolution data {Mt/ M∞<0.6} versus log t will be linear
with slope of n and intercept gives the value of log k. Antilog of log k gives the value of k.
Table 2: Interpretation of diffusion release mechanisms
n value Mechanism
0.45 Fickian diffusion
0.45 < n< 0.89 Anomalous ( Non- Fickian) diffusion
0.89 Case II transport
Above 0.89 Super case II transport
Effect of Formulation Variables on Physical Properties of Microsponge:
Effect of Drug: Polymer ratio:
their appearance, drug content, particle size and entrapment efficiency 16.
Effect of stirring speed on the formation of Microsponges:
In order to evaluate the effect of stirring speed on the formation of microsponges, were prepared with different RPM of 500, 800, 1000, 1200 and 1500 keeping all the variables constant and the formed microsponges were
evaluated for their drug content and particle size 17,18.
RESULT AND DISCUSSION
Determination of absorption maxima ( max)
UV scan of Itraconazole in phosphate buffer pH 7.4 was done. Analysis by UV spectrophotometer depicted absorption
maxima of Itraconazole at max was 261nm at pH 7.4 of
phosphate buffer.
Figure 1: Absorption spectra of Itraconazole
Figure 2: Absorption maxima of Itraconazole Standard curve of Itraconazole in saline phosphate buffer (pH 7.4)
The calibration curve of Itraconazole in phosphate buffer (pH 7.4). A straight line was obtained by plotting the concentration of Itraconazole (µg/ml) versus absorbance. The result indicates that the calibration curve of the drug obeys Beer's law.
Table 3: Standard curve data of Itraconazole in phosphate buffer (pH 7.4)
conc. (μg/ml) absorbance
1 0.012
2 0.014
3 0.017
4 0.02
5 0.023
6 0.026
7 0.029
8 0.034
9 0.037
10 0.057
Figure 3: Calibration curve of Itraconazole
Characterization of Microsponges Size analysis of Microsponge:
The average particle size of Itraconazole Microsponges is ranged from 78.43 to 23.18. It was observed that as the ratio of drug to polymer and stirring rate increased, the particle size decreased.
Table 4: Average Particle Size of Microsponge S .No Formulation code Particle size
1 F1 78.43
2 F2 63.16
3 F3 55.58
4 F4 46.91
5 F5 23.18
Drug Content:
The drug content was determined by using phosphate buffer (pH 7.4) with the help of UV spectrophotometer by dissolving the formulation in phosphate buffer for 24hrs and then sample was taken and analysed in UV- spectrophotometer, it was revealed that the drug content increased with increase in rotation per minute as well increase in the drug: polymer ratio. The drug content from F1-F5 ranges between 30.65 -82.89.
Table 5: Drug Content of Microsponges S .No Formulation code % Drug content
1 F1 30.65
2 F2 49.55
3 F3 68.93
4 F4 74.68
5 F5 82.89
mean±SD, n = 3.
Production/Percentage yield (%)
Production yield calculated for all microsponges ranged from 35.30 to 80.88 %. It was found that production yield was greatly affected by drug: polymer ratio. It was indicated that increasing polymer concentration, increased production yield. The readings are mean of three different measurements ±SD.
Table 6: Production Yield of Itraconazole Microsponge S .No Formulation code Production yield
1 F1 35.30
2 F2 49.64
3 F3 69.27
4 F4 75.79
5 F5 80.88
y = 0.0032x + 0.0076 R² = 0.9944
0 0.01 0.02 0.03 0.04 0.05
0 2 4 6 8 10 12
Ab
so
rb
an
ce
Concentration
Absorbance
Figure 4: Production Yield of Itraconazole Microsponge Entrapment efficiency/Loading efficiency:
The Entrapment efficiency of Itraconazole microsponges formulations are given in table 5.9 the loading efficiency calculated for all microsponges range from 31.23-84.53 % the highest loading efficiency. It was found for the formulation F5 where a greater amount of drug was encapsulated. It is indicated that Itraconazole/ Eudragit RSPO ratio (1:10) had the optimum capacity for drug entrapment.
Table 7: Entrapment Efficiency of Itraconazole Microsponge
S .No Formulation code Entrapment efficiency±*SD
1 F1 31.23
2 F2 50.71
3 F3 69.13
4 F4 75.82
5 F5 84.53
mean±SD, n = 3.
Figure 5: Entrapment Efficiency of Itraconazole Microsponge
Scanning electron microscopy
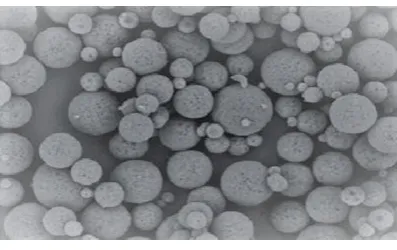
The SEM photographs of the microsponges at 1200 and 1500 rpm are shown in fig.5.8 and 5.9. SEM images showed the microsponges are porous and spherical in shape. No intact drug crystal is seen visually and inner structure was porous with void spaces. The pores were induced by the diffusion of the solvent from the surface of the microsponges. It was hypothesized that with the increase in speed, the precipitation of polymer solution droplets gradually became slower, allowing more time for formation of agglomeration. Hence for batch F5 desired porous micro sponges with maximum entrapment of drug was observed.
Figure 6: SEM images of drug loaded Microsponges at 1200 rpm
Figure 7: SEM image of drug loaded Microsponges at 1500 rpm
In-vitro Dissolution study:
The increased concentration of polymer showed the increased drug encapsulation efficiency. It was found that after 8hrs of dissolution study the formulations F1, F2, F3, F4 and F5 (figure 7) were showing 50.64, 51.32, 65.49, 82.61 and 87.54% of drug release in 8 hrs. The study indicated that the amount of drug release is increased. Formulation F5 shows better result with 87.54 (% drug release) than other formulations.
Figure 8: In-Vitro Drug Release Profile of Itraconazole Microsponges 0
20 40 60 80 100
F1 F2 F3 F4 F5
P
ro
d
u
ct
io
n
Y
ie
ld
%
Formulation Code
Production yield
Producti on…
0 20 40 60 80 100
F1 F2 F3 F4 F5
En
tr
ap
m
e
n
t
Ef
fi
ci
e
n
cy
%
Formulation Code
Entrapment efficiency
Entrapment efficiency
0 20 40 60 80 100
0 2 4 6 8 10
%
D
ru
g
R
e
le
as
e
Time(hrs)
In-Vitro Drug Release
F1
F2
F3
F4
Drug Release kinetics of Itraconazole Microsponge:
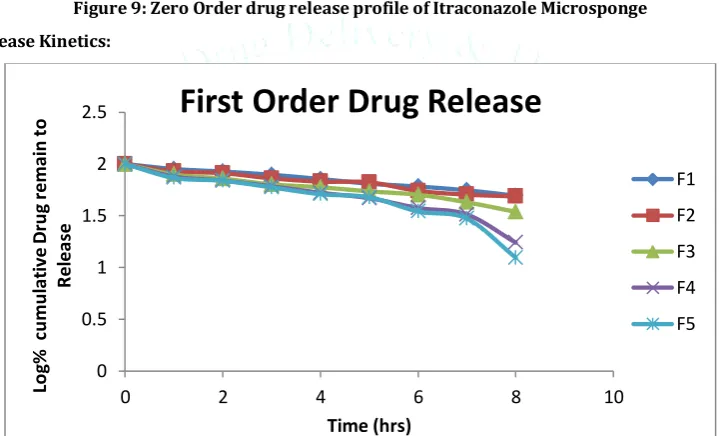
The mechanism of drug release from the formulations during the dissolution was determined using the zero order, first order, higuchi equation and Peppas equation.
Zero Order Release Kinetics:
Figure 9: Zero Order drug release profile of Itraconazole Microsponge First Order Release Kinetics:
Figure 10: First Order Drug Release Profile of Itraconazole Microsponge Higuchi Release Kinetics:
Figure 11: Higuchi Release Kinetic Profile of Itraconazole Microsponge
0
20
40
60
80
100
0
2
4
6
8
10
C
u
m
u
la
ti
ve
%
D
ru
g
R
el
ea
se
Time(hrs)
Zero order Drug Release
F1
F2
F3
F4
F5
0
0.5
1
1.5
2
2.5
0
2
4
6
8
10
Lo
g%
c
u
m
u
la
ti
ve
D
ru
g
rem
ai
n
t
o
R
e
le
as
e
Time (hrs)
First Order Drug Release
F1
F2
F3
F4
F5
0
10
20
30
40
50
60
70
80
90
100
0
0.5
1
1.5
2
2.5
3
C
u
m
u
la
ti
ve
%
D
ru
g
R
el
ea
se
Square root of time
Higuchi Model
F1
F2
F3
F4
Korsmeyer-Peppas Release Kinetic Data of Itraconazole:
Figure 12: Peppas Release Kinetic Profile of Itraconazole Microsponge Kinetic Modeling of microsponge formulations:
In vitro drug release data of the microsponge formulations was subjected to goodness of fit test by linear regression analysis according to zero order and first order kinetic equations.
Table 8: Kinetic Modeling of Micro Sponge formulation
Formulation
Zero order Kinetic
data
First order
Kinetic data Higuchi Matrix
Kinetic data Peppas kinetic data Best fit Model Regression
Coefficient(r2)
Regression Coefficient(r2)
Regression Coefficient9(r2)
Regression Coefficient(r2)
n-value
F1 0.991 0.995 0.954 0.728 1.309 Zero Order
F2 0.963 0.978 0.964 0.647 1.243 Zero Order
F3 0.945 0.973 0.985 0.582 1.236 Zero Order
F4 0.964 0.925 0.967 0.589 1.300 Zero Order
F5 0.959 0.875 0.952 0.581 1.302 Zero Order
The mechanism of drug release from the formulations during the dissolution was determined using the zero order, first order, higuchi equation and Peppas equation. All formulations were best fitted to Zero order and peppas plot. The best formulation F5 follows Zero order release
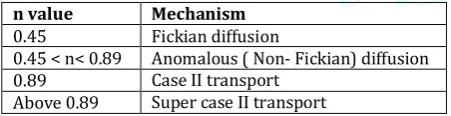
Table 9: Interpretation of diffusion release mechanisms
n value Mechanism
0.45 Fickian diffusion
0.45 < n< 0.89 Anomalous ( Non- Fickian) diffusion
0.89 Case Ⅱ transport
Above 0.89 Super case Ⅱ transport
Effect of Formulation variables on the formation of Microsponges:
Effect of drug: polymer ratio:
As the drug polymer ratio increased Production yield, drug content and entrapment efficiency was found to be increased while drug: polymer ratio has reverse effect on particle size, as drug: polymer ratio increase, particle size decreases as shown in the table 4.
Effect of Stirring rate on the morphology and yield of Microsponges:
The effect of stirring rate on the morphology of microsponges is shown in Fig.6 and 7. The formulation with higher drug to polymer ratio (i.e F4 and F5) was chosen to investigate the effect of stirring rate on the morphology of microsponges. The stirring rate was varied in the range of
500 to 1500 rpm. As the speed was increased the size of microsponges was reduced and the microsponges were found to be spherical and uniform. It was observed that with increased drug: polymer ratio particle size decreased, which could be correlated with the kinetics of microsponge formation in the presence of comparatively lower concentrations of the polymer. It was also noted that at higher stirring rate, the production yield was increased.
Effect of Polymer concentration:
As the polymer concentration increased, more amount of polymer surrounding the drug, thus increasing the thickness of the wall of the polymer matrix which led to extended diffusion path and ultimately to lesser drug release or extended release.
CONCLUSION
The aim of the present study was to make the Itraconazole microsponges so that the drug is able to release in a controlled manner and also enhance the bioavailability of the drug. Itraconazole is a poorly soluble drug and undergo first pass metabolism when taken orally, thus selected as a model drug for MDDS to overcome these problems.
The method used for the preparation of Itraconazole microsponges was quasi-emulsion solvent diffusion method using Eudragit RSPO as a polymer. This method found to be simple, reproducible and rapid
- Compatibility studies were performed for the drug
(Itraconazole) and polymer (Eudragit RSPO).
0
0.5
1
1.5
2
2.5
-0.2
Lo
g
0
0.2
0.4
0.6
0.8
1
C
u
m
u
la
ti
ve
%
D
ru
g
R
el
ea
se
Log Time
Peppas Model
F1
F2
F3
F4
- FT-IR spectroscopy analyses indicated the chemically
stable i.e. no interaction between the drug and polymer.
- Standard graph was drawn for Itraconazole and it was
found that the study showed linearity (R2 = 0.994) and
obeyed Beer Lambert’s law.
- SEM photographs showed the spherical nature of the
micro sponges in all variations.
- The mechanism of drug release from the formulations
during the dissolution was determined using the zero order, first order, higuchi equation and Peppas equation. All formulations were best fitted to Zero order and Peppas plot.
- Varied drug–polymer ratio and stirring rate reflected
remarkable effect on particle size, drug content and encapsulation efficiency. It was observed that as the drug to polymer ratio was increased, the particle size decreased.
- The effect of stirring rate on the morphology of
microsponges was also investigated. As the speed was increased, the size of microsponges was reduced and uniform spherical microsponges were formed .It was also noted that at higher stirring rate, the production yield was decreased. Possibly at the higher stirring rates the polymer adhered to paddle due to the turbulence created within the external phase, and hence production yield increased.
- The mechanism of drug release from the formulations
during the dissolution was determined using the zero order, first order, higuchi equation and Peppas equation. All formulations were best fitted to Zero order and Peppas plot. The best formulation F5 follows Zero order release.
ACKNOWLEDGEMENT
I myself Monika wants to firstly thank Almighty God and my parents for their immense support during the research work. I would like to put my gratitude to the co-authors who helped a lot during this research work. Special thanks to our Head of Pharmaceutics Department, Dr. Jagdeep Singh Dua who helped a lot with the understanding of concepts which arises during research work.
REFERENCES
1. Mantry S, Bagchi A, Das S, Das S. Microsponge as A Novel
Stratergy of Drug Delivery System, Universal Journal of pharmaceutical science and research, 2015; (1):32-38.
2. Jain V and Singh R. Dicyclomine-loaded eudragit based
microsponge with potential for colonic delivery Preparation
and characterization, Tropical Journal of Pharmaceutical Research, 2010; 9(1):67-72.
3. Kumari P, Mishra SK. A Comprehensive Review on Novel
Microsponges Drug Delivery Approach, Asian Journal of Pharmaceutical and Clinical Research, 2016; 9(1):25-30.
4. Gupta A, Dhyani A and Juyal D. Microsponges laden gels for
topical delivery: A novel approach The Pharma Innovation Journal 2016; 5(6):39-43.
5. Kumar JR, Muralidharan S and Parasuraman S. Evaluation of
Antifungal Activity of Sustained Release Microsponge Enriched Fluconazole Gel for Penile Candidiasis in Male Rats, International Journal of PharmTech Research, 2014; 6(6):1888-1897.
6. Avhad P S. and Patil PB. A New Era in Topical Formulations –
Microsponge Drug Delivery System International Journal of Pharmaceutical Science and Research, 2016; 7(7):2756-2761.
7. Patel A, Upadhyay P, Trivedi JJatin, Shah S and Patel J.
Microsponges as the versatile tool for Topical route: A Review, International Journal of Pharmaceutical Science and Research, 2012; 3(9):2926-2937.
8. Jain N, Sharma PK, Banik A. Recent advances on microsponge
delivery, International journal of Pharmaceutical Sciences Review and Research, 2011:8(2):13-23.
9. Jain V, Singh R. Development and characterization of
EudragitRs 100 loaded microsponges and its colonic delivery using natural polysaccharides. Actapoloniaepharmaceutica-drug research. 2010; 67(4):407-415.
10. Nanda S. Microsponge drug delivery syatem: an overview,
World Journal of Pharmacy and Pharmaceutical sciences, 2013; 2(3):1032-1043.
11. Khullar R , Kumar D, Seth N, Saini S. Formulation and
evaluation of mefenamic acid emulgel for topical delivery. Saudi Pharmaceutical Journal. 2012; 20:63-67
12. D’souza J.I, Masvekar R.R, Pattekari P.P, Pudi S.R, More H.N.
Microspongic Delivery of Fluconazole for Topical Application. Indo-Japanese International Conference on Advances in Pharmaceutical Research and Technology, 2004; 76.
13. Pradhan SK. Microsponge as the Versatile Tool for Drug
Delivery System International Journal of Pharmaceutical Science and Research, 1(2): 243-258.
14. Patel N, Tipadia N, Neha Vadgama, Raval M. Formulation and
evaluation of microsponge gel for topical delivery of fluconazole for fungal therapy. Journal of Pharmaceutical Investigation 2016; 46(3).
15. Arora N, Agarwal S, Murthy RSR. Latest Technology Advances
in Cosmaceuticals. International Journal of Pharmaceutical Sciences and Drug Research, 2012; 4(3):168-82.
16. Shah CN, Shah DP. Microsponges: A Revolutionary Path
Breaking Modified Drug Delivery of Topical Drugs. International Journal of Pharmaceutical Research, 2014; 6(2): 1-13.
17. Bamane S. Ganesh, Kakade B Tejaswini, Metkari B Vijay,
Kulkarni V Laxmikant. Microsponges: A Novel Drug Delivery System. World Journal of Pharmacy and Pharmaceutical Sciences, 2014; 3(3):748-62.
18. Veer SU, Gadhve MV, Khedkar AN. Microsponge: A Drug