IXP traffic: a macroscopic view
Juan Camilo Cardona Restrepo
Institute IMDEA NetworksUniversidad Carlos III Madrid, Spain
Rade Stanojevic
Telefonica Research Barcelona, SpainABSTRACT
Today’s public Internet eXchange Points (IXP) are a crucial element in the Internet ecosystem, carrying around 20−
24T bps, i.e. 15-20% of Internet’s inter-domain traffic and supporting a large percentage of links among autonomous systems. In spite of their importance, community still lacks empirical data on the nature of the traffic exchanged through IXPs. In this paper, we analyze the traffic data from two medium-size IXPs and draw several important conclusions. We quantify the relationship between the different types (access/content/transit) of ISPs present in the two studied IXPs, both in terms of traffic volumes and peering inten-sity. We also demonstrate that the peering (AS-level) topol-ogy within the IXP is impacted by the pricing model of the IXP. Finally, we shed light on the temporal characteristics of the traffic exchanged at IXPs and list a number of research problems that can benefit from the data studied here. We strongly believe that, in contrast with confidential datasets typically used in studying the Internet traffic characteristics, the IXP data provide rich and publicly available resources crucial for understanding various aspects of the Internet.
Categories and Subject Descriptors
C.2.3 [Computer-communications networks]: Network operations; network management
General Terms
MeasurementKeywords
Internet eXchange; Peering; Traffic matrix; Internet traffic
1.
INTRODUCTION
Over the previous decade, the Internet eXchange Points (IXPs) have become a vital part of the Internet, carrying a considerable amount of its links and a large fraction of the inter-domain traffic. Globally, there are few hundred IXPs varying in size from small regional IXPs serving single-digit
Permission to make digital or hard copies of all or part of this work for personal or classroom use is granted without fee provided that copies are not made or distributed for profit or commercial advantage and that copies bear this notice and the full citation on the first page. To copy otherwise, to republish, to post on servers or to redistribute to lists, requires prior specific permission and/or a fee.
LANC’12 October 4-5, 2012, Medellin, Colombia Copyright 2012 ACM 978-1-4503-1750-4/12/10 ...$15.00.
number of members to large international ones containing hundreds of ISPs. Two of the most cited reasons for such expansion of IXPs are the improvement in technical perfor-mance and reduction of peering costs for the involved ISPs. Currently, a significant fraction (∼ 20%) of inter-domain traffic is exchanged through IXPs, and this fraction is grow-ing as a result of the increasgrow-ing number of ISPs that chose to exchange part of their traffic via one or more exchange points [9, 17, 13].
Albeit the significance of IXPs, the research community still lacks a complete understanding of the role of Exchange Points in the Internet ecosystem. One of the main reasons hereof is the absence of sufficient public information from IXPs. Ideally, we would like to have a full ISP-to-ISP traffic matrix for all ISPs that peer at a particular exchange point. However, except for one IXP, we could not identify any IXP that publishes this information. On the other hand, it is common for IXPs to publish their aggregated traffic statis-tics. When they do it, these stats are of varying granu-larity, and are usually very crude, typically capturing the stats summed across all ports. Such statistics indeed pro-vide useful high-level information, but are of limited value for understanding the operation of an IXP and the interac-tions among many involved factors: upstream/downstream traffic, temporal effects, pricing, peering relationships, etc. Nevertheless, several IXPs publish additional information, such as the per-member traffic stats and the peering matrix (who peers with whom). These data can be combined to provide valuable information for estimating the IXP traffic matrix, hence allowing a deeper study of the exchange point. We will elaborate on the data collection and structure later in Section 2.
var-ious aspect of the Internet (Section 5).
1.1
Background
An Internet eXchange Points (IXP) is a physical infras-tructure used to facilitate the exchange of traffic between Internet Service Providers (ISPs). Two ISPs present at a particular IXP may decide to peer (exchange traffic) be-tween each other or not, depending on their business, social and technological characteristics. While peering between two ISPs can be established outside of IXPs, peering via IXP is often less expensive1.
Nowadays there are more than 200 IXP around the world [13, 2]. Depending on the number and geographical coverage of their members, IXPs can play different roles in the con-nectivity of regions. Large IXPs are usually the ideal place for the establishment of peering relationships among compa-nies spanning various countries. Smaller exchange points are usually founded to facilitate the interconnection of national-wide ISPs and enterprises. Many research projects would greatly benefit from the characterization of IXPs (e.g. eval-uating the resiliency and security of the Internet). However, although the majority of IXPs are non-profit driven, detailed information on them is scarce.
One of the unresolved questions around IXPs is the amount of Internet links supported by them. Xu et al.[28], He et al.[16] and more recently Augustin et al.[2] have presented different estimations for this value. Out of the 57.6K links detected by [2], around 30K were not found in other large AS-link datasets (CAIDA, DIMEA or PlanetLab), showing how undervalued this type of links were in past Internet mea-surement projects. The data gathered in [2] is the latest and richest source of IXP’s peering links, however, as it is often the case, the methodology is efficient only for interconnec-tions between ASes that possess some kind of “probe” (e.g. Looking Glass or a loose-source record-route router) that can be openly accessed. Since most ISPs do not have these kind of monitoring points available, our knowledge of IXP’s links is most probably incomplete [21, 2]. This assumption is certified by comparing the most recent datasets with the peering matrices of some IXPs that publish such informa-tion. To give an example, the estimated peering density2of MIX and SIX according to [2] is 14% and 10% respectively, while IXP’s data shows a peering density of around 58% and 69%. A similar observation was provided in [14] using data of a large European IXP. This is again a proof that our view of the Internet topology is rather limited and many of the missing links are located in IXPs.
Other important parameter to quantify is the percent-age of Intra-domain traffic routed through Exchange Points. A large fraction of existing IXPs publish aggregate traffic statistics, which indicate a steady exponential growth of IXP traffic during the last decade. Worldwide, the current IXP traffic is in the range of 10-12Tbps of two way traffic (thus 20-24Tbps overall) [13]. Using the findings from [17], one can derive an estimate of the total Internet inter-domain traffic (sum of all entries in the global AS-AS traffic matrix)
1
Indeed, the cost of creatingN direct (non-IXP) peerings, essentially grows asO(N), while the cost of peering via IXP is virtually independent of the number of peering links es-tablished via IXP [8].
2
The peering density is calculated as the ratio between the actual number of peerings and the number of possible peer-ings inside the IXP
in the mid of 2012 at around 120Tbps3. Thus we estimate the fraction of total Internet inter-domain traffic exchanged via IXPs, to be in the range of 15-20%. For some ISPs the fraction of IXP traffic is even higher; e.g. in some European academic networks that openly publish their traffic stats, IXP traffic corresponds to 40-50% of their totals [23, 4]. In some other heavily localized Internet markets such as Japan this fraction can be as high as 70%[6].
1.2
Related Work
Despite its critical importance in the Internet ecosystem, the empirical studies of existing IXPs are only starting to appear. Augustin et al. [2] presented a measurement study of the peering relationships at IXPs worldwide, in which they report around 200 operational IXPs, and rich topological data on the peering relationships happening at these IXPs. The authors of [1, 15] use data from [2] and other datasets, to study implications of IXPs on the AS-level topology of the Internet. More recently, Feldmand et al. [14] analyze a large European IXP, exploring the traffic exchanged among its members and their characteristics. The two IXPs examined here are of mid-size and regional scope, therefore, our study is complementary to [14].
The inter-domain traffic matrix (TM) has many implica-tions on the design of existing networks (e.g. for traffic engi-neering, transit/peering link creation, etc.) and has crucial effect on the operation of the Internet [5, 9, 10]. Estimation of TM entries from link measurements in an ISP has been widely studied [12, 29, 30] and similar tools can be applied in studying TM in the IXP setting in case no full TM is known. The TM estimation from the ISP link-level data is normally not at the AS granularity [17]. In contrast with confidential data that is typically used for TM estimation, the IXP traffic data is often public and can be used to de-rive the full information about the traffic exchanged between most of the pairs4 of ASes that peer at the IXP.
1.3
Contributions
The main contributions of this paper are:
•We study basic characteristics of the traffic exchanged at IXPs. In particular we demonstrate that the IXP-member demand distribution is very skewed and that the traffic is dominated by the few heavy peering pairs (Sec. 4.2). We do not observe significant correlation between the peering intensity (the number of peerings) of a member with respect to its type, nor its traffic volume (Sec 4.3 and 4.4).
•We demonstrate strong correlation between the pricing model employed by the IXP and the peering density among the heavy peers: an IXP with a flat-fee pricing is signifi-cantly more likely to see heavy pairs peering, compared to an IXP with usage-based pricing (Sec. 4.1).
•Researching the Internet traffic, normally involves confi-dential datasets that are usually non-accessible to third par-ties. We bring attention to the community of a valuable set of public data, and discuss a number of research challenges
3
The estimate of total inter-domain traffic given in [17] was 40Tbps in the mid of 2009, while adjusted for yearly growth of 45%[17, 7], provides this estimate of around 120Tbps of current traffic (June of 2012).
4
SIX MIX
Members 46 61
avg throughput (daily) 5Gbps 10Gbps
peering density 69% 58%
Table 1: Basic stats on MIX and SIX in February 2008.
1SolveGravity(u,d, P eering−M atrix)
2 fork= 1 :N
3 Ak(0) =
√
dk
4 Rk(0) =
√
uk
5 endfor
6 t = 0
7 untilconvergence
8 fork= 1 :N
9 Aˆk(t+ 1) = P dk
speer withk Rs(t)
10 Rˆk(t+ 1) =P uk
speer withk As(t)
11 endfor
12 η=
s
PN
k=1Akˆ (t+1)
PN
k=1Rkˆ (t+1) 13 A(t+ 1) =A(ˆtη+1)
14 R(t+ 1) =ηRˆ(t+ 1)
15 t=t+ 1
16 repeat
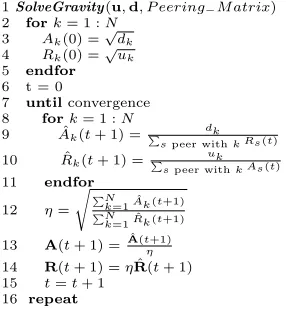
Figure 1: The pseudocode for solving gravity.
that these public data can be used for (Sec. 5).
2.
DATASETS DESCRIPTION
In this paper we use data from two medium-sized IXPs: Milan-IX (MIX) and Slovak-IX (SIX). The datasets are de-scribed below.
MIX data. The dataset consists of traffic exchanged be-tween 61 members, present at MIX. Foreach pair of mem-bers, the total traffic in both directions is reported for forty eight 30-minute time slots during one day in 2008.
SIX data. Slovak IX publishes the peering matrix with info on which member pairs do peer and which do not. Ad-ditionally, SIX publishesmrtg[20] statistics, reporting the traffic volumes in both directions aggregated per each mem-ber [25]. We have collected the information from SIX since 2010 and used Internet archives to find the data for previous years [3]. In order to compare both IXPs in the best possible way, we use the data for SIX that corresponds to February of 2008. Table 1 summarizes the basic stats of these two IXPs.
Even when the data utilized for the analysis of SIX and MIX is not current, there are reasons to value the compari-son of these two IXPs using this data-set. Foremost, despite of the changes experienced by the two exchange points in the last few years, some of the characteristics of IXPs remain invariant for large periods of time [3], thus maintaining the validity of this comparison. Moreover, the different features highlighted here can later be used to compare the state of the IXPs at this time with other regional exchange points around the globe.
3.
GRAVITY LAW AT IXP
Before proceeding with the comparison of SIX and MIX, we introduce in this section an algorithm that allow us to obtain an estimation of the distribution of exchanged traffic
on an IXP when only the peering matrix and the total traffic per member is known. For this purpose, we quantify up to which extent the so called gravity law applies to IXP traffic. The gravity law states that the amount of trafficTijflowing from networkito networkjcan be approximated as:
Tij=
Ri·Aj
Fij
, (1)
whereRi is the repulsion factor of i; Aj is the attraction factor of j andFij is a friction parameter. The attraction and repulsion are related to the tendency of the network to, respectively, receive and send traffic. The friction param-eter is typically inversely proportional to the ‘distance’ (in some metric space) between i and j. Since the two stud-ied IXPs cover relatively small geographic area (a country), the friction parameter is unlikely to depend on the geo-graphic distance, and in this paper we take it to be constant:
Fij= (M bps)−1.
In the case where the peering graphGis a full mesh (ev-eryone peers with ev(ev-eryone) computing the repulsion and at-traction factors from the upstream/downstream traffic stats is trivial: they are equal (up to a multiplicative constant) to the corresponding upstream and downstream traffic volume, respectively. Unfortunately, the peering graph is normally not a full mesh and the computation of repulsion and at-traction is not straightforward. Namely in that case
Aj X
(i,j)peer
Ri=dj, for allj, (2)
Ri X
(i,j)peer
Aj=ui, for alli, (3)
whereukanddkis the upstream and downstream traffic vol-ume of networkk, respectively. It is not hard to see that the system (2)-(3) is under-determined: if (A1, . . . , AN, R1, . . . ,
RN) is a solution to (2)-(3), then for any positive scalarα
the vector (αA1, . . . , αAN, R1/α, . . . , RN/α) solves (2)-(3) as well. To enforce the uniqueness of repulsion and attrac-tion parameters we require the following normalizaattrac-tion con-straint to be met:
N X
k=1
Ak= N X
k=1
Rk, (4)
50 100 150 200 250 300 350 400 450 500 50
100 150 200 250 300 350 400 450 500
Real Average Daily Throughput (Mbps)
Estimated Average Daily Throughput (Mbps)
Figure 2: Real throughput compared to throughput estimated using the gravity model.
100 101 102 103 104 105 106 107 108 109 0
0.1 0.2 0.3 0.4 0.5 0.6 0.7 0.8 0.9 1
Exchanged traffic (bps)
Fraction of pairs
Real Traffic Matrix Estimated Traffic Matrix
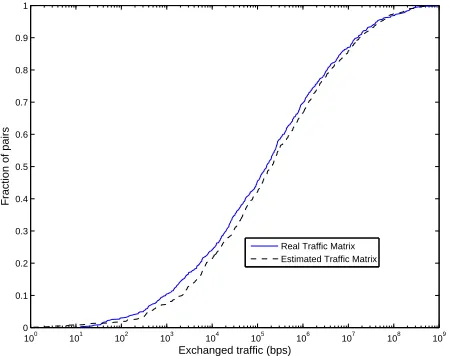
Figure 3: Cumulative distribution of exchanged traf-fic for peering pairs in both the real and estimated traffic matrix of MIX.
a simple method allowing us to explicitly estimate the IXP TM with reasonable accuracy, which is indeed achieved by the gravity method tailored for the IXP case.
3.1
Attraction and repulsion
As we mentioned, even though closely correlated, the re-pulsion/attraction parameters of an ISP, are not directly derivable from the upstream/downstream traffic measure-ments. For example a heavy attractor/repulser may peer with a low number of peers, which can result in low amount of traffic exchanged. Therefore we use the repulsion and at-traction parameters as indicators of the ISP demand (size) rather than the observed traffic itself.
In Figure 4 we plot attraction against repulsion for each member of MIX and SIX. We used the type classification from PeeringDB [22] to distinguish between access, content and network service providers (NSP). We stress that there is no sharp line between these three categories, since often each network may provide multiple services (e.g. a NSP offering
0 10 20 30 40 50 0
10 20 30 40 50 60 70 80 90
MIX
Repulsion
Attraction
0 5 10 15 20
0 5 10 15 20 25 30 35
SIX
Repulsion Access Content NSP
Figure 4: Attraction vs Repulsion for members of SIX and MIX.
access services). From Figure 4 we can deduce two impor-tant observations. First, not surprisingly, the access net-works typically have larger attraction/repulsion ratio while the content providers have the opposite property. And sec-ond, the distributions of repulsion and attraction parameters are very skewed, with a few members dominating the others in terms of size.
4.
COMPARING SIX AND MIX
4.1
Pricing model matters!
The two studied IXPs are similar in many ways: they host similar number of members, with similar traffic levels, and similar peering density (see Table 1). Besides, both of them are the dominant national IXP, with virtually all their members operating in Italy or Slovakia respectively. Nevertheless, there is one striking difference between them in terms of peering between ‘heavy’ pairs. In order to define the weight of the pair of members, we use the repulsion and attraction parameters to obtain a first-order approximation of the traffic flowing between the pairs of members in an IXP (for those that peer and also those that do not peer). We define the weight orpotential of a pair of members (i, j) as
Pij= (Ai·Rj+Ri·Aj)(M bps). (5)
0 10 20 30 40 50 60 70 80 90 100 0
1000 2000 3000 4000 5000
MIX
Potential (Mbps)
0 10 20 30 40 50 60 70 80 90 100 0
200 400 600 800
SIX
Pair number
Potential (Mbps)
Pairs with peering Pairs without Peering
Figure 5: The potential between pairs at SIX and MIX (Top 100 pairs shown).
0 0.2 0.4 0.6 0.8 1
0 0.2 0.4 0.6 0.8 1
Top peering pairs
Fraction of total traffic
SIX
MIX Estimated MIX Real
Figure 6: Fraction of total traffic generated by heav-iest peering pairs at SIX and MIX.
based, 90th-percentile pricing [19]. Additionally, the price perM bpsin MIX case was prohibitively expensive, calling for non-IXP peering between heavy pairs (willing to peer).
Remark. After our MIX-traffic data was collected, the pricing model in MIX changed from usage-based to flat-fee. However, we did not see significant increase in the peering density between heavy pairs, which is probably due to the fact that once a non-IXP peering is created, there is virtually zero-cost for maintaining such peering.
4.2
Traffic distribution
Another important property of the IXP traffic is the het-erogeneity of the traffic volumes among the peering pairs. In other words, the IXP traffic is dominated by a few heavy peering pairs. In Figure 6 we depict the fraction of the IXP traffic generated by the top-x% peering pairs. For MIX, both the direct measurement and the gravity estimates are shown, while for SIX only the estimated values (from gravity model) are shown. We can observe that top-10% of peering pairs generate 85-90% of traffic and top-1% of peering pairs generate 30-40% of the IXP traffic. A different perspective of the distribution of traffic among peering pairs is depicted in Figure 7, which shows a histogram of the traffic exchanged
0 1 2 3 4 5 6 7 8 9
0 20 40 60 80 100 120
Log of exchanged Traffic (bps)
Count of pairs
SIX MIX
Figure 7: Traffic distribution for SIX and MIX in 2008.
by peering pairs in both MIX and SIX. The traffic distri-bution of both IXPs is quite similar and in both cases half of the peering pairs exchanged less than 300Kbps, a very low amount of traffic which most probably would only make sense to exchange inside an IXP.
4.3
ISP-type
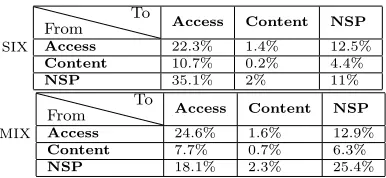
Different types of networks peer through IXPs. We use the Peering DB5 [22] to classify the members of SIX and MIX into three categories: access, content and network ser-vice providers (NSP). We stress that this classification is relatively crude as some members (particularly at MIX) of-fer multiple services and cannot be clearly classified in one of these three types. Table 2 lists the fraction of the total IXP traffic flowing between different member types. Not sur-prisingly, we observe that access networks are sinks of more than 50% of total traffic (65% in SIX case) and that content traffic is dominated by download. Inconsistencies between SIX and MIX, are mainly result of the fact that several large Italian access and content providers are represented at MIX by the parent AS which is an NSP.
One may wonder whether peering density varies between different types of members (i.e. whether access ISP is more likely to peer with content ISP than NSP). We summarize our findings in Table 3, which shows no evidence for signifi-cant difference of peering density between different member types.
4.4
Peering intensity vs. member size
Another question that arises in the analysis of IXP is whether the member’s traffic volume affects the number of peerings it engages at the IXP, or not. We do not observe such dependence at neither MIX nor SIX. In Figure 8 we plot the number of peerings for each member of the IXPs, against its size. Apparently, the peering intensity (the num-ber of peering relationship the memnum-ber engages) of a
mem-5
SIX
From To Access Content NSP
Access 22.3% 1.4% 12.5%
Content 10.7% 0.2% 4.4%
NSP 35.1% 2% 11%
MIX
From To Access Content NSP
Access 24.6% 1.6% 12.9%
Content 7.7% 0.7% 6.3%
NSP 18.1% 2.3% 25.4%
Table 2: Relative traffic exchanged between the dif-ferent types of members for SIX and MIX.
SIX From
To Access Content NSP
Access 77.8% 92% 65.9%
Content 92% 100% 75.2%
NSP 65.9% 75.2% 53.8%
MIX From
To Access Content NSP
Access 52.4% 67.4% 44%
Content 67.4% 80.9% 52%
NSP 44% 52% 43.3%
Table 3: Density of peering between types of mem-bers for SIX and MIX.
ber does not appear to depend on its size, in spite of large differences in the member traffic volumes (multiple orders of magnitude).
4.5
Temporal effects
Different networks have different diurnal cycles, some peak in early afternoon, others in late evening [18]. The ratio be-tween the peak-hour traffic (say 95th-percentile) and the off-peak-hour traffic (say 5th-percentile), is another parameter heavily influenced by the user base, their behavioral pattern and also the application mix they are running. However when two ISPs with different temporal patterns peer, the traffic exchanged between them follows the temporal pat-tern influenced by both ISPs. In Figures 9 we visualize the empirically observed peak-hour ratio for the MIX’s top-20 attractors, top-20 repulsers and the peering pairs that ex-change at least 10M bps6. The checkerboard plot in Figure
6Those pairs that exchange less than 10M bps, often lack the
100 101 102 103 104 0
5 10 15 20 25 30 35 40 45 50
MIX
Traffic (Mbps)
Number of Peers
100 101 102 103 104 0
5 10 15 20 25 30 35 40 45
SIX
Traffic (Mbps) Access
Content NSP
Figure 8: Peering intensity vs. traffic of ISPs peer-ing at MIX and SIX.
Figure 9: Peak hour for the MIX’s top-20 repulsers (upstream), the top-20 attractors (downstream) and the pairs that exchange>10M bps.
9 illustrates the peak-hour value for the exchanged traffic, while the external bars (parallel to the axes) show the peak-hour for the total traffic of each ISP. As the external bars show, the ISPs are sorted based on their peak hour.
To provide an example of the interpretation of Figure 9, we examine here the traffic exchanged between ISPs 01 and R (ISPs names are anonymized). From the adjacent bars, we can observe that the total traffic of ISP R peaks at 6pm, while the total traffic of ISP 01 peaks at 2pm or before. The total exchanged traffic (sum of the traffic flowing in both directions) peaks at 3.5pm, a value that is depicted in cell (01, R) of the Figure.
Figure 10 has the same interpretation than Figure 9, but it shows the peak-to-valley ratio instead of the peak-hour. From the two Figures, one can observe that the temporal pa-rameters (peak hour and peak-to-valley ratio) of each pair of ISPs can be roughly approximated with a weighted average of the corresponding parameters of the two involved ISPs.
Temporal dynamics of SIX is somewhat different as its members peak a couple of hours later than MIX in aver-age. This is probably due to differences in the predominant type of final customers served by the members of each IXP. Though, the variation in peak-hour periods and peak-to-valley ratio among different members of SIX is similar to that observed in MIX.
5.
DISCUSSION AND OPEN PROBLEMS
We believe that the public traffic data available at many IXPs is an under-utilized resource for understanding the In-ternet properties. In this work we present some initial results and quantify basic properties of two medium-sized IXPs. The data studied here opens many opportunities, beyond those investigated in this paper, including several listed be-low.
Correlation of inter-domain traffic with measur-able parameters. Each AS has a number of globally
Figure 10: Peak-to-valley ratio for the MIX’s top-20 repulsers (upstream), the top-20 attractors (down-stream) and the pairs that exchange>10M bps.
surable parameters that can characterize its position in the Internet ecosystem such as IP address space size, AS neigh-bors, number of bittorrent clients, etc. Our initial analysis shows strong correlation between the repulsion / attraction of an ISP and some of those parameters, and suggests that some very simple methods can be used for estimating re-pulsion / attraction of an arbitrary AS. We acknowledge that more subtle methods would be needed on top of such first-order approximation for an accurate estimation of the AS-AS traffic.
Using traffic info to do IXP topology mapping. There are a dozen of IXPs that publish per-member traffic statistics but no peering matrix, limiting the accuracy of the TM estimation. Mapping of the IXP topologies is far from complete [2, 26, 24]. The most recent of these projects [2] identifies only around one third of the existing peering pairs in the two IXPs studied here. Can we infer IXP’s AS-level topology using traffic statistics and some signal processing tools?
IXP traffic dynamics. Traffic dynamic on various time scales is an important aspect of any network. For exam-ple, monthly or yearly growth is essential for infrastructure dimensioning and traffic engineering. The network’s daily and seasonal trends provide interesting social information regarding its user base. The peak-to-valley ratio in a given network is closely related to the application mix used in the network; i.e. a residential ISP with heavy P2P usage would have a low peak-to-value ratio, while an enterprize network would typically have very high peak-to-valley ratio [11, 27]. Understanding the evolution of such temporal properties is in the focus of our current research. While IXPs often pro-vide data for the past 12-24 months, web-archives can be used for digging into historical data.
Comparing Large (international) and Regional Ex-change Points. In terms of the member composition IXPs can be: (1) regional/national IXPs with similar user base and (2) international IXPs that host globally present ISPs and large ISPs from a number of different countries. Most of the IXPs, including the two analyzed here, belong to the first category. However, several largest IXPs are of the
sec-ond type. We believe that the traffic in those international IXPs differs in some important aspects (e.g. gravity law with constant friction may not apply) and further research and measurement data is needed to reveal the similarities and differences between these two types of IXPs.
Economics of IXP. Qualitatively, the positive impact that IXPs have on the involved ISPs have been widely ac-knowledged. On the quantitative level however, very little is known on the economic impact of IXPs on their members and the Internet in general. This is partly due to the lack of empirical data on the IXP usage. As part of our future work, we plan to deepen the quantitative understanding of the IXP’s economics, using the data studied here.
Using IXP traffic to estimate non-IXP traffic. IXPs see/publish only part of the members’ traffic. Can we use the IXP traffic to estimate the non-IXP/transit traffic of an ISP in terms of volume, daily/seasonal peaks, peak-to-valley ratio, up/downstream ratio, etc.?
6.
SUMMARY
Thanks to their economical and technical benefits, IXPs have become an significant part of the Internet infrastruc-ture and a key element for the connectivity of regions. Al-though their importance is evident, the research community is still striving to acquire a better understanding of IXPs.
In this paper, we examine and compare data from two Eu-ropean IXPs to obtain a better characterization of exchange points. Not surprisingly, we encounter that no past project was able to find many of the peerings established inside the two analyzed IXPs and thus, we reassert that the current measured AS-level topology still underestimates the total amount of peering links located in exchange points. We also show that the traffic distribution in both IXPs is similar and observe that it is dominated by a few heavy peering pairs. Furthermore, we look into some of the temporal characteris-tics of the exchanged traffic. Finally, we discuss some open problems that we plan to address in our future work.
7.
REFERENCES
[1] M. Ahmad and R. Guha. “Understanding the impact of Internet exchange points on Internet topology and routing performance”. InProceedings ACM CoNEXT Student Workshop 2010.
[2] B. Augustin, B. Krishnamurthy, W. Willinger. “IXPs: Mapped?”. In Proceedings of ACM SIGCOMM 2009. [3] J. C. Cardona Restrepo, R. Stanojevic. “A history of an
internet exchange point”. ACM CCR, vol. 42(2) 2012. [4] CESNET, Traffic Stats.http://www.ces.net/netreport/. [5] H. Chang, S. Jamin, Z. Mao, and W. Willinger. “An
empirical approach to modeling inter-AS traffic matrices”. InProceedings IMC 2005.
[6] K. Cho, K. Fukuda, H. Esaki, A. Kato. “The Impact and Implications of the Growth in Residential User-to-User Traffic”. In Proceedings of ACM SIGCOMM 2006. [7] Cisco Systems. “Cisco Visual Networking Index: Forecast
and Methodology”. Cisco White Paper, 2008.
[8] CISCO. (2009) “The value of peering”. ISP/IXP Workshop. CISCO. [Online]. Available:
http://www.pacnog.net/pacnog6/IXP/IXP-peering.pdf [9] A. Dhamdhere, C. Dovrolis. “The Internet is Flat:
Modeling the Transition from a Hierarchy to a Peering Mesh”. In Proceedings of ACM CoNEXT 2010.
Proceedings of ITC 2010.
[11] X. Dimitropoulos, P. Hurley, A. Kind, M. Stoecklin. “On the 95-Percentile Billing Method”. In Proceedings of PAM 2009.
[12] V. Erramilli, M. Crovella, N. Taft. “An
independent-connection model for traffic matrices”. In Proceedings of ACM IMC 2006.
[13] European Internet Exchange Association, www.euro-ix.net.
[14] A. Feldmann et al. “Anatomy of a Large European IXP”. In Proc. of ACM SIGCOMM 2012.
[15] E. Gregori, A. Improta, L. Lenzini, and C. Orsini. “The impact of IXPs on the AS-level topology structure of the Internet”.Computer Communications, 2010.
[16] Y. He, G. Siganos, M. Faloutsos, and S. Krishnamurthy. Lord of the links: a framework for discovering missing links in the internet topology.IEEE/ACM Transactions on Networking (TON), 17(2):391–404, 2009.
[17] C. Labovitz, S. Iekel-Johnson, D. McPherson, J.
Oberheide, F. Jahanian. “Internet Inter-domain Traffic”. In Proceedings of ACM SIGCOMM 2010.
[18] N. Laoutaris, G. Smaragdakis, P. Rodriguez, R. Sundaram. “Delay Tolerant Bulk Data Transfers on the Internet”. In
Proceedings of ACM SIGMETRICS 2009.
[19] MIX. Peering prices at MIX, March 2008. [Online]. Available:
http://replay.web.archive.org/20080415151545/http: //www.mix-it.net/costi-2007.htm
[20] T. Oetiker, The Multi Router Traffic Grapher. http://oss.oetiker.ch/mrtg/.
[21] Oliveira, R. and Pei, D. and Willinger, W. and Zhang, B. and Zhang, L., The (in) completeness of the observed internet AS-level structure.IEEE/ACM Transactions on Networking (ToN). 2010..
[22] PeeringDB. Website. [Online]. Available: http://www.peeringdb.com/
[23] SANET, Traffic Stats.http://samon.cvt.stuba.sk/. [24] Y. Shavitt and E. Shir. “DIMES: Let the internet measure
itself”.ACM SIGCOMM Computer Communication Review, vol. 35, no. 5, pp. 71–74, 2005.
[25] SIX. [Online]. Available: http://www.six.sk/ [26] Skitter project. [Online]. Available:
http://www.caida.org/tools/measurement/skitter/ [27] R. Stanojevic, N. Laoutaris, P. Rodriguez. “On Economic
Heavy Hitters: Shapley Value Analysis of the
95th-Percentile Pricing”. In Proceedings of ACM IMC 2010. [28] K. Xu, Z. Duan, Z. Zhang, and J. Chandrashekar. On
properties of internet exchange points and their impact on as topology and relationship.NETWORKING 2004, Networking Technologies, Services, and Protocols; Performance of Computer and Communication Networks; Mobile and Wireless Communications, pages 284–295, 2004.
[29] Y. Zhang, M. Roughan, N. Duffield, and A. Greenberg. “Fast accurate computation of large-scale IP traffic
matrices from link loads”. InProceedings of ACM SIGMETRICS 2003.