Themed Section : Engineering and Technology DOI : https://doi.org/10.32628/IJSRSET11841126
Effects of Process Parameters on Surface Roughness and MRR in
the hard turning of EN 36 steel
Amritpal Singh1, Dr. Rakesh Kumar21M.Tech Student, IKGPTU, Kapurthala, Department of Mechanical Engineering, North West Group of
Institutions, Dhudike, Moga, Punjab, India
2Department of Mechanical Engineering, North West Group of Institutions, Moga, Punjab, India
ABSTRACT
In the present study, Experimental investigation of the effects of various cutting parameters on the response parameters in the hard turning of EN36 steel under the dry cutting condition is done. The input control parameters selected for the present work was the cutting speed, feed and depth of cut. The objective of the present work is to minimize the surface roughness to obtain better surface finish and maximization of material removal rate for better productivity. The design of experiments was done with the help of Taguchi L9 orthogonal array. Analysis of variance (ANOVA) was used to find out the significance of the input parameters on the response parameters. Percentage contribution for each control parameter was calculated using ANOVA with 95 % confidence value. From results, it was observed that feed is the most significant factor for surface roughness and the depth of cut is the most significant control parameter for Material removal rate.
Keywords : Hard turning, EN36, Surface roughness, Material removal rate, HRC
I. INTRODUCTION
In modern machining industries, the main challenge emerging is the achievement of high product quality, in terms of dimensional accuracy, surface finish, and high production rate and cost effectiveness. Metal cutting is still leading process in part manufacturing and it is predicted to remain so in the future. Thus, recent research in manufacturing technology has been mainly focused on increasing efficiency by utilizing the available resources completely (Karpat, 2007) Traditionally hardened steels have been machined by grinding process, on the other hand, grinding process is time-consuming and it applicable to a limited range of the geometries. Hard turning is basically a turning process suitable for machining parts with the hardness exceeding 45 HRC which provides similar surface finish and the dimensional
given to the tool. In hard turning process although the initial setup is similar to that of soft turning but boundary conditions are different such as work piece hardness. Work piece hardness ranges from approximately 45-70 HRC. The main cutting parameters in hard turning process are cutting speed, depth of cut and feed rate. The Turning of the extra hard materials was made possible through the invention of the advanced cutting tools having high toughness, high-temperature conductivity and abrasion resistance. Commonly the hard turned materials are tool steel, hot die steel, bearing steel and case hardened steels. The development of tool materials like cubic boron nitride (CBN), polycrystalline boron nitride (PcBN), cermets and ceramics made it possible to machine hard materials with close dimensional tolerance to those achievable in grinding. Tool material selection is vital for process efficiency and affects the part dimensional accuracy and surface finish.
Literature Review
Salvi et al. [2013] carried out the experiment to analyze the optimum cutting conditions to get the lowest surface roughness in turning of 20MnCr5 case hardening steel of hardness46 HRC. Ceramic based insert was used in finish turning. Taguchi L9
orthogonal array was used in design of experiments and analysis of variance was used to determine the significance of cutting parameters. It is observed that surface roughness is improves when the cutting speed is increased and value of surface roughness increases with increase in feed rate. Surface roughness value of Ra=0.91 µm was observed at the cutting parameters of
feed f=0.15 mm/rev, cutting speed V= 232.5 m/min and depth of cut ap= 0.4 mm. It is concluded that ceramic based inserts can be effectively as an alternative to the polycrystalline cubic boron nitride (PCBN) inserts.
Suresh et al. [2014] studied the effect of various cutting parameters in hard turning of the AISI H13
steel at 55 HRC with Physical vapour deposit (PVD) coated TiCN ceramic tool under dry cutting conditions. They used Central composition design concept of Response surface methodology for design of experiments and ANOVA was used to find the most significant parameters. They concluded that abrasion was the principal wear mechanism observed at higher cutting speed and feed rate was the most influential parameter. Developed Response surface methodology model has 95% confidence value and can be used to tool wear and surface roughness. The cutting speed has most significant effect at 47.4 % on the tool wear rate followed by feed ate at 28.15 % and depth of cut a 15.8 %. Increase cutting speed results in the increased temperature at contact zone which leads to the high tool wear. Feed rate at 49.55 % value was found to be most influencing factor on surface roughness followed by cutting speed at 40.3 % and depth of cut at 8.8 %. Surface finish increase with increase in cutting speed and decrease with increase in feed rate.
Sahoo et al. [2014] studied the performance of multilayer carbide insert in the machining of AISI D2 steel at 53 HRC using Taguchi L27 orthogonal array to predict surface roughness also S/N ratio and optimum parametric condition were analyzed. To observe the experimental data a multiple linear regression model for surface roughness was developed. He found that feed is most influencing parameter for surface roughness followed by cutting speed. Low surface roughness was observed at high cuttings speeds as the chip-tool contact length decrease at high speeds. The depth of cut has the least significance on surface response.
of experiments and a regression model was developed for surface roughness. They concluded that higher the work material hardness the higher is the machining force. Feed rate and depth of cut have high influence on surface roughness and cutting parameters. Feed rate is the main contributing factor in surface roughness at 77.92 % followed by cutting speed at 15.47 %. It is found out that for turning of AISI 4140 steel optimal cutting parameters are cutting speed of 180 m/min, feed rate of 0.08 mm/rev, cut of depth of 0.15
mm and gives surface roughness of Ra= 0.23 micron.
Lawrence et al. [2015] predicted the effects of machining parameters such as feed rate, cutting speed, depth of cut on surface roughness and material removal rate in hard turning of EN36 steel. They use Taguchi L9 orthogonal array for the design of experiments and used Grey relational analysis and response surface methodology to study the effects of parameters. They found that feed rate is the most influencing factor followed by cutting speed. The optimum machining parameters are cutting speed of 650 rpm, feed rate of 0.2 mm/rev and depth of cut of 0.4 mm.
Rashid et al. [2015] investigated the effects of machining conditions and parameters on the surface roughness of AISI 4340 steel at 69 HRC. Taguchi L16
orthogonal arrays was used for the design of experiment and a multiple regression model was developed to check the effectiveness of the experiment. Taguchi based S/N ratio and analysis of variance were applied to machining data to find the most significant parameter. They concluded that cubic boron nitride based cutting tool can produce a desirable surface finish without any additional means for a work piece as hard as 69 HRC. The optimum cutting parameters obtained from experiment are feed rate of 0.02 mm/rev, cutting speed of 250 m/min and depth of cut of 0.3 mm. It is also revealed that a very low feed rate is the most significant (99.16%) factor influencing the surface roughness.
Aouici et al. [2016] studied the comparison of surface roughness between ceramics and CBN inserts in hard turning of AISI H11 hot work steel at 50 HRC. Taguchi L18 orthogonal array was used in design of
experiments and Response surface methodology based mathematical models were developed to analyze the effects of cutting speed, feed rate and depth of cut on surface roughness of work piece. Three different types of inserts namely reinforced ceramic insert (CC670), mixed ceramic insert (CC650) and a Cubic boron nitride insert (CBN7020) was used in experiment. It is observed that feed rate is most influential in case of hard turning with ceramic insert than CBN insert and surface roughness increase with increase in cutting speed in case of ceramic inserts also CBN inserts has better performance as compared with ceramic inserts. The feed rate f =0.08 mm/rev is best suitable for obtaining better surface finish. The surface roughness value of Ra = 0.180 µm was observed on surface
machined by a CBN insert and Ra= 0.300 was observed
on a surface machined by a ceramic insert.
II. Materials and Methods
2.1 Work piece material
The work piece material used in this experiment is the Engineering series EN36 carburizing steel. EN36 is a 3% nickel-chromium based case hardening steel having a soft but strong core. It retains a remarkable degree of toughness at extreme working conditions. The en36 material is readily available in the annealed condition with hardness up to 25 HRC. The work piece is heat treated to increase its case hardness to 55 HRC.
bearing, airplane and engine crankshafts, connecting rods, gudgeon pins and gears.
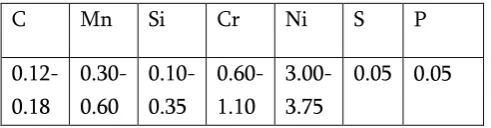
Table 1 Chemical composition of EN36 steel
C Mn Si Cr Ni S P
0.12-0.18
0.30-0.60
0.10-0.35
0.60-1.10
3.00-3.75
0.05 0.05
The cutting tool used in this experiment is a Physical vapour deposit (PVD) coated Alumina-based ceramic insert. The insert is made by KENNAMETAL and tool grade is KYON KY4400. The cutting insert is an aluminum oxide (Al2O3) and titanium carbide (TiC)
based mixed grade ceramic insert with a PVD coating of titanium nitride (TiN). The machine used to conduct the turning operation on the work piece was a Computer numeric control (CNC) lathe centre made by SANDS and model is SLT-200H. The power output of the driver motor is 14.72 kW and the maximum speed is 5000 rpm. Dry cutting conditions were used for the experimentation process. The dry cutting process is the main feature of the hard turning process as this eliminates the excessive use of the coolant.
2.2 Design of Experiment
The design of experiments is an effective tool for conducting an experiment study. This experiment is planned by using the Taguchi design of experiments. The L9 (33) orthogonal array is selected for the
experimentation. This design has a total nine degrees of freedom. The controlled variables are cutting speed, feed and depth of cut. The design of experiment with L9 orthogonal array gives nine
experiment sets with randomised values of the input parameters. The randomised experiment gives best good results with a limited number of trials. The main process parameters selected for the machining of the work piece were the cutting speed, feed rate and depth of cut. The cutting parameters and their values are carefully selected by reading previous research
work. The cutting parameters and their levels used in finish turning are given in table 2.
Table 2 Process parameters and their levels
Parameter Unit Level 1
Level 2
Level 3
Cutting speed (v)
m/min 120 140 180
Feed (f) mm/rev 0.12 0.16 0.20
Depth of cut (d)
mm 0.15 0.30 0.40
2.3 Experimental Procedure
A total nine cuts with a different parameter setting were made. In each experiment, a cut of 45 mm length was made on the work piece. In each experiment diameter of the work piece was measured before and after the turning operation. After all the experiments were completed, the work piece was removed from the setup and response variables such as surface roughness, material removal rate was measured. The main parameters used in measuring surface roughness are average arithmetic roughness (Ra) also called centre line average, root mean square
roughness (Rq) and maximum peak to valley height
(Rz). Average arithmetic roughness Ra is the most
popular parameter to measure surface roughness. In this experiment surface roughness (Ra) was measured
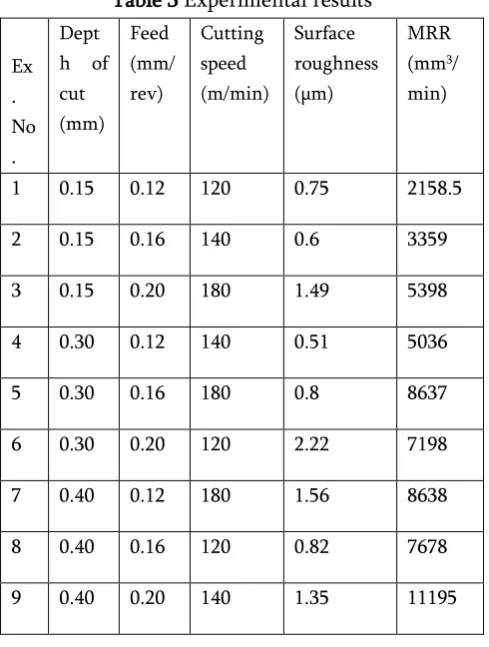
Table 3 Experimental results
Ex . No .
Dept h of cut (mm)
Feed (mm/ rev)
Cutting speed (m/min)
Surface roughness (µm)
MRR (mm3/
min)
1 0.15 0.12 120 0.75 2158.5
2 0.15 0.16 140 0.6 3359
3 0.15 0.20 180 1.49 5398
4 0.30 0.12 140 0.51 5036
5 0.30 0.16 180 0.8 8637
6 0.30 0.20 120 2.22 7198
7 0.40 0.12 180 1.56 8638
8 0.40 0.16 120 0.82 7678
9 0.40 0.20 140 1.35 11195
III.
Results and Discussion
The Surface roughness data obtained from the experiments have been analysed using Taguchi’s signal to noise ratio (S/N) method. The signal to noise ratios was calculated using the Smaller the better criterion. The smaller the better approach is selected because the objective is to minimise the surface roughness. The greater value of the S/N ratio means the value of surface roughness is lesser. Table 4 shows the experimental results of surface roughness (Ra) and
calculated signal to noise ratio.
Table 4 Results for Surface roughness and S/N ratio
Ex No .
Depth of cut (mm)
Feed (mm/re v)
Cutting speed (m/min)
Ra
(µm)
S/N ratio
1 0.15 0.12 120 0.75 2.498775
2 0.15 0.16 140 0.6 4.436975
3 0.15 0.20 180 1.49 -3.46373
4 0.30 0.12 140 0.51 5.848596
5 0.30 0.16 180 0.8 1.9382
6 0.30 0.20 120 2.22 -6.92706
7 0.40 0.12 180 1.56 -3.86249
8 0.40 0.16 120 0.82 1.723723
9 0.40 0.20 140 1.35 -2.60668
Table 5. Response table for mean S/N ratio of Ra
Table 5 shows the response table for mean Signal to noise ratio for Surface roughness. The response table represents the effects of various input factors on the Surface roughness. From Response table 5.3 it is observed that Mean S/N ratio for the Depth of cut is highest at level 1(d=0.15 mm), S/N ratio for the feed is highest at level 2 (f= 0.16 mm/rev) and S/n ratio for the cutting speed is highest at level 2 (V= 140 m/min).
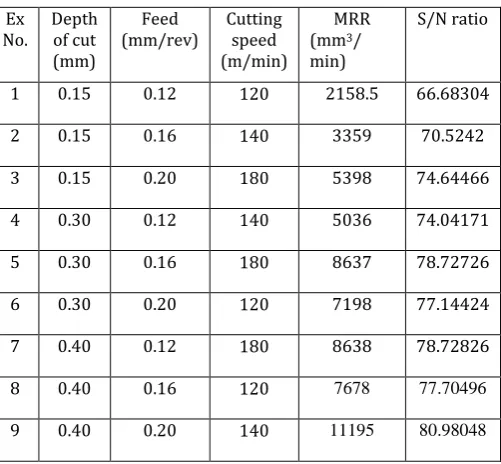
The Material removal rate data obtained from the experiments have been analysed using Taguchi’s signal to noise ratio (S/N) method. The signal to noise ratios was calculated using the larger is better criterion. The larger the better approach is selected because the objective is to maximise the material removal rate. The greater value of the S/N ratio indicates that material removal rate will be higher.
Leve
l Depth of cut Feed Cutting speed
1 1.1573 1.4950 -0.9015
2 0.2866 2.6996 2.5596
3 -1.5818 -4.3325 -1.7960
Delt
a 2.7392 7.0321 4.3556
Ran
Table 6 shows the experimental results of material removal rate and calculated signal to noise ratio.
Table 6. Results for MRR and S/N ratio
Ex
No. Depth of cut (mm)
Feed
(mm/rev) Cutting speed (m/min)
MRR (mm3/
min)
S/N ratio
1 0.15 0.12 120 2158.5 66.68304
2 0.15 0.16 140 3359 70.5242
3 0.15 0.20 180 5398 74.64466
4 0.30 0.12 140 5036 74.04171
5 0.30 0.16 180 8637 78.72726
6 0.30 0.20 120 7198 77.14424
7 0.40 0.12 180 8638 78.72826
8 0.40 0.16 120 7678 77.70496
9 0.40 0.20 140 11195 80.98048
Table 7. Response table for mean S/N ratio of MRR
Level Depth of cut Feed Cutting speed
1 70.62 73.15 73.84
2 76.64 75.65 75.18
3 79.14 77.59 77.37
Delta 8.52 4.44 3.52
Rank 1 2 3
Table 7 shows the response table for mean Signal to noise ratio for the material removal rate. From Response table 5.6, it is observed that Mean S/N ratio for the Depth of cut is highest at level 3(d=0.4 mm), S/N ratio for the feed is highest at level 3 (f= 0.2 mm/rev) and S/n ratio for the cutting speed is highest at level 3 (V= 180 m/min). From delta statics results it is clear that Depth of is the most significant factor followed by feed and depth of cut.
3.1 Main Effect Plots
The main effect plots for the Surface roughness with various process parameters has been shown in figure 1 and main effect plots for the Material removal rate with various process parameters has been shown in figure 2. Main effect plots show the relationship between the means of S/N ratio of the surface roughness and the depth of cut, feed and cutting speed. From figure 1, it is clear that the value of the S/N ratio gradually decrease with increase in depth of cut, the value of S/N ratio increases steadily up to some point with the increase in feed then decrease sharply giving longest slope and the value of the S/N ratio increase first up to some point with increase in cutting speed and then decreases gradually. From the main effect plots, it is clearly visible that Depth of cut gives gradual slopes nearly horizontal thus has no visible effect on the surface roughness.
Fig.1 Main effect plots for Surface roughness
Fig.2 Main effect plots for Material removal rate
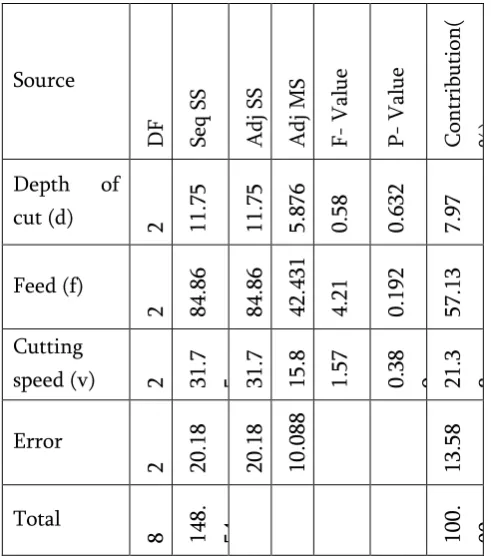
3.2 Analysis of Variance (ANOVA)
Analysis of variance (ANOVA) is a statistical technique to determine the significance of control parameter over response parameters. Table 8 shows the Analysis of variance results for the S/N ratios of surface roughness. The general linear model of the analysis of variance is used in the generation of results. From Table 8, it is observed that feed is the most significant control parameter having percentage contribution of 57.13 % followed by cutting speed having a contribution of 21.38 % and depth of cut has the least significance in turning process. The percentage error contribution of 13.58 % represents that there is some external parameter such as chattering induced by vibrations and cutting forces affecting the response parameter.
Table 8. Analysis of variance for surface roughness
Source
DF Seq
SS
A
d
j SS
A
d
j MS
F
-
V
al
ue
P
-
V
al
ue
C
ontr
ib
uti
on(
%)
Depth of
cut (d) 2 11.75 11.75 5.876 0.58 0.632 7.97
Feed (f)
2 84.86 84.86 42.431 4.21 0.192 57.13 Cutting
speed (v) 2 31.7 5 31.7 5 15.8 76 1.57 0.38 9 21.3 8
Error
2 20.18 20.18 10.088 13.58
Total
8 148. 54 100. 00
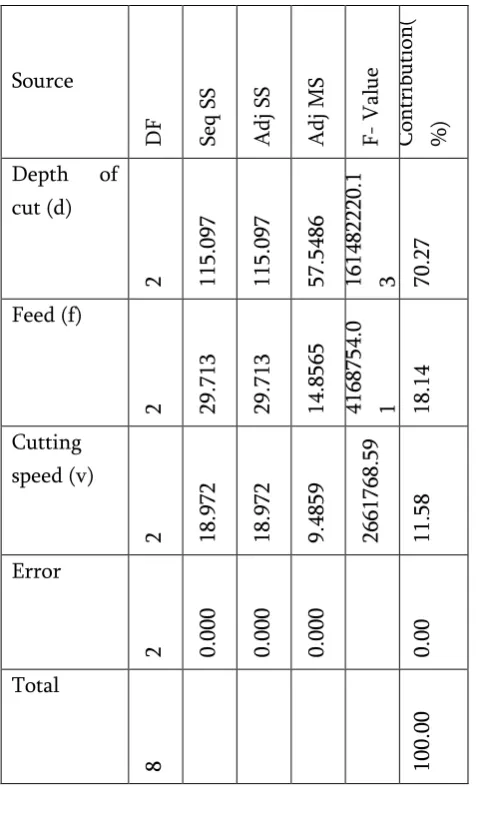
Table 9 shows the Analysis of variance results for the S/N ratios of material removal rate for 95% confidence level. The general linear model of the analysis of variance is used in the generation of results. Table 5.4 shows the value of the degree of freedom, the sum of squares, mean square, F-statics. The P-values are lower than 0.05 thus are neglected from the table. In the last column percentage contribution of each parameter is given. The depth of cut, feed, cutting speed and error parameter has two degrees of freedom respectively. The value of F statics represents the significance of the control parameter in the cutting process. The higher value of F statics means high significance of concerning parameter.
Table 9 Analysis of variance for Material removal rate
Source
DF Seq
SS
A
d
j SS
A
d
j MS
F
-
V
al
ue
C
ontr
ib
uti
on(
%)
Depth of cut (d)
2 115.097 115.097 57.5486 161482220
.1
3 70.27 Feed (f)
2 29.713 29.713 14.8565 4168754.0 1 18.14 Cutting
speed (v)
2 18.972 18.972 9.4859 2661768.5
9
11.58
Error
2 0.000 0.000 0.000 0.00
Total
8 100.00
IV.
CONCLUSION
In the present study, the analysis of the surface roughness, material removal rate and chip reduction coefficient in the hard turning of the EN36 steel with a PVD coated mixed ceramic cutting insert is presented. The following, conclusion are drawn for the effective hard turning of the EN36 steel. Taguchi’s L9 (33) orthogonal array design coupled with Analysis
of variance employed in this experimental investigation are found to be effective for the evaluation of the response parameter and their significance in the machining process
1) The optimum machining conditions for minimising surface roughness are found at cutting speed v = 140 m/min, feed f = 0.16 and
depth of cut d = 0.15. Surface roughness as low as 0.51 µm has been achieved in the experiment. 2) From Analysis of variance results, it is evident
that feed is the most important factor that helps in minimising surface roughness. Feed has the highest percentage of contribution of 57.13 % followed by cutting speed contribution of 21.38 %.
3) The optimum machining conditions for maximising material removal rate are found at cutting speed v = 140 m/min, feed f = 0.20 and depth of cut d = 0.40. The High amount of material removal rate of the 11195 mm3/min is
achieved at the high value of feed and depth of cut.
From Analysis of variance results for material removal rate, it is evident that depth of cut has the highest contribution in the maximisation of material removal rate. The percentage contribution of the depth of cut is 70.2 % followed by the feed contribution of 18.14%.
V.
REFERENCES
[1]. Ashok Kumar Sahoo, (2014), Application of taguchi regression analysis on surface roughness in machining of hardened AISI D2 steel, International Journal of Industrial Engineering, pp. 295-304.
[2]. Gaurav Bartarya, S.K Chaudhury, (2012), Effects of cutting parameters on cutting force and surface roughness during finish hard turning AISI 52100 grade steel, 5th CIRP Conference on High Performance, pp.651-656.
[3]. H Aouici, B Fnides, M Elbah, S Benlabmidi and M.A Yallese, (2016), surface roughness evaluation of various cutting materials in hard turning of H11, International Journal of Industrial Engineering Computations, pp.339-352.
methodology for predicting and optimizing surface roughness and cutting forces in hard turning by PVD coated Insert, International Journal of Industrial Engineering Computations, pp.267-284.
[5]. I.Daniel Lawrence, M.Pandiarajan, G.Kaviprakash, (2015), Prediction of machining parameters in turning on EN36, International Journal of Applied Engineering Research, ISSN: 0973-4562, vol.10, No.55, pp.4070-4075.
[6]. Mikell P. Groover, (2010), Fundamentals of modern manufacturing, 3rd ed. Wiley Asia. [7]. R.Suresh, S.Basavarajappa, (2014), Effect of
process parameters on tool wear and surface roughness during turning of hardened steel with coated ceramic tool, International Conference on Advances in Manufacturing and Material Engineering, No.5, pp. 1450-1459. [8]. S.B Salvi, R.R Deshmukh, Dr. S.D Deshmukh,
(2013) Analysis of surface roughness in hard turning by using Taguchi method, International Journal of Engineering and Technology, Vol.5, No.02, ISSN: 0975-5462, pp.365-370.
[9]. Waleed Bin Rashid, Saurav Goel, J Paulo Davim, Shrikrishna Joshi, (2015), Parametric optimization of Hard turning of AISI 4340 Stainless steel, International Journal of Manufacturing Technology.