INTRODUCTION
Body Mass Index (BMI) and cholesterol variation has remained a crucial attribute in physiology and clinical medicine and hydrodynamics. The use of BMI to normalize certain measures of biological functions in individuals of different body sizes is derived from findings that such parameter correlate better with body surface area than with any other index of body size (Luke 1989). Since Rubnner (1883) put forward his law over a century ago, it has become established that basal metabolic rate depends on the total BMI. Klieber (1975) has questioned this relationship; Durnin (1959) has suggested that Lean Body Mass (LBM) is a more appropriate preference than body surface area (Ab). Never the less, BMI has remained the popular reference for basal metabolic rate
Biosciences, Biotechnology Research Asia Vol. 4(2),521-526 (2007)
Is there a correlation between cholesterol
profile with body mass index?
J.C. IGWEH¹* and R.E. UCHEYA²
¹Department of Anatomy, ²Department of Physiology, College of Medicine University of Nigeria Enugu campus (Nigeria).
(Received: September 24, 2007; Accepted: November 08, 2007)
ABSRACT
Background and objective: it is a generally held opinion amongst medical personnel that body overweight is unhealthy; presently, the information available on the effects of Body Mass Index (BMI) and correlation with cholesterol profile, age and sex are limited. The aim of the present study is to investigate the relationship of BMI and its effect on cholesterol profile, age and sex in a Nigerian based populace. Design: a population survey study was performed on 206 outpatients visiting (UNTH) Enugu for routine test. The entire cohort comprises (103 male and 103 females) age range 20yrs-77yrs. Patients with hyperlipidemia, obesity, other chronic diseases and smokers were excluded from the study. BMI, age, and total cholesterol where measured. The correlations of height and weight, BMI with cholesterol at different ages and sex were determined. Results: it shows that for sex related differences: the variation in weight was generally not significant in males and females (p>0.05) for age related differences: variation in male weight at age range 20-45yrs was slightly greater than the males at age range 47yrs, with no significance (p>0.05). This also applies to the females at 20-45yrs and 49-77yrs. linear regression models explained up to 5.1% and 8% of BMI variability in men and women. Multiple logistic regression analysis revealed a negative statistically significant (p<0.001) effects modification involving age and BMI on the risk of having greater cholesterol storage in both male and females. We conclude that increase of BMI irrespective of age and sex may be more deleterious in population, in which it is accompanied by other risks factors such as a higher intake of total cholesterol (fat), particularly in females at older age 45-77yrs.
Key words: BMI, cholesterol, age and sex.
and weight in a Nigerian adult population, concluded that BMI (W/H2) is the most suitable index derived from height and weight for the assessment of obesity in their study population, and recommended its use in clinical practice and epidemiological studies. In 1988 the Adult treatment of the National Cholesterol education program published guidelines for recognizing and treating hypercholesterolemia in adults (Expert penal,1988); those guidelines include a definition of cholesterol and LDL-cholesterol in terms of cardiovascular risk (Igweh and Ucheya 2005). Cholesterol and LDL-cholesterol rate are now grouped in three categories :(a) acceptable risk- total cholesterol<5.195mmol/l (200mg/dl), LDL-cholesterol:<3.377mmol/l (130mg/ dl): (b) borderline high risk, in which risk is about twofold greater (total cholesterol:5.195 to 6.202mmol/l (200 to 239mg/dl), LDL-cholesterol: 3.377 to 4.130mmol/l (130 to 159mg/dl) and (c) high risk, in which risk is increased three to four fold (total cholesterol >6.234mmol/l (240mg/dl) LDL-cholesterol >4.156mmol/l (160mg/dl) (Expert panel 1988). These cutoffs were established from studies in which the accuracy of cholesterol measurement approximates those made with reference (standard) cholesterol methods. A single set of cut-offs is thus recommended to ensure uniform standard across board. It must be emphasized that these ranges are applicable in the United States. Cut-offs for Africans is somewhat different since we have a different environment, different feeding habits and different genetic make up. This is according to Luke (1989) in his detailed research work on body surface area of Afr icans: A study based on direct measurement of Nigerian males. In view of his findings, he advocated that it would be of interest to re-examine previously reported African data with respect to physiological values that are normalized with respect to surface area. Such an exercise may resolve the widely different basal metabolic rate reported for Africans (Durnin1959). He concluded that the use of our data should result in more precise determination of drug dosages for Africans. Garrett (1960) in his heavily referenced work on estimation of body surface area of extremely obesed human subjects, concluded that the remarkable changes in shape involving the trunk and the thighs of these individuals is such as to defy the accuracy of any linear formula evolved for the general population.
This present work is based on the fact that for several years research scientist have reported limited works on BMI of Africans and its relation with cardiovascular factors. Most importantly with respect to physiological values that are normalized with respect to BMI of Africans. Thirdly to determine the correlation between BMI, cholesterol, age and sex among Africans using Nigerian based populace.
MATERIAL AND METHODS
The study population was 206 normal subjects (103 males and 103 females) age range (20-76yrs). They were outpatients visiting the University of Nigeria Teaching Hospital (UNTH) Enugu for routine test.
Exclusion criteria
They were those not diagnosed with hyperlipedemia and obesity. Patients with other chronic conditions such as diabetes, alcoholism, liver and kidney diseases as well as cigarette smoking were excluded from the study. They were requested to stay off medication for five days prior to blood collection.
Measurements: (weight and height)
Body weights in light clothing were measured to the nearest 0.1kg using an electronic scale. Averages of two readings were taken. Height was measured to the nearest 0.5cm using a flexible tape, according to standardized anthropometric measurement procedures (WHO extract, 1989, WHO extract, 1995).
Body Mass Index was calculated from the formula: weight (kg)/ height (m2)
Overweight/Obessed
i BMI:25 to 29.9kg/m2 for female BMI: 37 to 30kg/ m2 for males
ii Cholesterol:
Cholesterol measurement
Enzymatic colorimetric test (chod-pap method) Summary of principles
The concentration of cholesterol is measured by hydrolyzing esters in serum into free cholesterol using cholesterol esterase. The cholesterol produce is oxidized by cholesterol oxidizes with simultaneous production of hydrogen peroxide to yield quinine amine dye with absorption maximum of 510nm. The amount of color produced is directly proportional to the total cholesterol content of the sample.
Cholesterol esters + H2O chol. Esterase cholesterol + Fatty acids
Cholesterol + H2O + O2 chol. Oxidase cholestrnona +H2O
H2O2 + 4 Aminoantipyrine + P- Hydroxybenzoic acid Peroxidase colored quininonic Derivative + 4H2O Working Reagents
The content of the buffered enzymes/ chromogen vial was deionized water to give the following concentrations:
Phosphate buffer, PH 6.7 100mm P-Hydroxybenzoic acid 15mm
4-Aminoantipyrine 0.5mm
Cholesterol Esterase >350m/l Cholesterol Oxidase >1000m/l
Surfactants 1%
Once the buffered enzyme/ chromogen vial has been dissolved, the reagent solution is stable for 90days at 2-8 oc and 30 days at room temperature (<25 oc)) when protected from light. Samples
Serum or plasma samples are suitable for 8days at 2-8 oc and up to 3months at -20 oc
Procedure Blank Sample Standard
(BK) (SA) (ST)
Sample ml ml ml
Standard - 0.02
-Working 2.00 2.00 2.00
Reagent
The tubes were well mixed and allowed to stand for 10mins at room temperature
Reading
Wave length: 546nm
The color is usually stable for 1hr when protected from sunlight.
Calculations SA O.D X 200
ST O.D = Mg of cholesterol/dl
SA = Sample ST = Standard
SI units (mg/100ml) x 0.0259 = mmol/l
SA = Sample ST = Standard
SI units (mg/100ml) x 0.0259 = mmol/l
Main Outcome Measurements:
1 Cholesterol level
2 BMI (weight(kg)/Height(m2)
Using XPSS software in Toshiba 2002 LAPTOP Data was analyzed in other to assess correlations between the attr ibutes (Body Mass Index, Cholesterol profile, age and sex).
DISCUSSION
It is a general opinion held amongst medical personnel that being overweight is unhealthy. Affected people are said to be at increased risk of cholesterol storage, high blood pressure, heart disease, stroke, diabetes among others. Even young adults are at risk of these diseases. BMI, cholesterol variation has remained a crucial attribute in physiology, clinical medicine, hydrodynamics and body modeling. However, this study has endeavored to analyze if there is any existing relationship between BMI, cholesterol profile, age and sex.
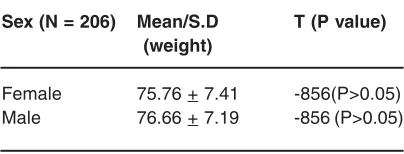
Table 1: There was no significant difference in the general mean weight of subjects between
both sexes (male and female). Sex (N = 206) Mean/S.D T (P value)
(weight)
Female 75.76 + 7.41 -856(P>0.05)
Male 76.66 + 7.19 -856 (P>0.05)
Our results suggested that for sex related differences: variations in weight were generally not significant between males and females (p>0.05), (table 1&2).
For age related differences in males at age range 20-45yrs; it was slightly greater than in males at age range 46-77yrs; though the difference statistically was of no significance (p>0.05), (Table 2), this statistical variance was also the same for females of age range 20-45yrs and 46-77yrs. Linear regression models explained up to 5.1% and 8% of BMI variability in men and women.
In accordance with a documented statement in (www.goggles.BMI calculator 1), a body mass index between 18 and 25 pounds, is considered normal, while at a BMI of 18 pounds you are at risk of being underweight or you could also be on the low end of the growth curve of your age or very athletic. Relating this to our present study, we are of the view that apparently majority of Nigerians resident within Enugu metropolis have a normal weight, and obesity is a rare occurrence. This is based on the existing data from the entire cohort studied; the lowest BMI was 18.9kg at age 36, height 1.9, weight 68kg and total cholesterol 3.8mmol/mol while highest weight was 90kg, height 1.76 at age 47 with BMI 29.1 and total cholesterol 4.5mm/mol we therefore suggest that the normalcy in weight from the cohort studied is apparently due to better standard of living and improved nourishment. Which on the other hand suggest a community possibly free of undernourishments.
BMI increased variability with age (Table 3). BMI showed significant positive correlation Table 2: There were no significant differences
in mean weight of subjects in respect to the range of subject in the male and female. Age group Mean/S>D T (P value)
(weight)
20-45yrs (males) 79.83 + 7.65 1.24(P>0.05) 46-77yrs (males) 76.86 + 5.72
20-45yrs (females) 78.64 + 8.84 0.98 (P>0.05) 46-77yrs (females) 75.30 + 6.78 0.98 (P>0.05)
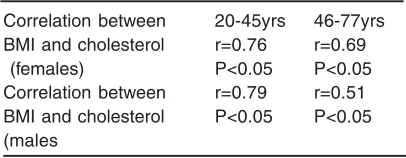
Table 4 : There was a significant correlation between BMI and cholesterol in respect of the age range of both subjects (male and female). Also from the table the correlation of BMI and the cholesterol in females were higher than
that of the males in respect of their age range.
Correlation between 20-45yrs 46-77yrs
BMI and cholesterol r=0.76 r=0.69
(females) P<0.05 P<0.05
Correlation between r=0.79 r=0.51
BMI and cholesterol P<0.05 P<0.05 (males
r= correlation
Table 3 : There was a difference in mean variation in the increase of BMI in respect to
the age range of subjects in the male and female.
Age group Mean/S.D Mean/S.D
(Age) (BMI)
20-45yrs (males) 37.17 +6.2 29.77 + 2.6 46-77yrs (males) 52.86 +6.9 26.88 +3.7 20-45yrs (females) 37.67 + 5.22 28.12 + 2.05 46-77yrs (females) 54.84 + 7.02 25.85 + 1.39
with cholesterol and a variable significant correlation with age and sex (Table 4). Multiple logistic regression analysis revealed a negative statistically significant (p<0.001) effect modification involving age and BMI on the r isk of having greater cholesterol storage in both males and females. This result is in conformity with a report cited, (Gostynski et al 2004).
The variability of correlation between BMI, age, sex and cholesterol at age range (20-45yrs) was the same (table 5&6). However, this might be due to the fact that populations within this range participate more in physical activity and this habit apparently reduces their BMI accompanied by reduction of other cardiovascular risk factors such as cholesterol profile (Joseph 1961).
females at age range 46-77yrs (table 4). We are of the opinion that women at this age range 46-77yrs might be more predisposed to cardiovascular risk diseases induced by cholesterol build up (table 4). This is contra to documented report by (Gostynski 2004) that the strongest effect of hypercholeste-rolemia has been found in subjects aged 25-39yrs.
Table 5: The variability of correlation between the age range in female subjects where the same. That is there where no significant differences in the correlation of
BMI and cholesterol in respect to their age range in the female subjects Age females Total cholesterol
between 20-45yrs females between 20-45yrs
BMI females R .711 (**) .881(*)
between 20-45yrs P value P<0.05 P<0.05
N 52 52
* = significant r=correlation
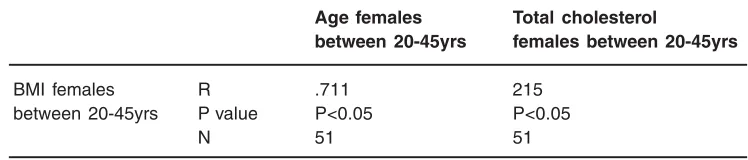
Table 6: The variability of correlation between the age ranges in the male subject was the same. That is they were no significant differences in the correlation in the
BMI and cholesterol in respect of their range in the male subjects. Age females Total cholesterol
between 20-45yrs females between 20-45yrs
BMI females R .711 215
between 20-45yrs P value P<0.05 P<0.05
N 51 51
r=correlation
We conclude that increases of BMI irrespective of age and sex may be more deleterious in population in which it is accompanied by other risk factors such as intake of total fat (total cholesterol) and, particularly in females at older age 46-77yrs.
REFERENCES
1. Durnin JV., The use of surface area and body weight as standards of reference in studies on human energy expenditure. Br Nutr. Br J Nutr., 13(1): 68-71 (1959).
2. Expert panel on detection, Evaluation and treatment of high blood cholesterol in adults. Report of the National Cholesterol Education Program Exper t panel on detection, evaluation and treatment of high blood cholesterol in adults. Arch. Intern. Med., 148: 36-40 (1988) .
3. Flagal KM, Troiano RP, Pamak ER,
Kuezmarski RJ, Campball SM. The influence of smoking cassation on the prevalence of overweight in the United States. N Engl J Med., 2:333 (18): 1214-6 (1995).
4. Garrett EA., Estimation of Body Surface Area of extremely obessed Human subjects. Br J Nutr., 13(1): 68-71(1960).
cholesterol, age, BMI among males and females in the WHO MONICA project, 28: 1082-1090 (2004).
6. Heisner AA., Mathematical expression of effects of changes in body size on pulmonary function and structure. Am Rev Respir., 128(2pt 2): 572-4 (1983).
7. Khuri EM, Gregg DE, Rayford CR., effect of exercise on cardiac output, left coronary flow and myocardial metabolism in the anaesthetized dog., 17(5): 427-37 (1965). 8. Igweh JC, Ucheya RE., Hypertension and
Age as compelling factors in plasma cholesterol variation. J. Biomed. Africa, 3(2): 6-11 (2005).
9. Joseph L., Man and Leisure: A Philosophy of Recreation, Prentice Hall, Inc. Englewood Cliff. NJ., (1961).
10. Pinkel D: The use of body surface area as a criterion of drug dosage in cancer
chemot-herapy. Cancer Res., 48(1): 7-14 (1958). 11. Rubner D., in Gunther B, Varges V. 1996:
Surface law and algometric analysis of functions. Rev Med Chil., 124(10): 1261-72 (1883).
12. Nwoye LO., Body Surface area of Africans: a study based on direct measurement on Nigerian males. Hum Biol., 61(3): 439-67 (1980).
13. Nwoye LO. Al-sheri MA., The body Surface area of Saudi new born. J Egypt Public Health Assoc. 80 (1-2): 152-68 (2005).
14. Nwoye LO. Al-sheri MA., A formula for the estimation of the body surface area of Saudi male adult. Saudi Med. J., 24(12): 1341-6 (2003).