1
The Effects of an Assisted Jump
Training Stimulus on Explosive
Performance.
Paul Croucher (BSpExSc)
Centre for Sport and Exercise Science
Wintec (Hamilton, New Zealand)
A thesis submitted in fulfilment of the requirements for the Master of Sport and Exercise Science
2
Acknowledgements
Where to start, to my wife, father in law, and sons, without their understanding, support, and patience I would not have been able to study, let alone complete this project, I thank you.
To my supervisor, Dr Nicholas Gill, thank you for your patience also over the past two years, you have steered me through many rough patches and kept my going when I was ready to throw in the towel. Your experience, knowledge, and guidance have been vital to the success of this project. Thanks heaps Gilly.
To Christos Argos, thank you for your support and ideas throughout this project, also for your assistance when Gilly was ‘AWOL’.
To the fantastic team at WINTEC lead by Denise Harnett, thank you for moving any and all obstacles that presented themselves over the past few years. Without the support of you and your team this project would have been buried long ago. I also wish to thank and acknowledge the financial support given to myself to make it possible to complete this thesis.
Thank you to Jim Patchett for the loan of the harnesses and karabiners, without it this project wouldn’t have got off the ground.
To my fellow postgraduate students, in particular Frans Van Der Mere and Caleb Dobbs, thank you for listening to my rants and raves when things were looking bleak. Your regular ‘insults and heckling’ picked me up when I needed it.
3 To Professor Will Hopkins, thank you for your statistical genius and being able to explain things so simply albeit complicated.
Blair Crewther, without your ideas, comments, and assistance during the writing-up of this thesis, I wouldn’t have got as far as I did. For this I am greatly appreciative and grateful, thank you.
Finally, to the most important people, I want to thank my awesome subjects. Without you I would not have been able to finish. You guys went through a lot of pain and discomfort but still turned up day after day for more.
4
Declaration
I certify that the content of this thesis has not already been submitted for any other qualification or award and is not currently being submitted for any other qualification or award. I also certify that the experimental work, results, analyses, and conclusions reported in this thesis are entirely of my own effort except were otherwise acknowledged.
5
Abstract
6
Contents
List of Figures ... 8
List of Tables ... 9
Background Literature ... 10
Mechanisms for Strength and Power Adaptation ... 10
Neural Mechanisms ... 11
Intra-Muscular Mechanisms ... 11
Motor unit recruitment ... 11
Motor unit firing frequency ... 13
Synchronization ... 15
Inter-Muscular Mechanisms ... 16
Antagonist and Agonist Interactions ... 16
Morphological Mechanisms ... 18
Hypertrophy ... 18
Hyperplasia ... 19
Muscle Geometry ... 20
Fibre Type Conversion ... 22
Summary ... 23
Training Protocols that Contribute to Lower Body Explosiveness ... 24
Single Focus Training Protocols ... 24
Slow Movement Velocity Training Protocols ... 24
Plyometric Training Protocols ... 29
Dynamic Training Protocols ... 34
Over-Speed Training Protocols ... 37
Mixed Methods Training Protocols ... 40
Summary ... 44
Introduction ... 46
Methods ... 49
Design ... 49
7
Training Protocols ... 51
Strength Training Protocol ... 51
Interventions ... 54
Plyometric Group Training ... 54
Assisted Group Training ... 55
Testing Procedures ... 56
Vertical Jump Test ... 56
Sprint Test Procedures ... 57
3RM Squat Test ... 57
Data Analysis ... 58
Statistical Analysis ... 59
Results 62
Training Protocols ... 62
Vertical Jump ... 62
Kinetic Variables ... 64
Sprint Performance ... 70
1RM Squat Strength ... 71
Relationships between Variables ... 73
Summary ... 73
Discussion... 75
Summary ... 75
Limitations... 81
Practical Applications ... 82
Future Directions ... 82
Conclusion ... 83
References ... 84
8
List of Figures
Figure 1:Research design in chronological order outlining testing, baseline and intervention phases. ... 49 Figure 2: Mean (±SD) vertical jump performance of recreationally trained subjects before
(pre-2) and after (post) four weeks of either a strength and vertical jump (SVJ) or a strength and assisted vertical jump (SAJ) training intervention. ... 64 Figure 3: Percentage change (%) in jump height following four weeks of either a strength and vertical jump (SVJ) or strength and assisted vertical jump (SAJ) training protocol intervention in recreationally trained subjects with fitted trend lines. ... 64 Figure 4: Percentage change (%) in peak force following four weeks of either a strength and vertical jump (SVJ) or strength and assisted vertical jump (SAJ) training protocol intervention in recreationally trained subjects with fitted regression lines. ... 68 Figure 5: Percentage change (%) in mean force following four weeks of either a strength and vertical jump (SVJ) or strength and assisted vertical jump (SAJ) training protocol intervention in recreationally trained subjects with fitted trend lines. ... 68 Figure 6: Percentage change (%) in relative maximum force (Rel) following four weeks of
either a strength and vertical jump (SVJ) or strength and assisted vertical jump (SAJ) training protocol intervention in recreationally trained subjects with fitted trend lines. ... 69 Figure 7: Percentage change (%) in peak power following four weeks of either a strength and vertical jump (SVJ) or strength and assisted vertical jump (SAJ) training protocol intervention in recreationally trained subjects with fitted regression lines. ... 69 Figure 8: Percentage change (%) in maximum rate of force development (mRFD) following
four weeks of either a strength and vertical jump (SVJ) or strength and assisted vertical jump (SAJ) training protocol intervention in recreationally trained subjects with fitted regression lines... 70 Figure 9: Mean (± SD) 10 and 20m sprint times of recreationally trained subjects before
(pre-1) and after (post) four weeks of either a strength and vertical jump (SVJ) or a strength and assisted vertical jump (SAJ) training intervention. ... 71 Figure 10: Mean (±SD) predicted 1RM squat strength of recreationally trained subjects
9
List of Tables
Table 1: Maximal strength training protocols and their influence on lower body
explosiveness. ... 26
Table 2: Plyometric training protocols and their influence on lower body explosiveness. ... 32
Table 3: Dynamic training protocols and their influence on lower body explosiveness. ... 36
Table 4: Over-speed training protocols and their influence on lower body explosiveness. ... 39
Table 5: Mixed method training protocols and their influence on lower body explosiveness. 42 Table 6: Characteristics of subjects (means ± SD)... 50
Table 7: Training exercises, intensities and rest for the two protocols over each of the seven week periods. ... 54
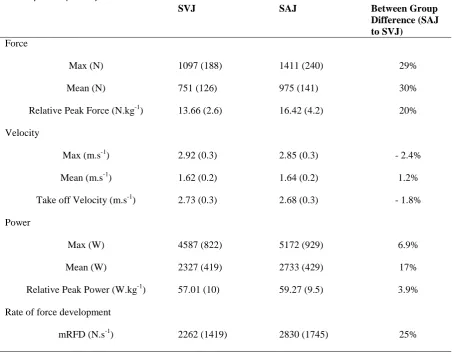
Table 8: Baseline (pre – 2) performance (mean ± SD) (pre-2) and differences between the strength and vertical jump (SVJ) or strength and assisted vertical jump (SAJ), of peak (Max), mean, and relative peak force and power, peak, average, and take off velocity, and maximal rate of force development (mRFD). ... 65
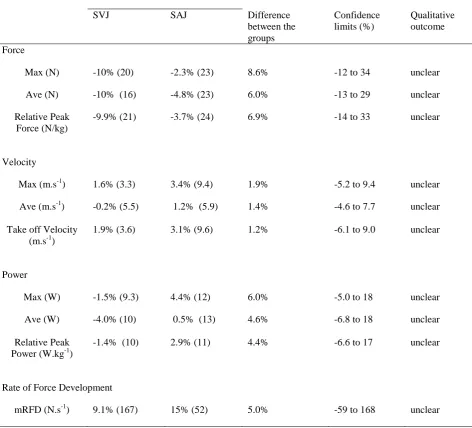
Table 9: Changes within the mean, difference between the groups, confidence limits, and qualitative outcomes between the strength and vertical jump (SVJ) and strength and assisted vertical jump (SAJ) training groups in various kinetic variables. ... 66
10
Background Literature
Mechanisms for Strength and Power
Adaptation
11
Neural Mechanisms
The responses of skeletal muscle tissue to resistance training are said to be a major adaptation. However it is not only the size or structure of the muscle that dictates voluntary muscular performance but also the degree to which the muscle can be activated (Sale, 1988). It is commonly known that the nervous system responds favorably to increased physical activity and training by altering the properties of this system, commonly referred to as neural adaptations (Gardiner, Dai, & Heckman, 2006). Neural adaptations are thought to play a major role in the early stages of resistance training (Gabriel, Kamen, & Frost, 2006). This is mainly due to large observed increases in muscular strength without similar increases in muscle hypertrophy (Komi, Viitisalo, Rauramaa, & Vihko, 1978). The term neural adaptation is a rather broad term and could refer to changes in electromyographic (EMG) activity, reflex potentiation, altered co-contractions of antagonists and synergists (Behm, 1995). Possible mechanisms to explain these adaptations will be discussed further under two headings, intra- and inter- muscular mechanisms.
Intra-Muscular Mechanisms
Motor unit recruitment
12 using the interpolation twitch technique (Belanger & McComas, 1981; Pensini, Martin, & Maffiuletti, 2002). In addition motor units are recruited from smaller to larger units depending on the load or resistance acting on a muscle. This idea has been referred to as the “size principle” by Henneman and colleagues (1965).
It is commonly believed that resistance training can improve motor unit activation. However researchers investigating this idea have found contradictory results. Some reported increases in both maximal voluntary contraction (MVC) and motor unit activation (Del Balso & Cafarelli, 2007; Higbie, Cureton, Warren III, & Prior, 1996; Pensini et al., 2002), while others have found increases in MVC with no differences in motor unit activation after training (Rich & Cafarelli, 2000; Van Cutsem, Duchateau, & Hainaut, 1998). For example the improved motor unit activation reported by Del Balso and Cafarelli (2007) was disproportionate to the increases in MVC, 2.8 ± 0.1% and 20.0 ± 13.9% respectively after four weeks of isometric training. Rich and Cafarelli (2000) also found no change in motor unit activation with a 36% increase in MVC.
13 dependent on both tension levels and the type of muscular actions in the human knee-extensor muscle group.
It is well recognised that younger and older adults differ in terms of their physical performance, e.g. strength, speed, power etc. Interestingly, there is little difference in motor unit activation between the two populations (Connelly, Rice, Roos, & Vandervoot, 1999). In fact, older trained men (82 year average) were found to activate 99.1% and younger trained men (20.8 year average) activated 99.3% of their motor units. Furthermore, the maximal voluntary contractions (MVC) in these older subjects were 26% lower than their younger counterparts. Knight and Kamen (2008) investigated the relationships between factors of muscular strength generation, muscle activation and firing rates, and found significant correlations between activation and firing rates. Moreover these researchers found a weak correlation between strength and muscle activation.
These data show that although resistance training can improve force output, the changes in motor unit activation can only account for a small fraction of the increase in maximal force. Concurrent increases in force and EMG amplitude may also be caused by changes in motor unit firing patterns. Thus suggesting other neural mechanisms are, in part, responsible for increases in force following resistance exercise.
Motor unit firing frequency
14 focused on the adaptive properties of motor units to change their firing rate patterns over time from resistance training (Van Cutsem, Duchateau, & Hainault, 1998; Rich & Cafarelli, 2000; Kamen & Knight, 2004; Pucci, Griffin, Cafarelli, 2005).
Of the four training studies found, researchers of two studies found positive benefits towards improved motor unit firing rates (Van Cutsem et al., 1998; Kamen & Knight, 2004). These authors found improvements in motor unit firing rates with improved MVC. Although Pucci and colleagues (2005) did not find significant differences before and after training, they did note a trend towards improved firing rates at the end of training. Rich and Cafarelli (2000) found contrasting results and found slight decreases in firing rates on the completion of their training.
Interestingly the two studies that found no significant improvements (Pucci et al., 2005; Rich and Cafarelli, 2000) used isometric muscle contractions. Conversely Van Cutsem and colleagues (1998) and Kamen and Knight (2004), used dynamic contractions and found significant improvements in motor unit firing rates. Moreover, older subjects increased their motor unit firing rates by 49% compared to 15% in younger subjects, with 36% and 29% increases in MVC, respectively (Kamen & Knight, 2004). These data suggests that in order to improve maximal motor unit firing rates dynamic (eccentric and/or concentric) resistance exercise should be prescribed and not isometric.
15 Doublets are particularly prevalent at the onset of muscular contraction (Van Cutsem et al., 1998) and during lower contractual efforts, i.e. <50% MVC (Christie & Kamen, 2006); and that trained subjects have a greater proportion of doublets occurring compared to untrained subjects. For example, Van Cutsem and colleagues (1998) found the incidence of doublet firing changed from 5.2 to 32.7% after 12-weeks of dynamic resistance training with a 30.2% improvement of MVC. There were also concurrent significant improvements in time to peak tension (15.9% decrease) and the rate of tension development (82.3% increase). No significant improvements were found in the control subjects. The firing of doublets at the onset of contraction may serve to enhance the initial generation of force by taking advantage of the catch-like property (tension enhancement produced when an initial brief high-frequency burst of pulses (2-4 pulses) is used at the onset of a subsequent subtetanic constant-frequency trains to activate the muscle) of skeletal muscle (Burke, 1970), which could increase the rate of force development.
This data suggests that doublet activity could potentially aid in the development of force and power. However, the increases in doublet discharge were also accompanied by changes in other neural mechanisms e.g. motor unit firing frequency that could explain some of these improvements. Due to a dearth in the literature regarding the benefits of resistance training on doublet activity, further research is warranted.
Synchronization
16 (Semmler, Steege, Kornatz, & Enoka, 2000). Among the first to establish a link between resistance training and increased motor unit synchronization was Milner-Brown, Stien, and Lee (1975). They reported a greater degree of motor unit synchronization in strength trained subjects when compared to a control group thereby leading to the idea that motor unit synchronization may be enhanced by resistance training and moreover play a role in increasing force output.
Motor unit synchronization has been observed during various types of contractions (Semmler, Kornatz, Dinenno, Shi Zhou, & Enoka, 2002; Datta & Stephens, 1990) and in younger and older persons (Semmler et al., 2000). The data presented by these authors have shown greater motor unit synchronization during lengthening (eccentric) contractions (Semmler et al., 2002) and within motor units with lower recruitment thresholds, < 0.5 N or > 1 N (Datta & Stephens, 1990). Synchronization of motor units has been demonstrated not to be different in the aged and young (Semmler et al., 2000). These authors found similar synchronization between young and older men with a significant difference of MVC, 50.3 and 33.3 N respectively. Strength training has shown to improve motor unit synchronisation (Milner-Brown et al., 1975; Semmler & Nordstrom, 1998). For example Milner–Brown and colleagues (1975) have demonstrated that a 6-week resistance training programme can lead to significantly enhanced motor unit synchronization.
Inter-Muscular Mechanisms
Antagonist and Agonist Interactions
17 antagonists (Gabriel et al., 2006). Co-contraction occurs when both the agonist and antagonist muscles contract during an intended contraction. This co-contraction increases joint stability and stiffness (Kellis, 1998) and acts as a “brake” during fast ballistic type contractions (Marsden, Obeso, & Rothwell, 1983). The “braking” mechanism allows the antagonist to oppose the agonist therefore reducing the force potential of the agonist (Gabriel et al., 2006). In addition, any inhibition of the antagonist activation during fast explosive muscular contractions would theoretically increase the agonists force potential.
18
Morphological Mechanisms
Hypertrophy
For the cellular re-organisation of skeletal muscle, exercise is one of the most powerful stimuli for inducing changes; in particular skeletal muscle responds to resistance exercise by means of muscular hypertrophy (Cameron-Smith, 2002). It is acknowledged that morphological adaptation can account for increases in strength and power with resistance training lasting 12 weeks or more (Staron, Karapondo, Kraemer, et al, 1994). However more recent findings of Seynnes, Boer, and Narici (2007) and Blazevich, Gill, Bronks, and Newton (2003) have found significant growth of muscle fibres in as little as three and five weeks respectively. For example Seynnes and colleagues (2007) found significant increases in the quadriceps femoris muscle of 3.5 and 5.2% (at central and distal locations respectively) in as little as 20 days of high intensity leg extension and also after 35 days (6.5 and 7.4% respectively). These new findings suggest that muscle hypertrophy may contribute to strength and power output much sooner than previously thought. The intriguing findings of these studies may have been due to enhanced techniques/equipment available nowadays e.g., high definition sonagraphs and magnetic resonance imagery, compared with much earlier techniques, making it easier to map smaller changes more precisely. Hypertrophic changes within muscle is now thought to be a gradual/progressive process beginning in the early phases of the training period rather than a increase in CSA after a given time during the training period (Seynnes et al., 2007).
19 so than the slow twitch, 12.5% (type I) fibres (Campos, Luecke, Wendeln, et al., 2002). The greater increases of fibre size of the fast twitch fibres are thought to be from greater relative involvement during high explosive or maximal effort exercise compared to the type I fibres (Adams et al, 1993). Moreover fast twitch fibres are recruited predominately (type IIb, IIab, IIa to type I) during explosive resistance exercise (Harris & Dudley, 2000) and therefore undergo more stress and damage requiring more remodeling and subsequently a greater capacity to adapt compared to slow twitch (type I) fibres.
Hyperplasia
Hyperplasia is a term used to describe the increases in muscle CSA by way of increasing the number of individual muscle fibres as opposed to hypertrophy that increases the size of the individual fibres (Folland & Williams, 2007). Hyperplasia has been documented in animals, and significant increases of ~19% in the number of muscle fibres have been reported (Gonyea, Ericson, and Bonde-Petersen, 1977). However, due to the many ethical and methodological issues trying to assess the amount of fibres in vivo, evidence of human muscle fibre hyperplasia are limited to cadaver studies (Folland & Williams, 2007). Researchers do acknowledge the process of hyperplasia occurring within human muscle fibres albeit at a much slower rate than hypertrophy and thus accounts for minor improvements in either strength or power (Appell, 1990; Sjostrom, Lexell, Eriksson, & Taylor, 1991).
20 hyperplasia to be caused by the branching and splitting/tearing within the sarcomere due to excess tension developed during muscular contraction. Once one Z disc has ruptured the next Z disc in line has greater stress placed upon it which could cause a sort of domino effect of additional splitting of neighboring z disks. Indeed, the rupturing of many Z discs in a sequential manner has shown to cause longitudinal tearing of the muscle fibre. For example, Patterson & Goldspink (1976) found the splitting of muscle fibres occurred at a critical size, approximately 1.1 – 1.2 µm for white fibres and 1.2 – 1.4 µm for red fibres of fish muscle. Patterson & Goldspink (1976) also observed that when a fibre splits the two daughter parts, when combined, ware larger in size than the initial parent leading to their conclusion that additional muscle filaments were added to the daughter regions while the splitting of the fibre is occurring. The addition of filaments could then increase the ability of the muscle to improve strength and power output.
Muscle Geometry
Muscle pennation angle is a term used to describe the angle of which the individual muscle fibres are arranged within the muscle, specifically the angle of the fibre to the tendon or aponeurosis (Kawakami, Ichinose, Kubo, et al., 2000). The angle of pennation and the length of the muscle fascicle (architectural arrangement) within a muscle has shown to affect the amount of force the muscle can produce (Blazevich, Cannavan, Coleman, & Horne, 2007).
21 increases in pennation angle are associated with an increase force output demonstrated by Blazevich and colleagues (2007). These authors found after 10 weeks of either eccentric or concentric knee extension, the angle of pennation increase significantly by an average of ~ 17.9 % accompanied by an average increase of peak torque of ~20.5%.
The length of a muscle fibre has also been reported to have a dramatic effect on force and power generation. This is due to longer muscle fibres are capable of generating forces over longer ranges and are capable of faster contraction speeds (Blazevich et al., 2007). According to Maxwell’s model (Maxwell, Faulkner, & Hyatt, 1974), changes in one or more architectural factors of a fibre (length, CSA, or angle of pennation) would cause a change in other factor/s. For example, an increase in muscle fibre length would decrease the angle of pennation and vice versa. However this is not always the case, e.g. Balzevich et al., (2007) and Seynnes et al., (2007) found increases in fibre length, angle and size after resistance training.
22
Fibre Type Conversion
Muscle fibres are classified according to their functional capabilities and enzymatic profiles. Fibres are referred to as either ‘slow twitch’ or ‘fast twitch’ based on their contractile properties. Muscle fibres can also be classified according to their myosin ATPase isoform (Pette & Staron, 2000) and/or by myosin heavy chain (MHC) isoform (Schiaffino, Gorza, Sartore et al., 1989). Moreover, MHC types correlate strongly with myosin ATPase isoforms. Slow forms of myosin ATPase (type I) are associated with slow contraction and relaxation times and are more resistant to fatigue. Alternately, fast forms of myosin ATPase (type IIA, IIB and type IIX) are associated with fast contraction and relaxation times and high fatigability (Schiaffino et al., 1989).
23
Summary
24
Training Protocols that Contribute to
Lower Body Explosiveness
Lower body explosiveness is an important component for the successful completion of many sporting events and the vertical jump is possibly the best exercise to represent this (Potteiger, Lockwood, Haub, et al., 1999). Several training schemes have been developed over the years with a focus on improving the ability of the neuromuscular systems responsible for power production (Smilios et al., 2006). Different training protocols have been found to elicit different adaptations within the human body which account for the observed changes in performance (Hass, Feigenbaum, & Franklin, 2001). Some of the more recognised training protocols for improving explosive performance include; maximum strength training (80-100% of 1RM), higher velocity training (0-70% of 1RM [Cormie, McCaulley, Triplett, & McBride, 2007; Siegel, Gilders, Staron, & Hagerman, 2000]), plyometrics, over-speed, and combinations of these (Wilson et al., 1993). These training protocols will now be discussed for their significance in the development of explosive performance. The training schemes will be separated into two sections, single and mixed methods.
Single Focus Training Protocols
Slow Movement Velocity Training Protocols
25 production following heavy strength training may be due to the result of two main factors. Firstly: type II muscle fibre adaptations. During explosive muscular contractions (jumping, sprinting, maximal lifting etc), type II fibres are recruited more so than type I fibres, therefore adaptations (morphological) occur predominately within the type II fibres (Campos et al., 2002). These resulting adaptations within the type II muscle fibres (increased emzyme activity, conversion to type II fibres from type I, etc) have shown to increase strength and power output (Costill, Coyle, Fink, Lesmes, & Witzmann, 1979). Secondly, increases in the speed of muscular contraction due to neural adaptations include: increased motor unit activation, co-ordination, and motor unit synchronisation (Baker, Wilson, & Carlyon, 1994). Although maximal strength training involves slower movement velocities, power output can still be enhanced provided the intention to move the resistance is quick (Behm & Sale, 1993).
26
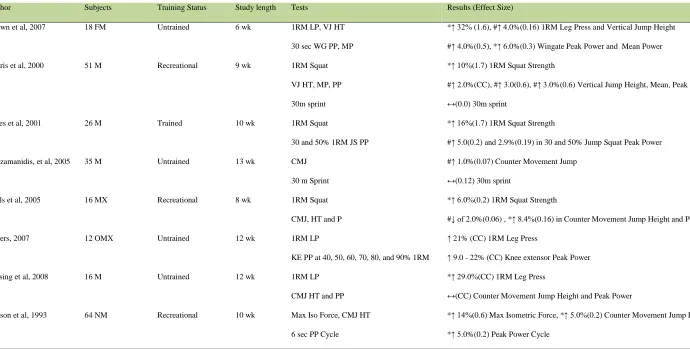
Table 1: Maximal strength training protocols and their influence on lower body explosiveness.
Author Subjects Training Status Study length Tests Results (Effect Size)
Brown et al, 2007 18 FM Untrained 6 wk 1RM LP, VJ HT
30 sec WG PP, MP
*↑ 32% (1.6), #↑ 4.0%(0.16) 1RM Leg Press and Vertical Jump Height
#↑ 4.0%(0.5), *↑ 6.0%(0.3) Wingate Peak Power and Mean Power
Harris et al, 2000 51 M Recreational 9 wk 1RM Squat
VJ HT, MP, PP
30m sprint
*↑ 10%(1.7) 1RM Squat Strength
#↑ 2.0%(CC), #↑ 3.0(0.6), #↑ 3.0%(0.6) Vertical Jump Height, Mean, Peak Power
↔(0.0) 30m sprint
Jones et al, 2001 26 M Trained 10 wk 1RM Squat
30 and 50% 1RM JS PP
*↑ 16%(1.7) 1RM Squat Strength
#↑ 5.0(0.2) and 2.9%(0.19) in 30 and 50% Jump Squat Peak Power
Kotzamanidis, et al, 2005 35 M Untrained 13 wk CMJ
30 m Sprint
#↑ 1.0%(0.07) Counter Movement Jump
↔(0.12) 30m sprint
Neils et al, 2005 16 MX Recreational 8 wk 1RM Squat
CMJ, HT and P
*↑ 6.0%(0.2) 1RM Squat Strength
#↓ of 2.0%(0.06) , *↑ 8.4%(0.16) in Counter Movement Jump Height and Power
Sayers, 2007 12 OMX Untrained 12 wk 1RM LP
KE PP at 40, 50, 60, 70, 80, and 90% 1RM
↑ 21% (CC) 1RM Leg Press
↑ 9.0 - 22% (CC) Knee extensor Peak Power
Vissing et al, 2008 16 M Untrained 12 wk 1RM LP
CMJ HT and PP
*↑ 29.0%(CC) 1RM Leg Press
↔(CC) Counter Movement Jump Height and Peak Power
Wilson et al, 1993 64 NM Recreational 10 wk Max Iso Force, CMJ HT
6 sec PP Cycle
*↑ 14%(0.6) Max Isometric Force, *↑ 5.0%(0.2) Counter Movement Jump Height
*↑ 5.0%(0.2) Peak Power Cycle
M = Male; FM = Female; MX = Mixed Gender; O = Older; OMX = Older Mixed Gender; NM = Not Mentioned; wk = weeks; P = Power; PP = Peak Power; MP = Mean Power; VJ = Vertical Jump; DJ = Depth Jump; SJ =
Squat Jump; CMJ = Counter Movement Jump; HT = Height; KE = Knee Extension; SJ = Squat Jump; JS = Jump Squat; MK = Margaria-Kalamen; WG = Wingate; ↑ = Increase; *↑ = Significant Increase; #↑ = Non Significant
27 For the purpose of this review to distinguish between the level of training the following categories were used: untrained = subjects with no resistance training experience and/or sedentary individuals; recreationally trained = subjects who play recreational sports and/or up to one year resistance training experience; trained = subjects who play competitive sports and have greater than one year resistance training experience; elite = subjects who compete in either national or international sport.
Of the reviewed literature the researcher that recruited the less trained subjects i.e. untrained, found the greater magnitudes of improvement compared to the literature involving more trained subjects. For example, Vissing et al., (2008), Sayers (2007), and Brown et al., (2007) all recruited untrained subjects and found after 12 and six weeks of strength training between 21 – 32% (1.6 ES Brown et al., 2007) increases in strength. Those studies with more trained subjects (recreationally trained) found 6 – 14% (0.2 - 1.7 ES) improvements in strength (Harris, Stone, O’Bryant, Prolux, & Johnson, 2000; Neils et al., 2005; Wilson et al., 1993) and trained subjects found a 16% (1.7 ES) increase in strength (Jones, Bishop, Hunter, Fleisig, 2001).
28 researchers have not recorded similar improvements in power output following high load / maximal strength training protocols (Vissing et al., 2008).
Of the eight research articles that were found, three utilised bi-weekly training (Brown et al., 2007; Wilson et al., 1993; Harris et al., 2000) and four trained tri-weekly (Vissing et al., 2008; Kotzamanidis et al., 2005; Sayers, 2007; Neils et al., 2005) and one trained four times per week (Jones et al., 2001). Research results seem mixed after twice a-week training with results showing significant improvements in cycling power (Wilson et al., 1993; Brown et al., 2007). Vertical jumping however was not so favorable after bi weekly strength training, with only Wilson and colleagues (1998) showing significant improvement in both squat jump (SJ) and counter movement jump (CMJ) jump height of 6 and 5% (0.2 ES) respectively. Training tri weekly, researchers found a 4% improvement in ballistic leg press peek power (PP) (Vissing et al., 2008), 8.4% (0.16 ES) CMJ PP (Neils et al., 2005) and between 9-22% knee extensor (KE) PP through a 40-90% 1RM (Sayers, 2007). Training four times a week saw no significant improvements in power output during drop jumps (DJ) or 30 and 50% 1RM jump squats (JS) (Jones et al., 2001).
29 high loads. Researchers have found untrained subjects, who would expect to gain the most, not to improve CMJ HT and PP but increase ballistic leg press PP by 6.0% (Vissing et al., 2008). However, untrained subjects did improve PP output during KE through a range of intensities (Sayers, 2007). The inconsistent effects of maximal strength training exist with more trained subjects as well. No improvements were found within the reviewed literature on sprint speed after strength training. Both studies (Harris et al., 2000; Kotzamanidis et al., 2006) reported no improvement in sprint tests.
The training variables (sets, reps, frequency etc) within this training protocol were varied within the reviewed literature. Four of the studies used a straight set design (sets and repetitions do not vary and stay the same throughout the programme) (Sayers, 2007; Harris et al., 2000; Neils et al., 2005; Brown et al., 2007), four utilised a linear periodization model (increasing load and volume decreases, changes roughly every four weeks [Fleck, 1999]) (Kotzamanidis et al., 2005; Vissing et al., 2008; Wilson et al., 1993; Jones et al., 2001). As before no one training protocol was better than the other within maximal strength training schemes to improve power output. Results varied from no change, decreases (Neils et al., 2005), to significant and non significant increases (Wilson et al., 1993; Harris et al., 2000) with no consistency within the training protocols.
Plyometric Training Protocols
30 shortening cycle (SSC) (Fatourus et al., 2000). Training in this manner involves individuals to exert maximal effort to move a sub-maximal load as fast as possible; resulting in the load becoming airborne (Kreamer & Newton, 2000) moreover it negates the negative deceleration aspect of traditional resistance training (Newton, Kraemer, & Hakkinen, 1999). Lower body plyometric exercises are similar to the movement patterns of athletic performance. The exercises include: bounding, hopping, and various jumping activities on one and two legs (Potteiger et al., 1999). Plyometric training is defined more so by the amount of foot contacts within a training session, which is dependent on the level of the athlete. For example, a novice athlete would perform approximately 80 – 100 foot contacts, an intermediate athlete would perform 100 - 120 foot contacts, and an advanced athlete would perform 120 – 140 foot contacts per session (Potach & Chu, 2000). Plyometric training is believed to improve explosive performance by enhancing the coordination of the neural control of the SSC (Newton et al., 1999). Although sometimes called ballistic training (Newton et al., 2006) because of similarities between the two training protocols, ballistic training can involve elements of both plyometric and traditional weight lifting (McEvoy & Newton, 1998). For example, ballistic training exercises could include; jumping movements or only involve concentric only elements like a squat jump.
31 found improvements in strength after training with magnitudes between 12 (2.5 ES) and 37% (1.9 ES). None of the subjects within the reviewed literature were experienced weight lifters and therefore it is not surprising to see the large gains. The largest magnitude of change (37%) occurred in only six weeks of training (Brown et al., 2007) whereas the smallest magnitude of change (12%) occurred after a longer training intervention period of 12 weeks (Fatourus et al., 2000).
32
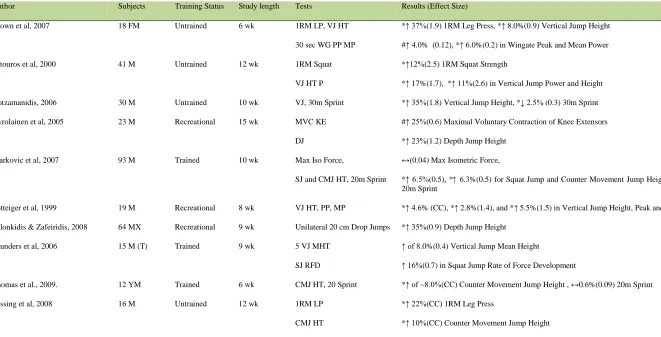
Table 2: Plyometric training protocols and their influence on lower body explosiveness.
Author Subjects Training Status Study length Tests Results (Effect Size)
Brown et al, 2007 18 FM Untrained 6 wk 1RM LP, VJ HT
30 sec WG PP MP
*↑ 37%(1.9) 1RM Leg Press, *↑ 8.0%(0.9) Vertical Jump Height
#↑ 4.0% (0.12), *↑ 6.0%(0.2) in Wingate Peak and Mean Power
Fatouros et al, 2000 41 M Untrained 12 wk 1RM Squat
VJ HT P
*↑12%(2.5) 1RM Squat Strength
*↑ 17%(1.7), *↑ 11%(2.6) in Vertical Jump Power and Height
Kotzamanidis, 2006 30 M Untrained 10 wk VJ, 30m Sprint *↑ 35%(1.8) Vertical Jump Height, *↓ 2.5% (0.3) 30m Sprint
Kyrolainen et al, 2005 23 M Recreational 15 wk MVC KE
DJ
#↑ 25%(0.6) Maximal Voluntary Contraction of Knee Extensors *↑ 23%(1.2) Depth Jump Height
Markovic et al, 2007 93 M Trained 10 wk Max Iso Force,
SJ and CMJ HT, 20m Sprint
↔(0.04) Max Isometric Force,
*↑ 6.5%(0.5), *↑ 6.3%(0.5) for Squat Jump and Counter Movement Jump Height, #↓ ~1.5%(CC) 20m Sprint
Potteiger et al, 1999 19 M Recreational 8 wk VJ HT, PP, MP *↑ 4.6% (CC), *↑ 2.8%(1.4), and *↑ 5.5%(1.5) in Vertical Jump Height, Peak and Mean Power
Salonkidis & Zafeiridis, 2008 64 MX Recreational 9 wk Unilateral 20 cm Drop Jumps *↑ 35%(0.9) Depth Jump Height
Saunders et al, 2006 15 M (T) Trained 9 wk 5 VJ MHT
SJ RFD
↑ of 8.0%(0.4) Vertical Jump Mean Height
↑ 16%(0.7) in Squat Jump Rate of Force Development
Thomas et al., 2009. 12 YM Trained 6 wk CMJ HT, 20 Sprint *↑ of ~8.0%(CC) Counter Movement Jump Height , ↔0.6%(0.09) 20m Sprint
Vissing et al, 2008 16 M Untrained 12 wk 1RM LP
CMJ HT
*↑ 22%(CC) 1RM Leg Press
*↑ 10%(CC) Counter Movement Jump Height
M = Male; FM = Female; MX = Mixed Gender; Y = Younger; wk = weeks; P = Power; PP = Peak Power; MP = Mean Power; VJ = Vertical Jump; DJ = Depth Jump; SJ = Squat Jump; CMJ = Counter Movement Jump; HT =
Height; MHT = Mean Height; SJ = Squat Jumps; 1RM = One Repetition Maximum; LP = Leg Press; MVC = Maximum Voluntary Contraction; Max Iso = Maximum Isometric; WG = Wingate; ↑ = Increase; *↑ = Significant
33 Training frequency had no impact on improvements as subject who trained twice a week improved jump height between 8.0 (0.9 ES) – 35% (1.8 ES) (Brown et al., 2007; Kotzamandis, 2006) and those subjects who trained three time per week improved to a similar magnitude of between 4.6 – 35% (0.9 ES) (Potteiger et al., 1999; Salonkidis & Zafeiridis, 2008). Researchers utilising jumping tests that allowed a CMJ and arm swing produced increases ranging from 8.0 (0.9 ES) – 11% (1.7 ES) (Brown et al., 2007; Fatouros et al., 2000), CMJ jumps without an arm swing between 8.0 – 35% (0.9 ES) (Salonkidis & Zafeiridis, 2008; Thomas, French, & Heyes., 2009), and SJ of 6.5% (0.5 ES) (Markovic et al., 2007).
Horizontal explosiveness has been investigated in three of the reviewed literature with mixed results. Kotzamanidis and colleagues (2006) found a 2.5% (0.3 ES) increase in 30m sprint time and Markovic et al., (2007) found a 1.5% improvement in 20m sprint performance. However Thomas and colleagues (2009) found a small 0.6% (0.09 ES) improvement in performance. Given that only a small number of the reviewed literature measured explosive performance in this manner (sprinting) it would be speculative of the authors to say that plyometric training protocols are effective to improve this type of performance.
34 VJ PP increases of 26% (2.6 ES) (Fatouros et al., 2000) and 2.8% (1.4 ES) and 5.5% (1.5 ES) improvement in VJ PP and MP respectively (Potteiger et al., 1999). Plyometric training protocols have also shown to improve RFD by 17% (0.7 ES) with a concurrent 10% (0.4 ES) increase in VJ height (Saunders et al., 2006). Increases in CSA have also been found following plyometric training suggesting muscle morphology may play a role in dynamic explosive activity (Potteiger et al., 1999).
Dynamic Training Protocols
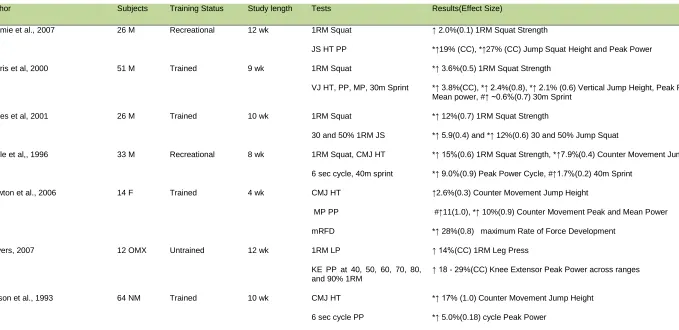
35 Dynamic training protocols have consistently improved subject’s strength performance as all of the reviewed literature reported magnitude of improvement between 2.0 (0.1 ES) and 15% (0.6 ES) (Cormie et al., 2007; Lyttle et al., 1996) (Table 3). The magnitude of improvement is less compared to the magnitude of change reported in the literature involving maximal strength (6.0 [0.2 ES] to 32% [1.6 ES]) and plyometric training (12 [2.5 ES] to 37% [1.9 ES]) protocols.
Dynamic training protocols have been found to be successful in improving power performance (Table 3). Untrained (Sayers, 2007), recreational (Lyttle, Wilson, Ostrowski, 1996; Cormie, McCaulley, & McBride, 2007), and trained subjects (Newton et al., 2006; Wilson et al., 1993; Harris et al., 2000; Jones et al., 2001) have benefited from dynamic training protocols. Training improvements in jumping ability were reported in recreational and trained subjects ranging from 7.9 (0.4 ES) – 19% and 2.6 (0.3 ES) – 17% (1.0 ES). Power output ranged from 18 – 29%, 9.0 (0.9 ES) – 27% and 2.4 (0.8 ES) – 11% (1.0 ES) in untrained, recreational and trained subjects respectively. From the reviewed studies, only two measured sprint performance (Harris et al., 2000; Lyttle et al., 1996). Non significant decreases of 0.6% (0.7 ES) (Harris et al., 2000), and 1.7% (0.2 ES) (Lyttle et al., 1996) were found in 30m and 40m sprint performance respectively.
36
Table 3: Dynamic training protocols and their influence on lower body explosiveness.
Author Subjects Training Status Study length Tests Results(Effect Size)
Cormie et al., 2007 26 M Recreational 12 wk 1RM Squat
JS HT PP
↑ 2.0%(0.1) 1RM Squat Strength
*↑19% (CC), *↑27% (CC) Jump Squat Height and Peak Power
Harris et al, 2000 51 M Trained 9 wk 1RM Squat
VJ HT, PP, MP, 30m Sprint
*↑ 3.6%(0.5) 1RM Squat Strength
*↑ 3.8%(CC), *↑ 2.4%(0.8), *↑ 2.1% (0.6) Vertical Jump Height, Peak Power, Mean power, #↑ ~0.6%(0.7) 30m Sprint
Jones et al, 2001 26 M Trained 10 wk 1RM Squat
30 and 50% 1RM JS
*↑ 12%(0.7) 1RM Squat Strength
*↑ 5.9(0.4) and *↑ 12%(0.6) 30 and 50% Jump Squat
Lyttle et al,, 1996 33 M Recreational 8 wk 1RM Squat, CMJ HT
6 sec cycle, 40m sprint
*↑ 15%(0.6) 1RM Squat Strength, *↑7.9%(0.4) Counter Movement Jump Height
*↑ 9.0%(0.9) Peak Power Cycle, #↑1.7%(0.2) 40m Sprint
Newton et al., 2006 14 F Trained 4 wk CMJ HT
MP PP
mRFD
↑2.6%(0.3) Counter Movement Jump Height
#↑11(1.0), *↑ 10%(0.9) Counter Movement Peak and Mean Power
*↑ 28%(0.8) maximum Rate of Force Development
Sayers, 2007 12 OMX Untrained 12 wk 1RM LP
KE PP at 40, 50, 60, 70, 80, and 90% 1RM
↑ 14%(CC) 1RM Leg Press
↑ 18 - 29%(CC) Knee Extensor Peak Power across ranges
Wilson et al., 1993 64 NM Trained 10 wk CMJ HT
6 sec cycle PP
*↑ 17% (1.0) Counter Movement Jump Height
*↑ 5.0%(0.18) cycle Peak Power
M = Male; F = Female; MX = Mixed Gender; OMX = Older Mixed Gender; NM = Not Mentioned; wk = weeks; PP = Peak Power; MP = Mean Power; VJ = Vertical Jump; CMJ = Counter Movement Jump; HT = Height; KE
= Knee Extension; JS = Jumps Squat; BM = Body Mass; RM = Repetition Maximum; mRFD = Maximum Rate of Force Development; ↑ = Increase; *↑ = Significant Increase; #↑ = Non Significant Increase; ↔ = No difference
37 Training frequency within the dynamic training protocols ranged from two (Lyttle et al., 1996; Wilson et al., 1993; Cormie et al., 2007; Jones et al., 2001), three (Sayers, 2007) and four (Harris et al., 2000) days per week. Training frequency resulted in differing results in reported jump height performance. Subjects who trained twice a week showed the greatest improvements in CMJ HT of 7.9 (0.4 ES) - 17% (1.0 ES) (Lyttle et al., 1996; Wilson et al., 1993).
Variations of the dynamic training protocols have been used within the literature including, linear periodisation (Jones et al., 2001; Wilson et al., 1993) and straight set designs (Sayers, 2007; Harris et al., 2000; Cormie et al., 2007; Lyttle et al., 1996). These protocols have also displayed varied improvements with no protocol being better than the other. For example Wilson and colleagues (1993) found a 17% (1.0 ES) increases in CMJ HT after 10-weeks of Pmax training whereas Lyttle and colleagues (1996) similarly found 7.9% (0.4 ES) in CMJ HT.
Over-Speed Training Protocols
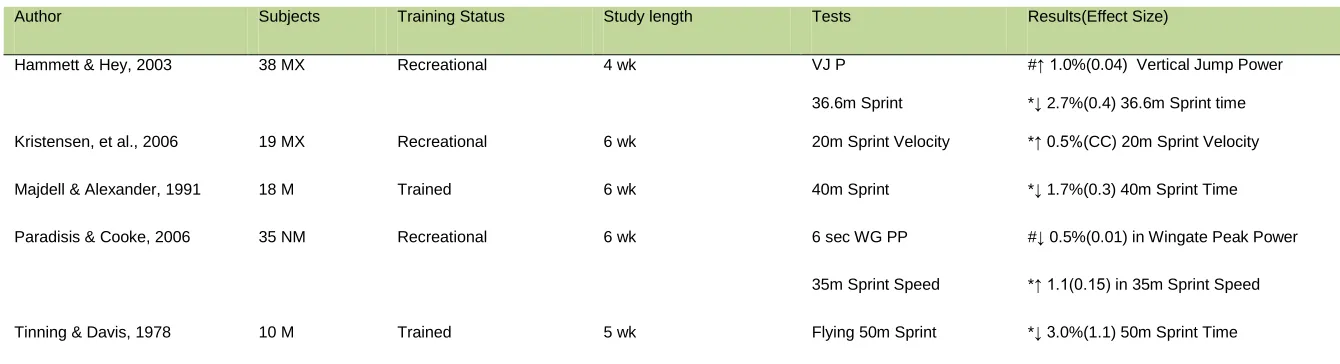
38 vehicle (Mero, Komi, Rusko, & Hirvonen, 1987; Girold, Calmels, Maurin, Milhau, & Chatard, 2006). Over-speed training protocols are also referred to as supra-maximal and assisted training. To date research utilizing over-speed stimulation has focused on sprinting performance (Mero & Komi, 1986; Mero et al., 1987; Majdell & Alexander, 1991; Tinning & Davis, 1978). The mechanisms behind adaptation to over-speed are unclear but theories include increased force output during ground contact, decreased ground contact, increased used of fast twitch muscle fibres, and enhanced firing of the nerves to the active muscles (Mero et al., 1987; Tinning & Davis, 1978).
39
Table 4: Over-speed training protocols and their influence on lower body explosiveness.
Author Subjects Training Status Study length Tests Results(Effect Size)
Hammett & Hey, 2003 38 MX Recreational 4 wk VJ P
36.6m Sprint
#↑ 1.0%(0.04) Vertical Jump Power
*↓ 2.7%(0.4) 36.6m Sprint time
Kristensen, et al., 2006 19 MX Recreational 6 wk 20m Sprint Velocity *↑ 0.5%(CC) 20m Sprint Velocity
Majdell & Alexander, 1991 18 M Trained 6 wk 40m Sprint *↓ 1.7%(0.3) 40m Sprint Time
Paradisis & Cooke, 2006 35 NM Recreational 6 wk 6 sec WG PP
35m Sprint Speed
#↓ 0.5%(0.01) in Wingate Peak Power
*↑ 1.1(0.15) in 35m Sprint Speed
Tinning & Davis, 1978 10 M Trained 5 wk Flying 50m Sprint *↓ 3.0%(1.1) 50m Sprint Time
40 Power measures used in the reviewed literature included calculated vertical jump peak power and Wingate cycle test. There appears to be a lack of consistency of improvement of power output using over-speed sprint training as slight or no differences were found after four weeks (Hammett & Hey, 2003) or six weeks (Paradisis & Cooke, 2006) of training respectively. Measures of power output were scarce within over-speed training protocols. This highlights the need for further investigation into the effectiveness of over-speed training on power output. No measures of strength were used in any of the reviewed literature of this kind of training protocol.
Mixed Methods Training Protocols
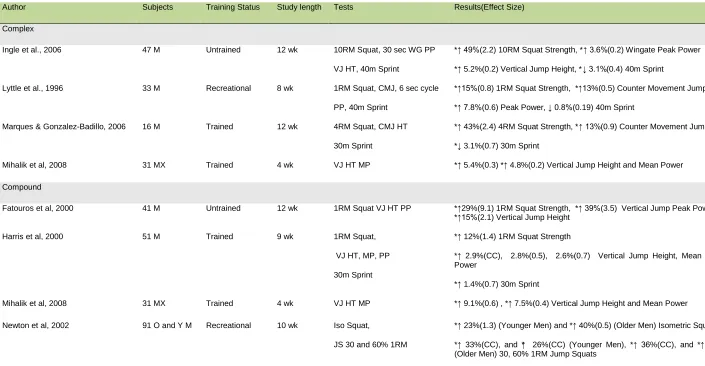
41 by alternating between resistance exercises and biomechanically similar plyometric exercises within the same session (Mihalik et al., 2008). Complex training is thought to be more effective than other training schemes because of an enhanced neuromuscular environment (Masamoto, Larson, Gates, & Faigenbaum, 2003).
42
Table 5: Mixed method training protocols and their influence on lower body explosiveness.
Author Subjects Training Status Study length Tests Results(Effect Size)
Complex
Ingle et al., 2006 47 M Untrained 12 wk 10RM Squat, 30 sec WG PP
VJ HT, 40m Sprint
*↑ 49%(2.2) 10RM Squat Strength, *↑ 3.6%(0.2) Wingate Peak Power
*↑ 5.2%(0.2) Vertical Jump Height, *↓ 3.1%(0.4) 40m Sprint
Lyttle et al., 1996 33 M Recreational 8 wk 1RM Squat, CMJ, 6 sec cycle
PP, 40m Sprint
*↑15%(0.8) 1RM Squat Strength, *↑13%(0.5) Counter Movement Jump Height
*↑ 7.8%(0.6) Peak Power, ↓ 0.8%(0.19) 40m Sprint
Marques & Gonzalez-Badillo, 2006 16 M Trained 12 wk 4RM Squat, CMJ HT
30m Sprint
*↑ 43%(2.4) 4RM Squat Strength, *↑ 13%(0.9) Counter Movement Jump Height
*↓ 3.1%(0.7) 30m Sprint
Mihalik et al, 2008 31 MX Trained 4 wk VJ HT MP *↑ 5.4%(0.3) *↑ 4.8%(0.2) Vertical Jump Height and Mean Power
Compound
Fatouros et al, 2000 41 M Untrained 12 wk 1RM Squat VJ HT PP *↑29%(9.1) 1RM Squat Strength, *↑ 39%(3.5) Vertical Jump Peak Power, *↑15%(2.1) Vertical Jump Height
Harris et al, 2000 51 M Trained 9 wk 1RM Squat,
VJ HT, MP, PP
30m Sprint
*↑ 12%(1.4) 1RM Squat Strength
*↑ 2.9%(CC), 2.8%(0.5), 2.6%(0.7) Vertical Jump Height, Mean and Peak Power
*↑ 1.4%(0.7) 30m Sprint
Mihalik et al, 2008 31 MX Trained 4 wk VJ HT MP *↑ 9.1%(0.6) , *↑ 7.5%(0.4) Vertical Jump Height and Mean Power
Newton et al, 2002 91 O and Y M Recreational 10 wk Iso Squat,
JS 30 and 60% 1RM
*↑ 23%(1.3) (Younger Men) and *↑ 40%(0.5) (Older Men) Isometric Squat,
*↑ 33%(CC), and *↑ 26%(CC) (Younger Men), *↑ 36%(CC), and *↑ 25%(CC) (Older Men) 30, 60% 1RM Jump Squats
M = Male; MX = Mixed Gender; O = Older; Y = Younger; wk = weeks; PP = Peak Power; MP = Mean Power; VJ = Vertical Jump; CMJ= Counter Movement Jump; JS = Jump Squat; Iso = Isometric; RM = Repetition Maximum;
43 frequency during their research of three days a week compared to either two days (Harris et al., 2000) and four day (Mihalik et al., 2008).
Compound training protocols have also provided greater improvements in performance measures, when compared to single focus training protocols. For example, Harris et al., (2000) found subjects performing a combination of high force and high velocity training improved equally or better in VJ HT (2.9%), MP (2.8% [0.5 ES]), and PP (2.6% [0.7 ES]), compared to either a high force (2.0, 3.0 [0.6 ES], and 3.0% [0.6 ES] respectively), or high power groups (3.8, 2.4 [0.8 ES), and 2.1% [0.6 ES] respectively). Similarly Fatouros et al., (2000) found significant differences in their compound group between both a plyometric and strength training groups of 15% (2.1 ES) and 39% (3.5 ES) in VJ HT and VJ PP respectively compared to 11% (2.6 ES) and 17% (1.7 ES), and 9.0% (3.3 ES) and 25% (2.9 ES) improvement of the plyometric and strength training groups respectively.
44 Training frequency seemed to have little effect on performance, as those researchers that reported the greatest gains (Lyttle et al., 1996; Marques & Gonzalez-Badillo, 2006) trained both twice, and three times per week. Untrained subjects appeared to improve their performance when a straight set design was utilised (Lyttle et al., 1996), whereas more trained subjects benefited more from a mixed linear and undulating training protocols (Marques & Gonzalez-Badillo, 2006).
Comparisons between complex training protocols and other methods have found favourable results. Complex training has been shown to be just as effective as both maximal power training (Lyttle et al., 1996) and compound training (Mihalik et al., 2008). However within the current studies complex training was not seen as superior to these other methods with increases of 13% (0.5 ES) CMJ, and 7.8% (0.6 ES) 6-sec cycle PP in complex training compared to 7.9% (0.4 ES) CMJ and 9.0% (0.9 ES) 6-sec cycle PP after maximal power training (Lyttle et al., 1996). Compared to compound training increases in power performance after complex training was found to be similar and these improvements increased at similar rates, VJ 5.4% (0.3 ES), MP 4.8% (0.2 ES) for complex and VJ 9.1% (0.6 ES) and MP 7.5% (0.4 ES) after compound training (Mihalik et al., 2008).
Summary
45 implemented by the conditioning professional should by specific to the goals / needs of the athlete. For example, if strength needs to be improved then a maximal strength protocol should be used but if the athlete wants to jump higher, a plyometric protocol maybe more appropriate.
There are many combinations, from the reviewed literature, that are possible within combined method training including; strength and plyometric, strength and dynamic, and strength and over-speed protocols. However, no research was found on the effects of a strength and over-speed training protocol. Moreover the research related to over-speed training has only been investigated in a horizontal plane and mainly on the effect on sprint speed. What effect might there be of a vertical over-speed protocol or a combined strength and over-over-speed protocol on various performance measures?
46
Introduction
The ability to generate force quickly (power) is paramount during actions involving changes in direction, sprinting, and jumping (McClenton et al., 2008). As such, power training has received intense investigation over the years to aid athletes in running faster, jumping higher and throwing further. As illustrated by the force-velocity-power relationship, maximal power output is obtained when an optimal combination of force and velocity have been reached (Kraemer & Newton, 2000). Researchers have used this principle to improve power output by designing training strategies that either maximizes strength (force) (Brown et al, 2007) or the speed of the contraction (velocity) (Cormie, McCaulley & McBride, 2007) or both (Marques & Gonzalez-Badillo, 2006). However, the load, and therefore the velocity, that maximizes power output has been inconsistent, with loads ranging between 0-70% of one repetition maximum (1RM), (Cormie et al., 2007; Siegel et al., 2002) and appears to be movement specific.
47 strength, rate of force development, the stretch shortening cycle, and inter-muscular co-ordination and skill (Newton & Kraemer, 1994). Researchers are in agreement on the effective use of combined protocols, compound or complex, as a means to improve power output (Newton, Rogers, Voleck, Hakkinen, & Kraemer, 2006; Markovic et al., 2007; Fatouros et al., 2000). However, since many protocols are used, researchers have not yet determined the “ideal” training stimulus in which power production is best improved by combined protocols, and furthermore, whether there is indeed a “ideal” stimulus or simply a plethora of combinations dependant on the athlete, phase, and competition specific variables (e.g. implement, bodyweight etc).
It has been stated that if athletes want to improve high-velocity force (power) then they should perform exercises at high movement speeds (Blazevich & Jenkins, 2002). Faster than “normal” movement velocities can be achieved when artificial assistance is given from either, towing, bungee apparatuses etc (Majdell & Alexander, 1991). This assisted speed stimulation has been shown to improve athlete velocity during sprinting (Hammett & Hey, 2003; Kristensen et al., 2006) and swimming activities (Girold, Calmels, Maurin, Milhau, & Chatard, 2006). Sporting activities are not only limited to the horizontal plane, but can also occur in the vertical plane as well, e.g. jumping. To date no attention has been given to an assisted velocity stimulus in the vertical plane.
49
Methods
Design
This randomized longitudinal study comprised of seven weeks training split into one, three week base strength phase and one, four week intervention phase (figure 1). Subjects were pair – matched (as practically possible) with respect to their 3RM squat strength, 20-metre sprint, and vertical jump test results of the second testing session (see below). Subjects were then randomly allocated to either a strength and plyometric jumping (SVJ) or a strength and assisted plyometric jumping (SAJ) group.
Subjects were tested during a familiarization session before the commencement of the study (PRE1), during week three of the baseline strength phase (PRE2), and at the completion of the training intervention during week nine (POST1). The tests comprised of a vertical jump (power), a 20m sprint assessment (speed), and a 3RM squat test (strength), in that order. Each test was separated by 10 minutes of rest. The protocols and methods used in this study were approved by the Waikato Institute of Technology’s (WINTEC) Human Ethics Research Committee prior to the commencement of this study (see Appendix 1).
Figure 1: Research design in chronological order outlining testing, baseline and intervention phases.
Week 9
Testing
Week 5-8
Intervention Training
Week 4
Testing
Week 2-4
Baseline Training
Week 1
50
Subjects
Seventeen male athletes were recruited from local sports clubs, gyms and students from WINTEC and agreed to participate in this study. Subjects were recruited through either an advertisement flyer (see Appendix 2) or via recruitment presentations. Subject characteristics are displayed in Table 6. All subjects had at least six months prior weight training experience and currently training regularly using heavy loads, i.e. ≤8RM. Subjects were excluded if they had current injuries to the lower back, hip, or knees and screened via a health screening form (see Appendix 3). Moreover subjects not completing 80% or more of the intervention were excluded from statistical analysis. All subjects were informed of the procedures of the study, through an information sheet (see Appendix 4), and gave their written informed consent prior to the studies commencement (see Appendix 5). During the course of the study 17 subjects withdrew for various reasons; 12 from non compliance, three from individual sport injuries, and two from aggravating old injuries. The 17 recruited subjects participate in a variety of sports including; rugby (7), recreational resistance training (7), martial arts (2), parkour (1).
Table 6: Characteristics of subjects (means ± SD).
No of subjects
Age (years) Weight (kg)
Height (cm)
Training Experience (months)
SVJ 8 20 ± 2 80 ± 14 177 ± 11 26 ± 17
51
Training Protocols
Strength Training Protocol
All subjects completed the same strength training protocol during the seven week training period. Subjects completed two supervised lower body resistance training sessions per week and on average two other training sessions with their sporting code. Each supervised training session was separated by a minimum of 48 hours to ensure recovery between trainings. All sessions, both training and testing, began with a standardised warm up consisting of five minutes of light jogging and self directed stretching. Each training session comprised of four of the following exercises;
Back Squats – as outlined by Earle and Baechle (2000) this exercise began with placing an Olympic bar in a high bar position (position at the base of the neck resting on the posterior deltoids). Subjects positioned their feet approximately shoulder width apart. Whilst maintaining a neutral spine (neither hunched nor excessively extended), chest up and out, and head looking slightly up subjects began to flex at the hips and knees to lower themselves to a parallel position (thighs parallel to floor) whilst maintaining heel contact with the floor. Once subjects reached the parallel position or the heels of their feet lifted off the ground they began to extend their hips and knees to raise themselves to a full standing position.
52 Front Squats - as outlined by Earle and Baechle (2000) this exercise is similar to the Back Squat with one difference. The bar was placed on top of the anterior deltoids, instead of the posterior deltoids, using either using a parallel (hands were placed on the bar in an pronated grip slightly wider than should width and upper arm parallel to floor) or crossed (arms crossed in front of chest using an open grip on the bar to maintain placement and elbows parallel to floor) arm position.
½ Squats - this exercise was similar to the Back Squat with one difference. While lowering the bar and themselves, instead of lowering to a parallel thigh position, subjects only needed to lower to a knee angle of approximately 900.
Static Lunges – as outlined by Earle and Baechle (2000) this exercise began by placing an Olympic bar in a high bar position and taking a large step forward into a split stance. Subjects then lowered the trailing leg until both knees were approximately 900. Once the 900 had been reached subjects extended the front knee to return to the split stance position. Subjects were instructed to keep the front knee over the front foot and maintain a perpendicular body position to the floor. Once the desired repetitions were completed on one leg subjects changed the lead leg to the trailing leg.
53 moved passed the knees to move the hips forward. At the top position, standing, subjects were also instructed not to excessively extend the back but to maintain a normal erect position. Subjects then lowered the bar under control to the beginning position. Those subjects with poor hand grip were allowed to used hand grips in order to lift maximally.
Clean Pulls - as outlined by Newton (2006), this exercise begins in a Deadlift starting position. The movement is the same for the Deadlift except towards the end of the movement subjects “jumped” explosively, maintaining toe contact with the floor. Subjects were also instructed to maintain “stiff arms” with as little flexion as possible. Subjects with poor hand grip were allowed to use hand grips.
Clean Pulls from a Hang – as outlined by Newton (2006), this exercise is the last part of the Clean Pulls, beginning from a semi upright (hanging) position. The bar was positioned atop of boxes to make it easier for subjects to initially lift the bar to begin the exercise. The exercise began after subjects lifted the bar from the boxes and positioning the bar mid-way up the thighs. Subjects were instructed to explosively extend their hips, and knees to effectively jump maintaining toe contact with the floor. Subjects were also instructed to maintain “stiff arms” with as little flexion as possible. Subjects with poor hand grip were allowed to use hand grips.
54 During the baseline training phase subjects were instructed not to perform exercises to failure but instead to lower training loads to approximately 80% effort. However during the intervention phases, subjects were instructed to lift maximally and to failure. Throughout this study subjects were still permitted to continue with their normal upper body training but no lower body training was allowed.
Interventions
Plyometric Group Training
Eight subjects completed the strength and vertical jumping protocol (SVJ). The subjects completed their resistance and jumping exercises in a contrasting manner (refers to a workout that involves the use of alternating sets between heavy and light resistances [Duthie, Young, & Aitken, 2002]). Six jumps were performed after the first three sets (for a total of six sets of jumps for each day) of the back squats and lunges during day 1 and after box squats and dead lifts during day 2.
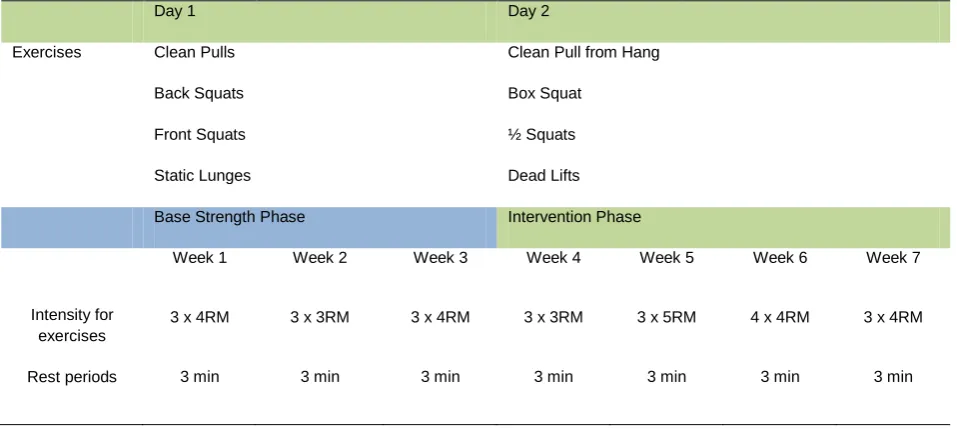
Table 7: Training exercises, intensities and rest for the two protocols over each of the seven week periods.
Day 1 Day 2
Exercises Clean Pulls
Back Squats
Front Squats
Static Lunges
Clean Pull from Hang
Box Squat
½ Squats
Dead Lifts
Base Strength Phase Intervention Phase
Week 1 Week 2 Week 3 Week 4 Week 5 Week 6 Week 7
Intensity for exercises
3 x 4RM 3 x 3RM 3 x 4RM 3 x 3RM 3 x 5RM 4 x 4RM 3 x 4RM
55 Subjects were instructed to jump as high and as quickly as possible with a countermovement and minimal rest between jumps. The rest period between a strength set and the plyometric jump set was 90 seconds. Although researchers have investigated the optimal rest length between complex training sets (4 minutes) (Comyns, Harrison, Hennessy, & Jensen, 2006), in “real life” this is unrealistic. That is, if a strength training session comprising of four exercises with alternating power exercises with three sets of six repetitions, it would take in excess of 70 minutes (not including a warm up, warm down, and exercise time). Therefore performing the jumping exercise mid-way through a typical strength training rest period i.e. 3-mins, makes a training session that is approximately 55 min long and more appropriate in “real life”.
The SVJ protocol served as the control for this study. The decision to use the plyometric jumping group as the control was due to the combination of strength and plyometric training being common practice when developing explosive power in activities involving the SSC, such as jumping and sprinting (Newton et al., 2006; Markovic et al., 2007; Fatouros et al., 2000). The authors want to test the experimental procedures (assisted jumping) against more traditional procedures of power development.
Assisted Group Training
56 long strength band (Iron Woody LLC, Montana) via karabiners. The karabiners were attached to the harness at each leg strap just behind the adjusting buckle and also attached to the strength band. The strength bands were attached to a power rack in the middle of the top support beams at a height of 2.1 m. An assistance level of -25% bodyweight was chosen for the SAJ group. To reach a -25% level of assistance subjects were weighed at the commencement of each training session to determine the type of strength band required. For heavier and taller subjects a heavier/stronger tensioned band was needed (medium #4 band) and a lighter/weaker tensioned band was needed (super mini #2 or small #3 band) for shorter or lighter subjects. If the assistance was too great or not enough the leg straps of the climbing harnesses were adjustable and could be loosened off (lessening the assistance) or tightened (increasing the assistance) in order to reach the desired -25% body weight of assistance.
Testing Procedures
Vertical Jump Test
57
Sprint Test Procedures
A 20m sprint test was used to measure horizontal speed and acceleration prior to and after experimental procedures. Subjects ran the 20m sprint distance in an indoor facility without the use of spikes. Subjects began from a standing static starting position and measured by infra red light cells (Speedlight, Swift Performance Equipment, Lismore, Australia) (Blazevich & Jenkins, 2002). The timing lights were placed at 0, 10, and 20m intervals to gather speed data of the sprint test. Before the maximal sprint test subjects were give three sub-maximal trials at self estimated intensities of 50, 75 and 90% efforts. After which subjects completed three maximal effort trials separated by five minutes rest and the fastest time was used for analysis (Harrison, Keane, & Coglan, 2004) (see Appendix 6).
3RM Squat Test
58 From the 3RM squat strength test a predicted 1RM value was attained using the Epley formula. This method has been reported to correlate well compared to 1RM tests, r = 92 (Wood, Maddalozzo, & Harter, 2002). Testing the exact 1RM would be more accurate over predictive methods, however applying maximal loads to subjects who may not be accustomed to such intensities may result in injury, therefore this predictive method (using lighter loads) was used to minimise the injury risk while still acquiring accurate 1RM values (McIntosh, 2005).
Data Analysis
The resultant ground force reaction (GFR) data was collected at 500 Hz, from a 15 second capture time, and passed through a AC/DC converter (Type 5606A, Kistler Instruments Inc, Winterthur, Switzerland.) and analysed using force interpreting software (Bio Ware 2, ver 3.06c, Kristal Systems Inc, Switzerland). The force data was imported into a spreadsheet (Microsoft Office Excel 2007, Microsoft Corporation) for further analysis (see Appendix 7). From the force data, subject’s body weights were calculated by averaging the vertical force trace over 200 samples during a period of motionlessness prior to the vertical jump. The GFR data was used to determine the various variables of interest, including: total and average force, rate of force development (RFD), velocity (peak, average, and takeoff), and power (peak and average).
59 acceleration-time curve by dividing the normalized force by subject’s body mass (body weight / 9.81 (gravity)). Secondly, the acceleration-time curve was numerically integrated to find the velocity-time curve using the formulae, ∫ 𝑎𝑎𝑡𝑡𝑡𝑡12 ▲t = v2 - v1 for each data point. Finally power was calculated from multiplying the initial force by velocity (see Appendix 7).
Rate of force development was calculated from the peak force developed during the concentric phase of the jump (from the point at which the change in velocity becomes positive (i.e., end of the countermovement) to the point at which peak concentric force occurred before takeoff [Cormie, McBride, & McCaulley, 2007]) and determined as the change in force divided by the change in time taken to develop the force. Peak force (PF), peak power (PP), peak velocity (PV), were determined as the maximal value achieved during the concentric phase of the jump. Mean force (MF), power (MP), and velocity (MV) were calculated as the average values during the concentric part of the jump, i.e. point where change in velocity becomes positive to the point of take off. Relative force (RF) and power were calculated from dividing the PF and PV by the subject’s body mass (from the averaged 200 force plate samples). Take off velocity was deemed to be the first point where the force-time record from each jump zeroed.
Statistical Analysis
60 In order to assess the magnitudes of the effect between the two experimental training protocols with respect to VJ, 20 m sprint, 1RM, and kinetic variables, a spreadsheet for the analysis of a pre-post controlled trial with adjustment for a predictor (Hopkins, 2006) was used. The spreadsheet was used to log transform the raw results into a standardized effect unit and interpreted using the Cohen scale of magnitudes for standardized differences in the mean. The Cohen scale is represented by 0.2 (small), 0.6 (moderate), 1.2 (large), 2.0 (very large), and 4.0 (extremely large) effect sizes (ES) (Hopkins, 2009) and have been used to quantify the differences between conditions.
When results were not unclear, the probabilities of the reported effects were qualitatively quantified using the following descriptors developed by Hopkins (2002):
• <1%, almost certainly not
• <5%, very unlikely
• <25%, unlikely / probably not
• <75%, possibly / possibly not
• >75%, likely / probably
• >95%, very likely
• >99%, almost certain
61 In order to assess the magnitude of the effect within both training protocols with respect to vertical jump, 10 and 20m sprint performance, and 1RM squat strength a spreadsheet for the analysis of a post-only crossover trial, with adjustment for a predictor was used (Hopkins, 2006). The interpretation of the results was conducted in the same manner as mentioned above.
In order to compare the training effects between the groups with respect to the difference within subject ability (i.e. was there a greater training effect between the groups in subjects who were better performers, i.e. subjects who could jump higher, sprint faster, or lift more etc), trend lines between changes in post and baseline values were plotted. The above mentioned spreadsheet did this automatically. From the trend lines various point of intere