Economic Affairs, Vol. 64, No. 3, pp. 633-642, September 2019 DOI: 10.30954/0424-2513.3.2019.20
©2019 EA. All rights reserved
Technical Efficiency of Maize Production in Fluoride Affected
Locales, Tamil Nadu: A Stochastic Frontier Approach
Naveen Kumar, P.* and P. Paramasivam
Department of Agricultural Economics, TNAU, Coimbatore, Tamil Nadu, India *Corresponding author: [email protected] (ORCID ID: 0000-0003-3839-1329)
Received: 02-04-2019 Revised: 07-07-2019 Accepted: 22-08-2019
ABSTRACT
To estimate the technical efficiency of maize production among fluoride affected and non affected locales of Tamil Nadu. A multi-stage sampling method involving a combination of purposive and random sampling procedures was employed in drawing up the samples for collecting primary data. The sample size is about 120. Stochastic frontier production function is used to estimate technical efficiency of maize. The result of stochastic frontier production function indicated that FYM, Potassium, machine power, irrigation and management index have significant influence on yield of maize in less fluoride affected locale, while, seed rate, nitrogen, phosphorous, machine power and irrigation are significantly influence the yield of maize in moderately fluoride affected locale, in case of highly fluoride affected locale, seed rate, nitrogen, phosphorous, potassium and irrigation are significantly influencing the yield of maize, while, nitrogen, potassium, irrigation and management index are significantly influences the yield of maize in non affected locale. The study suggests that awareness of fluoride contamination and averting measures must be disseminated to the farmers.
Highlights
mIn Management index, Occupation and Land holding are positively correlated with crop yield in the study area.
mThe study concluded that highly fluoride affected farmers are technically less efficient than non affected farmers, less and moderately affected farmers.
Keywords: fluoride affected locale, Maize and technical efficiency
Groundwater is a prime source for human intake, agricultural and industrial uses in several regions around the globe (Kouras et al. 2007; Jalali and Ranjbar 2010). Because of inadequacy of surface water, groundwater contributes more to the necessity of human actions. The demand for quality water for irrigation of crops is ever increasing, whereas the availability of water remains comparatively constant in most parts of the world. Continuous depletion of groundwater increases global threats, including a sudden decline in agriculture (Aeschbach-Hertig and Gleeson 2012; Turner et al. 2019). This leads to contamination in groundwater such as fluoride discharge in water. Fluoride is one of the critical ions that influence groundwater quality.
of phosphatic fertilizer, pesticides in agriculture is the cause of fluoride contamination in groundwater (Ramesh and Soorya 2012; Ali et al. 2016; Mukherjee et al. 2018). In India, many states are affected with endemic fluorosis viz., Andhra Pradesh, Tamil Nadu, Karnataka, Gujarat, Rajasthan, Punjab, Haryana, Bihar and Kerala (CGWB, 2016). High concentration of fluoride is often above 1.5 mg/l, results in severe problems (Ramesh and Soorya 2012). Tamil Nadu is one among them, 23 out of 33 districts were affected by fluoride contaminated water. Salem, Erode, Dharmapuri, Coimbatore, Thiruchirapalli, Dindugal, Theni, Perambalur, Vellore, Madurai, Virudhunagar and Krishnagiri are subjected to fluoride contamination and the effects are with dental and skeletal fluorosis (CGWB, 2016). Maize is one of the cereal crop cultivated in India and Tamil Nadu. Maize is known as queen of cereals as it has highest yield potential. In India, maize is the third most important food crops after rice and wheat. It contributes about 10 per cent of total food grain production (APEDA 2015). In india, 15 million farmers are engaged in maize cultivation (FICCI 2018). The area under maize cultivation has increased at a CAGR of 2.5 per cent from 7.5 million hectare in 2004-05 to 9.4 million hectare in 2013-14, the further increase in production is due to increase in yield (Thomas et al. 2018). Farmers were continued to extract the groundwater for maize irrigation and this led to contamination of fluoride in groundwater in study area. Though there are several empirical studies on agriculture related to water pollution, there are only few studies dealt with problems in the agricultural sector caused by fluoride contamination in ground water. With this context, the present study has assessed the technical efficiency of maize production among fluoride affected and non affected locales of Tamil Nadu.
MATERIALS AND METHODS
Data Collection and SamplingMultistage random sampling method was used for the selection of study area. At first stage, District wise fluoride affected locales of Tamil Nadu with the permissible limit of above 1.5 mg/L were collected from central ground water board, 2014-15. In second stage, districts are segregated into different agro climatic zones based on fluoride content and finally, western zone was selected. At third stage, it was
classified into affected locale (highly, moderately and less fluoride affected locale) and non affected locale. From this two blocks from each of the locales, then three villages of each block were selected based on secondary data (Appendix-I). Finally, 120 samples was selected based on sample size methodology given by Yamane (1967).
Yamane Formula =
( )
1( )
2 N nN e
= +
Where: n = sample size; N = total number of farmers population (6021618); e = error limit/ level of precision of 5 % (0.05).
From the above sampling formula total required samples calculated is 399, but by considering time constraint along with convenience about 30 per cent i.e. 120 samples were preferred for the study.
Management Index used in Production Function
Following (Makary and Rees 1981), the management index was derived for this study. The management function (log-linear form) employed is as follows,
ln (Y) = b0 + b1 EXP + b2 EDU + b3 OCC + b4 LH + e Where,
Y = Yield (Kg per hectare)
EXP = Total farming experience in years
EDU = Education Dummy (=1, if secondary school and above and ‘0’ otherwise)
OCC = Occupation Dummy (=1, if agriculture as the primary occupation and ‘0’ otherwise)
LH = Land holding in ha. e = error term
Using the estimated coefficients of the function and the respective mean value of EXP, EDU, OCC and LH, the management index was worked out for all respondents, employing the following equation.
(
1 2 3 4)
1 2 3 4
i i i i
i
b EXP b EDU b OCC b LH MI
b EXP b EDU b OCC b LH
+ + +
=
+ + +
Where,
EXPi, EDUi, OCCi and LHi= the variables used in the ith farm
EXP, EDU, OCC and LH = the mean value of the sample farm
Further, the estimated management index was incorporated in the production functions.
Technical Efficiency
In order to study the technical efficiency, stochastic frontier production function was specified as given below.
The Stochastic Frontier
Stochastic frontier was first proposed by (Aigner et al. 1977; Meeusen and Van den Broeck 1977) to estimate technical efficiency of producers using parametric econometric approach. The stochastic frontier production is specified for cross sectional data with an disturbance/error term which has two components such as random effect and technical inefficiency (Coelli 1994).
The general form of stochastic frontier approach,
Yi = (Xikβ) eEi
Yi= Xik β + Vi – Ui
i = 1,2,…..n; k =1,2,……k; Where,
Yi is the dependent variable of the ith farm, X
i is
a vector of K × 1 inputs of the ith farm, β is an (K × 1) vector of unknown parameters and Eia farm specific disturbance term. The error term/ disturbance term includes random effects (Vi) are assumed to be independently distributed as N(0,
σ2U). Technical inefficiency (U
i) being a non-negative
random variables (Ui 0) and often assumed to be independently identically distributed.
The model specification form,
2 2 2
u v
σ =σ +σ 2 2
2 2
u u v
σ γ
σ σ
= +
σu2 = variance parameter that denotes deviation due
to inefficiency
σv2 = variance parameter that denotes deviation due
to statistical noise
σ2 = variance parameter that denotes that total
deviation from the frontier
γ = parameter range between 0 and 1
If gamma γ = 0, difference between yield obtained by the farmers and efficient yield is due to statistical noise.
If γ = 1, difference is purely due to inefficient use of technology
In this paper, parameters are analysed using maximum likelihood estimates with single step approach by following (Battese and Coelli 1995). For the present study, Cobb-Douglas production frontier using cross sectional data with half-normal distribution (Kaur et al. 2010; Shantha et al. 2012; Dhehibi et al. 2014; Singh et al. 2016) is employed. The general form is,
( ) (
)
0 1
n
i j ik i i
k
LnY β β Ln X V U
=
= +
∑
+ −Ln (Y) = β0 + β1 ln(X1) + β2 ln(X2) + β3 ln(X3) + β4 ln(X4) + β5 ln(X5) + β6 ln(X6) + β7 ln(X7) + β8 ln(X8) + β9 ln(X9)+ Vi – Ui
Ln (Yield) = β0 + 1β ln(Seed qty) + β2 ln(FYM) + β3 ln(N) + β4 ln(P) + β5 ln(K) + β6 ln(HL) + β7 ln(MP) + β8 ln (Irrigation) + β9 ln(MI) + Vi – Ui Y = Yield in number of kg per ha.
β1– β9 = Parameters to be estimated or production elasticities
X1 = Total number of planting material/ seed quantity (kg per ha.)
X2 = Quantity of farm yard manure applied (tonnes per ha.)
X3 = Quantity of total nitrogen applied (kg per ha.) X4 = Quantity of total phosphorus applied (kg per ha.) X5 = Quantity of total potassium applied (kg per ha.) X6 = Human labour (man days per ha.)
X7 = Machine power (hrs per ha.) X8 = Irrigation (m3 per ha.)
X9 = Management Index
The farm specific technical efficiencies (TEi) are computed by taking the exponentiation of the negative of ui, as per (Coelli 1995, Nasim Ahmad et al. 2018).
TE =
( )
exp(
( )
)
exp( )
exp exp
i i i
i
i i
x u y
u
x x
β
β β
−
= = −
RESULTS AND DISCUSSION
Management IndexManagement index was derived by dependent variable crop yield (Y) on independent variables such as farming experience, education, occupation and land holding. The estimated coefficients for the fluoride affected and non affected locales are presented in Table 1. Only two out of sixteen coefficients are non-significant. Farming experience is had positive correlation with crop yield expect for non affected locale. Head of household education had positive correlation with crop yield expect for highly fluoride affected locale. Occupation and Land holding are positively correlated with crop yield in the study area.
Technical Efficiency in Maize Production of Fluoride affected and Non affected Locale of Tamil Nadu
The stochastic parameter estimates obtained with regard to Maize crop in less fluoride affected locale are presented in Table 2.
The estimated lamda (λ) parameter is 2.598, which indicates that the total variance is mainly due to inefficiency, whereas random errors are less important. The percentage of total variance due to variation in efficiency is 87.096 per cent. The estimated variance for the variation in efficiency (sigma2u value) is equal to 0.108 which is considerably larger than the variation due to random errors of 0016 (sigma2v value).
Table 1: Estimated Parameters of Management Index for Fluoride Affected Locales and Non Fluoride Affected Locale
Parameter Less affected Moderately affected Highly affected Non affected
EXP 0.14*** (4.72) 0.43** (2.98) 0.23* (1.94) 0.45 (0.06)
EDU 0.07*** (3.85) 0.04** (2.67) 0.13 (0.42) 0.11** (2.73)
OCC 0.52*** (3.26) 0.21** (2.86) 0.17*** (3.81) 0.39*** (4.12)
LH 0.47** (2.84) 0.13** (2.24) 0.36*** (4.33) 0.53*** (3.97)
Constant 7.33 (1.48) 9.15** (2.43) 3.21 (0.55) 5.29** (2.34)
R2 0.74 0.68 0.81 0.79
Note: *** - Significant at 1 % level; ** - Significant at 5 % level; * - Significant at 10 % level; figures in parenthesis indicates t-value.
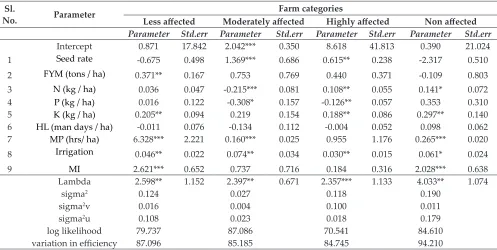
Table 2: Maximum Likelihood Estimates for Maize production in Fluoride affected and Non affected Locale of Tamil Nadu
Sl.
No. Parameter Less affected Moderately affectedFarm categoriesHighly affected Non affected
Parameter Std.err Parameter Std.err Parameter Std.err Parameter Std.err
Intercept 0.871 17.842 2.042*** 0.350 8.618 41.813 0.390 21.024
1 Seed rate -0.675 0.498 1.369*** 0.686 0.615** 0.238 -2.317 0.510
2 FYM (tons / ha) 0.371** 0.167 0.753 0.769 0.440 0.371 -0.109 0.803
3 N (kg / ha) 0.036 0.047 -0.215*** 0.081 0.108** 0.055 0.141* 0.072
4 P (kg / ha) 0.016 0.122 -0.308* 0.157 -0.126** 0.057 0.353 0.310
5 K (kg / ha) 0.205** 0.094 0.219 0.154 0.188** 0.086 0.297** 0.140
6 HL (man days / ha) -0.011 0.076 -0.134 0.112 -0.004 0.052 0.098 0.062
7 MP (hrs/ ha) 6.328*** 2.221 0.160*** 0.025 0.955 1.176 0.265*** 0.020
8 Irrigation 0.046** 0.022 0.074** 0.034 0.030** 0.015 0.061* 0.024
9 MI 2.621*** 0.652 0.737 0.716 0.184 0.316 2.028*** 0.638
Lambda 2.598** 1.152 2.397** 0.671 2.357*** 1.133 4.033** 1.074
sigma2 0.124 0.027 0.118 0.190
sigma2v 0.016 0.004 0.100 0.011
sigma2u 0.108 0.023 0.018 0.179
log likelihood 79.737 87.086 70.541 84.610
variation in efficiency 87.096 85.185 84.745 94.210
In less fluoride affected locale, it could be observed that the coefficient (production elasticity) of machine power and management index were found significant at one per cent level. The estimated production elasticity of machine power and management index were 6.328 and 2.621, respectively, which showed that every one per cent increase in machine power and management index would increase the per hectare yield of maize by 6.328 and 2.621per cent respectively. The coefficient of farm yard manure, potassium and irrigation were found significant at five per cent level. The production elasticity of farm yard manure, potassium and irrigation would increase the per hectare yield of maize by 0.371 per cent, 0.205 per cent and 0.046 per cent respectively. The estimated lamda (λ) parameter is 2.397, which shows that the total variance is mainly due to inefficiency, whereas random errors are less important. The percentage of total variance due to variation in efficiency is 85.185 per cent. The estimated variance for the variation in efficiency (sigma2u value) is equal to 0.023 which is considerably larger than variation due to random errors 0.004 (sigma2v value).
As regards moderately fluoride affected locale, the estimated coefficient of seed rate, nitrogen, machine power were found positive and significant at one per cent level. The estimated production elasticity of seed rate, nitrogen, machine power were 1.369, 0.215 and 0.160 respectively, which indicated that every one per cent increase in seed rate, nitrogen and machine power from the existing mean level would increase the per hectare yield of maize by 1.369 per cent, 0.215 per cent and 0.160 per cent. The coefficient of irrigation was found to be positive and significant at five per cent level. The production elasticity of irrigation would increase the yield by 0.074 per cent. The estimated coefficient of phosphorous was found to be statistically significant at ten per cent level. The production elasticity of phosphorous was negative. The coefficient of phosphorous was 0.308, which indicated that for every one per cent increase in phosphorous would decrease the yield per hectare of maize by 0.308 per cent.
The estimated lamda (λ) parameter is 2.357, which indicates that the total variance is mainly due to inefficiency, whereas random errors are less important. The percentage of total variance
due to variation in efficiency is 84.754 per cent. The estimated variance for the variation in efficiency (sigma2u value) is equal to 0.018 which is considerably larger than variation due to random errors of 0.100 (sigma2v value).
Among highly fluoride affected locale, it could be inferred that the estimated coefficient of seed rate, nitrogen and potassium were positively significant at five per cent level. The estimated coefficient of the seed rate, nitrogen and potassium was 0.615, 0.108 and 0.188, respectively, which indicated that every one per cent increase in seed rate, nitrogen and potassium would increase the per hectare yield of maize by 0.615, 0.108 and 0.188 per cent respectively. The estimated coefficient of phosphorous and irrigation were found to be statistically significant at one per cent level. The production elasticity of phosphorous and irrigation were negative. The coefficient of phosphorous and irrigation were 0.126 and 0.030, which indicated that for every one per cent increase in phosphorous and irrigation would decrease the yield per hectare of maize by 0.126 and 0.030 per cent respectively.
The estimated lamda (λ) parameter is 4.033, which shows that the total variance is mainly due to inefficiency, whereas random errors are less important. The percentage of total variance due to variation in efficiency is 94.210 per cent. The estimated variance for the variation in efficiency (sigma2u value) is equal to 0.179 which is considerably larger than variation due to random errors of 0.011 (sigma2v value).
were 0.141 and 0.061 respectively, which indicated that every one per cent increase in the quantity of nitrogen and irrigation used from the existing mean level would increase the maize yield by 0.141 and 0.061 per cent respectively.
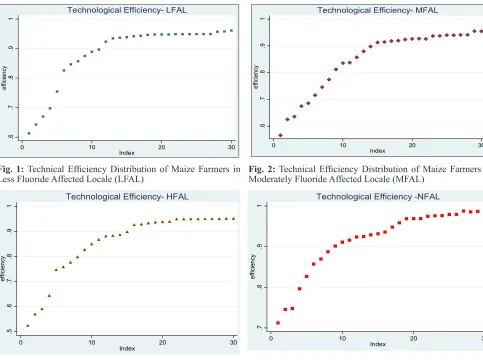
Technical Efficiency Distribution of Maize Farmers in Fluoride Affected and Non Affected Locale
The technical efficiency distribution of maize farmers in fluoride affected and non affected locale is presented in Table 3 and shown in Fig. (1,2,3 and 4). The variation in the levels of efficiency of maize growers in less fluoride affected locale ranged from 61.00 to 99.99 with mean technical efficiency of 88.40 per cent. The mean level of technical efficiency indicated that on an average 11.60 per cent of the maize growers falling short of the maximum possible level of technology.
Table 3: Technical Efficiency Distribution of Maize Farmers in Fluoride Affected and Non Affected
Locale in Tamil Nadu
Frequency Less
affected
locale
Moderately
affected
locale
Highly
affected
locale
Non
affected
locale <50 0 (0.00) 0 (0.00) 0 (0.00) 0 (0.00) 51-60 0 (0.00) 1 (3.33) 3 (10.00) 0 (0.00) 61-70 4 (13.34) 4 (13.33) 1 (3.33) 0 (0.00) 71-80 1 (3.33) 3 (10.00) 4 (13.33) 4 (13.33) 81-90 6 (20.00) 6 (20.00) 7 (23.34) 4 (13.33) >91 19 (63.33) 16 (53.34) 15 (50.00) 22 (73.34) Total 30 (100.00) 30 (100.00) 30 (100.00) 30 (100.00)
MTE 0.884 0.848 0.853 0.915
Note: MTE: Mean Technical Efficiency.
Figures in the parenthesis represent percentage to the total
Therefore it is possible to increase the maize yield by 11.60 percent of maize growers on an average
.6
.7
.8
.9
1
ef
fic
ien
cy
0 10 20 30
Index
Technological Efficiency- LFAL
.6
.7
.8
.9
1
ef
fic
ien
cy
0 10 20 30
Index
Technological Efficiency- MFAL
Fig. 1: Technical Efficiency Distribution of Maize Farmers in
Less Fluoride Affected Locale (LFAL) Fig. 2:Moderately Fluoride Affected Locale (MFAL) Technical Efficiency Distribution of Maize Farmers in
.5
.6
.7
.8
.9
1
ef
fic
ien
cy
0 10 20 30
Index
Technological Efficiency- HFAL
.7
.8
.9
1
ef
fic
ien
cy
0 10 20 30
Index
Technological Efficiency -NFAL
Fig. 3: Technical Efficiency Distribution of Maize Farmers in
by adopting the similar technology used by the best performers. 63.33 percent of the farmers belonged to the more efficient category (> 91 per cent), 20.00 per cent belong to most efficient category (81-90 per cent) and 13.34 per cent of them belonged to the medium efficient category (61-70 per cent) and 3.33 percent of them belonged efficient category (71-80 per cent).
As regards moderately fluoride affected locales, it could be seen from the table that the efficiency of maize growers had a mean technical efficiency of about 84.80 per cent. It implies that the yield of maize can be increased to 15.20 per cent only by increasing the efficiency of these production systems with no additional inputs. Majority of farmers (53.34 per cent) achieved a technical efficiency above 90 per cent followed by 20.00 per cent of farmers falling in the technical efficiency range of 81-90 per cent, 13.33 per cent of the farmers falls in the efficiency in the range of 61-70 per cent and remaining 10.00 per cent of the farmers were in the range of 71-80 per cent. Among highly fluoride affected locale, the average technical efficiency estimated was 85.30 per cent indicating that output can be raised by 14.70 per cent by efficient crop management practices without having to increase the level of application of inputs. Out of 100 per cent, 50.00 per cent of farmers falls under the range of above 91.00 per cent. Nearly 23.34 per cent of farmers are seen under the range of 81-90 per cent followed by 13.33 per cent of farmers in the efficiency range of 71-80 per cent, 10.00 per cent of farmers falls in the efficiency range of 51-60 and the rest 3.33 per cent of the farmers were in the range of 61-70 per cent.
In the case of non affected locale, the efficiency of maize growers had a mean technical efficiency of about 91.50 per cent. It implies that the yield of maize can be increased to 8.50 per cent only by increasing the efficiency of the production systems with no additional inputs. Majority of farmers (73.34 per cent) achieved a technical efficiency above 90 per cent followed by 13.33 per cent of farmers falling in the technical efficiency range of both 81-90 per cent, and 71-80 per cent.
CONCLUSION
From the results of the study it is concluded that, FYM, Potassium, machine power, irrigation and
management index were significantly influencing the yield of maize in less fluoride affected locale, while, seed rate, nitrogen, phosphorous, machine power and irrigation were significantly influencing the yield of maize in moderately fluoride affected locale. In case of highly fluoride affected locale, seed rate, nitrogen, phosphorous, potassium and irrigation are significantly influence the yield of maize, while, nitrogen, potassium, irrigation and management index were significant factors which influence the yield of maize in non affected locale. Moreover in moderately and highly fluoride affected locale maize farms may reduce the usage of phosphorous to get more yield, since the variable is negative. Hence, the study concluded that highly fluoride affected farmers are technically less efficient than non affected farmers, less and moderately affected farmers. The study suggests that awareness on fluoride contamination and averting measures must be disseminated to the farmers.
ACKNOWLEDGEMENTS
Authors express their gratitude to Indian Council of Social Science Research, New Delhi, India for providing Doctoral fellowship to carry out research to the first author. We would like to extend our thanks and appreciation to all the farmers who participated in the individual interview.
REFERENCES
Aeschbach-Hertig, W. and Gleeson, T. 2012. Regional strategies for the accelerating global problem of groundwater depletion. Nature Geoscience,5(12): 853. Agricultural and Processed Food Products Export
Development Authority, 2015. http://apeda.gov.in/ apedawebsite/SubHead_Products/Maize.htm.
Aigner, D., Lvell, C. and Schmidt, P. 1977. Formulation and estimation of stochastic frontier production function models. Journal of Econometrics,6(2): 21-37.
Ali, S., Thakur, S.K., Sarkar, A. and Shekhar, S. 2016. Worldwide contamination of water by fluoride. Environmental Chemistry Letters,14: 291–315.
Battese, E. and Coelli, T. The Model for Technical Efficiency effect in a Stochastic Frontier Production Function for pannal data. Empirical Economics,20: 325-332. 1995. Central Groundwater Board. 2016. “Groundwater Scenario
of India”, 2015–16.
Coelli, T. 1995. Recent Development in Frontier Modeling and efficiency Measurement. Australian Journal of Agricultural Economics,39(3): 15-26.
Dhehibi, B., Aw-Hassan, A., Alimari, A. and Haddad, N. 2014. Technical Efficiency and Its Determinants in Food Crop Production: A Case Study of Farms in West Bank, Palestine,16: 717-730.
FICCI. 2018. http://ficci.in/spdocument/22966/India-Maize-Summit.pdf.
Jalali, M. and Ranjbar, F. 2010. Aging effects on phosphorus transformation rate and fractionation in some calcareous soils. Geoderma,155(1-2): 101-106.
Kaur, M., Mahal, A.K., Sekhon, M.K. and Kingra, H.S. 2010. Technical efficiency of wheat production in Punjab: A Regional Analysis. Agricultural economics research review, 23(347-2016-17029), 173.
Kouras, A., Katsoyiannis, I. and Voutsa, D. 2007. Distribution of arsenic in groundwater in the area of Chalkidiki, Northern Greece. Journal of Hazardous materials,147(3): 890-899.
Makary, S.R. and Rees, H. 1981. An index of management efficiency for Egyptian agriculture: a case study of large farms. Journal of Agricultural Economics,32(2): 189-196. Meeusen, W. and van den Broeck, J. 1977. Efficiency estimation
from Cobb-Douglas production functions with composed error. International economic Review,18: 435-444.
Mukherjee, I. and Singh, U.K. 2018. Groundwater fluoride contamination, probable release, and containment mechanisms: a review on Indian context. Environmental geochemistry and health,40(6): 2259-2301.
Nasim Ahmad, Sinha, D.K. and Singh, K.M. 2018. Productivity and Resource Use Efficiency in Wheat: A Stochastic Production Frontier Approach, Economic Affairs, 63(3): 611-616.
Ozsvath, D.L. 2009. Fluoride and environmental health: A review. Reviews in Environmental Science & Biotechnology, 8: 59–79.
Pickering, W.F. 1985. The mobility of soluble fluoride in soils. Environmental Pollution (Series B),9: 281–308.
Ramesh, K. and Soorya, V. 2012. Fluoride contamination in drinking water in palacode region, Tamil Nadu. Int. J. Res. Chem. Environ.,2: 116-123.
Shantha, A., Ali, B.G.H. and Bandara, R.A.G. 2012. Efficiency and managerial ability of paddy farming under minor irrigation conditions: a frontior production function approach. Journal of Agricultural Sciences–Sri Lanka,7(3). Singh, U., Singh, R.B. and Gautam, S.S. 2016. Comparison
of Technical Efficiency of Soybean Farmers in Madhya Pradesh. International Journal of Agricultural and Statistical Sciences, 12(1): 223-228.
Thomas Felix, K., Murali Gopal, S., Ashok, K.R., Panneerselvam, S. and Duraisamy, M.R. 2018. Technical efficiency of maize production in different vulnerable agro-climatic zones of Tamil Nadu. Journal of Pharmacognosy and Phytochemistry, 7(4): 498-502.
Turner, S.W., Hejazi, M., Yonkofski, C., Kim, S.H. and Kyle, P. 2019. Influence of Groundwater Extraction Costs and Resource Depletion Limits on Simulated Global Non renewable Water Withdrawals Over the Twenty-First Century. Earth’s Future,7(2): 123-135.
World Press. 2017. https://socialissuesindia.wordpress. com/2017/12/27/alarming-fall-in-groundwater-levels-in-india/
To fulfil the objective, area selected for the study was based on secondary data obtained from Ground water year book; Tamil Nadu (2014-15). Sample area was selected based on the following criteria.
1. District wise fluoride affected area of Tamil Nadu with the permissible limit of 1.5 mg/L is shown in Table 1.
Sl. No. District Block Fmg/L
1 Coimbatore 1. P.K. Palayam 1.60
2 Dharmapuri 1. Nagadasampatt 1.80
2. Thoppur 1.70
3 Dindigul 1. Thoppampatti 1.97
2. Natham 1.78
3. Dindigul 1.65
4 Erode 1. Athani 1.95
2. Ammapet 1.86
3. Bangalapudur 1.65
5 Namakkal 1. Mohanpur 1.59
6 Perambalur 1. Kunnam 1.76
7 Pudukkottai 1. Viralimalai 1.65
2. Rattumavadi 1.54
8 Ramnad 1. Bogalur 1.72
9 Salem 1. Akkaraikadu 1.80
2. S.K. Garden 1.70
3. Idapadi 1.60
10 Sivagangai 1. Manakudi 1.64
2. Chettinad 1.55
11 Theni 1. Andipatti 1.56
12 Tirunelveli 1. Ambasamudram 2.14
2. Vasudevanallur 1.56
13 Tuticorin 1. Kalungumalai 1.65
2. Kallurani 1.54 14 Villupuram 1. Villupuram 1.55
15 Virudhunagar 1. Tamilpadi 1.58
Source: Ground water year book, Tamil Nadu (2014-15)
2. Based on the above table (Table 1) the various district has been segregated into different agro
Appendix-I
climatic zone shown in Table 2 and further mean value for fluoride content for each zone was occupied finally zone with highest mean value i.e. western zone was selected.
Sl.
No. Zone F mg/L (Average)
1 North Eastern Zone 1.55
2 North Western Zone 1.68
3 Western Zone 1.71
4 Cauvery Delta Zone 1.60
5 Southern Zone 1.67
3. From the Western Zone of Tamil Nadu, Fluoride Contaminated Ground Water blocks was selected and furnished in Table 3.
Sl. No. District Block Fmg/L
1 Coimbature 1. P.K.Palayam 1.60
2 Dindigul
1. Thoppampatti 1.97
2. Natham 1.78
3. Dindigul 1.65
3 Erode
1. Athani 1.95
2. Ammapet 1.86
3. Bangalapudur 1.65
4 Perambalur 1. Kunnam 1.76
5 Theni 1. Andipatti 1.56
4. Finally for clear picture of study area class interval for fluoride content was taken and blocks were classified into low, medium and high accordingly given in Table 4. Further From each classification two blocks was purposively selected.
Classification Fluoride Affected Area Class
Interval Low (a) Andipatti, (b) P.K. Palayam,
(c) Dindigul, (d) Bangalapudur
1.59 – 1.69
Moderate (a) Kunnam, (b) Natham 1.69 – 1.83 High (a) Thoppampati, (b) Athani,
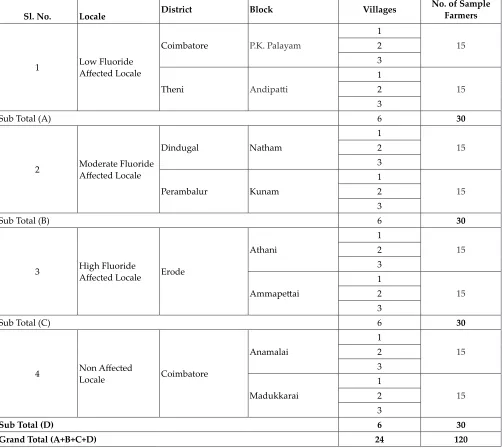
5. List of selected villages and farmers is furnished in Table 5.
Table 5: Distribution of sample respondents in study area
Sl. No. Locale District Block Villages
No. of Sample
Farmers
1 Low Fluoride Affected Locale
Coimbatore P.K. Palayam
1
15
2 3
Theni Andipatti
1
15
2 3
Sub Total (A) 6 30
2 Moderate Fluoride Affected Locale
Dindugal Natham
1
15
2 3
Perambalur Kunam
1
15
2 3
Sub Total (B) 6 30
3 High Fluoride Affected Locale Erode
Athani
1
15
2 3
Ammapettai
1
15
2 3
Sub Total (C) 6 30
4 Non Affected Locale Coimbatore
Anamalai
1
15
2 3
Madukkarai
1
15
2 3
Sub Total (D) 6 30