Characterizing The Difficulty In Fraction Operation
Ray Ferdinand M. Gagani, Felix M. Diano Jr
College of Teacher Education, Cebu Normal University Osmeña Blvd, Cebu City, Philippines, 6000
http://orcid.org/0000-0003-4407-0601
College of Teacher Education, University of the Visayas Corner D. Jakosalem and Colon St, Cebu City, Philippines, 6000
http://orcid.org/0000-0002-7015-78772
Abstract: Learning fractions are one of the mathematics fundamentals that students must possess; however, many students impartially understand in applying its procedural mechanism and the essential concepts needed to implement it in making sense to quantifiable ideas entirely. This descriptive study is a blend of exploratory and comparative procedures that investigated the forty-seven 8th-grade public night high school students’ possible difficulty levels in operating fractions as the function of their procedural and conceptual understanding applied to addition, multiplication and division. Students’ scores are subjected to hierarchical cluster analysis and revealed three (1,2,3) clustering. Performance indexes on procedural expertise and conceptual facility generated the three thinking levels (0, 1, and 2) of hypothesized difficulties. The procedural and conceptual indexes levels impacted the performances in each cluster; the higher the indexes are, the higher the performances. The procedural and conceptual thinking levels were further hypothesized to have other levels of difficulty that characterizes misconception.
Keywords: conceptual knowledge, difficulty levels; operations on fraction; procedural knowledge
1.
Introduction
Fractions have a central role in a mathematics learning [1], [2] and learning with it predicts mathematics gain [3]; empirically on solving Algebraic equation (e.g. [4], [5], & [6]); and it lays the foundation towards studies of Algebra, ratios, and proportions [7]. However, children encounter fractions as the most complicated mathematical concepts in primary and even in their middle years in school [8], [9]; and particularly challenging to translate; teach and learn its sense [10], [11] ; and is difficult to comprehend [12]. Even to some adults and elementary teachers, fractions pose hurdles to them [13], [14]. For these, it continues to pose challenges in mathematics education at all levels [15]. School children’s mathematical maturation can be severely affected by their learning of fractions [16], [9]. The learning of rational numbers including fractions and its operations is essential to k-12 mathematics curriculum [17] Many learners in the primary and to some extent to secondary education do not fully master the conceptual underpinning of fraction [18] and for this, it has posed a severe issue for the primary and middle school students [19], [20]. Similarly, primary grades and even adult individual fail to perform basic arithmetic operations and a problem-solving involving fraction [21], [1] A possible reason for such difficulty is due to the failure of understanding that not all properties of whole numbers are universally true to all real numbers and the only unifying feature for them is that they have an ordered magnitude in the number line [2]. Barriers such as treating the numerator as a counting number and as a single entity (ignoring the denominator and the related whole), and the failure to realize that the numerator and the denominator works together to determine the fractions’ magnitude [14], [22], [6] are also considered possible reasons. Additionally, it is conceptually and representationally complex [23] and eventually needs in-depth conceptual knowledge of the part-whole relationship [24]. Moreover, Lewis [23] noted that the mathematical learning difficulty regarding fraction is due to the complexity
learning by the procedural rule that is applied to symbolic
manipulation, while the conceptual approach provides an avenue for students’ exploration of the meaning of the operation. The procedural approach will result in the “knowledge on how to do” also known as the procedural knowledge or the kind that involves sequences of action for solving problems [28]. The procedural approach is the familiarity of conventional mathematical algorithms like performing step-by-step procedures (Hiebert and Lefevre, 1986, in [11]). On the other hand, the conceptual approach builds conceptual knowledge-relationships among items of knowledge [28]. This approach can heighten the implicit and explicit attainment of the understanding of the principles and the interrelations between and among the bits of academic knowledge in a specific domain. The second approach builds conceptual understanding as a connective web of knowledge [11]. Studies that examine the mentioned forms of knowledge on rational numbers (fraction) aim at answering which develops first and which one is essential over one type [11]; [29]. Newton [11] declares that it is definitional and measurement inconsistencies most notably to the predictors of the conceptual knowledge development. For Schneider, et al., [29] the two are bi-directional and could support one form from each other and goes hand in hand in developing procedural flexibility. One study of Silver (1986) revealed by Newton, [11] empirically justify the link between the two types of knowledge. Silver found out the procedural difficulty in performing addition of fraction among 200 pre-service teachers, is linked to and supported by incorrect conceptual understanding. Different studies attested that children's early mathematics knowledge is a strong determinant of mathematical success [30]. Nevertheless, numerical (number knowledge) and mathematical competencies were also predictors of fraction concepts while domain-general skills (nonverbal reasoning, language, attentive behavior, executive control, visual-spatial memory) supported the acquisition of fractions concepts [31]. It may imply that difficulty in some students in the secondary or postsecondary level in learning fraction as conceptual knowledge may or may not predict their performance in operating with fractions. Hence, other factors like mathematical competencies and domain-general competencies can contribute to concept formulation and development. Additionally, instructional language has an effect to the comprehension of fractional numbers [17]. Many theorists have investigated the importance of both procedural and conceptual understanding of fractions, but the further exploration on assessing and characterizing high school students’ thinking that uncovers difficulty levels in operations of fractions, as a function of the procedural and conceptual knowledge is not so much evident in the literature. For this, we examined the possible levels of difficulty that characterizes students thinking when operating fraction. Thus, this educational work provided a characterization of students thinking levels under addition, multiplication, and division of a fraction. Specifically, it examines the student’s procedural and conceptual indexes in these operations, determines if theoretical knowledge predicts procedural performance, and lastly determines new levels according to demonstrated solution processes and explanations. We claim that students operate a fraction at
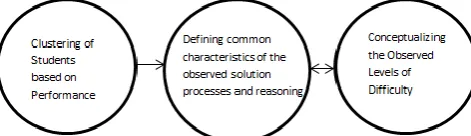
different levels of understanding and that knowing the current level of the procedural skill and its underpinning conceptual facility under the said operations of fractions will help serve as the basis for designing the right classroom episode. We further believe that it will help teachers construct the developmentally appropriate instructional material needed for learning fractions and their operations. Moreover, the generated knowledge of this study can also extend our understanding as to why the misconception of operations of fractions continues. Figure 1 models the processes of identifying the levels of difficulty related to operations of fractions after the data gathering and the checking of the solution processes.
Figure 1 A process model of determining the difficulty levels of difficulty
2.
Methodology
Procedures and Techniques
This is a descriptive study into knowing the student's levels of thinking and difficulties through exploratory data analysis and descriptive-comparative procedures. Exploratory analysis using the common characteristics of students’ solution processes and reasoning is used to establish grounds in describing the levels qualitatively. The descriptive – comparative analysis technique is used to capture significant differences between the identified clusters of students based on group performances. The following processes are done: 1. The percentage of correct response was summarized (this was done to know if there exists difficulty). 2. The dataset distribution was checked for normality checking. 3. The grouping of the respondents using the Hierarchical cluster analysis with Wards method as algorithm procedure, and squared Euclidean distances as a similarity measure was conducted. 4) Comparing the performance level by analyzing the procedural and conceptual understanding of the respondents follows.
Research Environment and the Respondents
The conduct of the study was in a government school in Lapu-Lapu City, Philippines. Written permission from the school's division superintendent and the school principal before the conduct of the study was secured. There were forty-seven 8th grade student participants included in this research effort.
Research Instrument
their solution and then explain their thinking according to
their solution.
Data-Gathering Procedure
Two prospective teachers were given instructions before the actual gathering of the data. The two were oriented on the following: 1. The preparation of the test questionnaire should be free from eye distractors such as ink, spill, and dirt; and should be readable. 2. The test questionnaire should have space for a solution demonstration. 3. To provide an extra sheet for the students' solution. 4.) To reiterate to the participants the objectives and use of the study; provide assurance of keeping their identity confidential, and to let them know that they can withdraw their participation should they want to; and 4.) assure that each of them has the signed informed consent; otherwise they will be excluded. During the conduct of the study; the research assistants established a friendly rapport with the respondents and prepared the class for the test. Only an hour is given to the participants to answer the tasks.
Quantitative Conceptualization
To give conceptual evidence of our claim, we conceptualized the framework below:
P e r f o r m a n c e ( P r o c e d u r a lU n d e r s a t n d i n g + C o n c e p t u a lU n d e r s t a n d i n g ) 2
L e v e l
that is each identified level is a function of students procedural and conceptual levels of understanding in operating fractions and can be mathematically represented by:
( )
( )
2
l l
p c
p P C
L ;
Where L is the level influenced by the procedural and conceptual levels. Therefore the level of difficulties can be identified by its procedural and conceptual appropriateness of the data set.
Data Analysis Exploration
Table 1
Summary of correct responses per item
Item No. No of Correct Responses Percentage
1 14 29.79%
2 16 34.04%
3 10 21.28%
4 4 8.51%
N=47
The data in table 1 shows difficulties in operating fractions. There were 70% of the respondents did not know to add similar fractions, and 65% did not remember to add dissimilar fractions. There was 21% correctly performed multiplication while 8% for the division. It implied various difficulties in operating fractions.
Clustering of Students
In this exploration, we used hierarchical cluster analysis (CA) with Wards Method and Euclidean distances as similarity measures to group the respondents into three
clusters. Our concern here is the possibility of differentiation of different clusters according to their misconception or difficulties.
3. Results and Discussion
Levels of difficulty in operating fractions and the level of Understanding
To determine the difficulty level in operating fractions, we used a binomial test, adjusting the DepEd standard of 75% into 50% passing mark. Table 2 summarizes the difficulty level in adding (items1 and 2), multiplying (item 3) and division (item 4) of fractions. As observed, no item was answered successfully by 50% of the respondents. By this means, difficulties in performing operations of fractions existed (Item 1, p<0.008; item 2, p<0.04; item 3, p<0.001, item 4, p< 0.001).
Table 2
Number of participants who pass or fail based on a 50% cut of mark Number of participants who pass or fail based on a
50% cut of mark a. Based on Z Approximation
b. Exact Results are provided instead of Monte Carlo for this test Note: 0 category means the participants who were not able to pass according to the 50% cut off passing mark; the number 1 represents the opposite. There were 47 participants
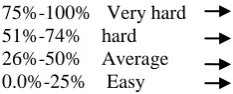
To establish the difficulty level, we used the frequency of the number of correct responses for each item against the following standards. To establish the difficulty level, we used the frequency of the number of correct responses for each item against the following standards.
75%-100% Very hard 51%-74% hard 26%-50% Average 0.0%-25% Easy
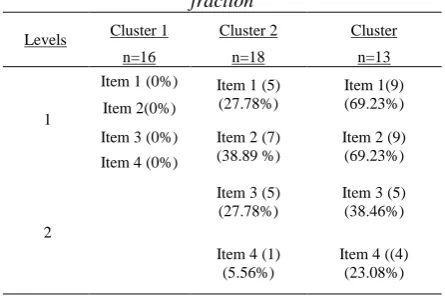
Table 2 shows that all of the items are very difficult for the student to answer. From this, we are sure that there are difficulty levels that characterize students thinking. To this end, we used the data from the CA to examine the developmental pattern of the students’ procedural ability to operate on fractions. Table 3 summarized their ability. The table also shows the item successfully answered by each cluster. In cluster 1 no student performed successfully the four items indicating their naïve skill.
Item no.
Category N Observed prop.
Test prop
Asymp. Sig.
(2-tailed)
Exact Sig. (2-tailed)
1 0 33 0.7 0.5 0.008 0.008
1 14 0.3
2 0 31 0.66 0.5 0.04 0.04
1 16 0.34
3 0 37 0.79 0.5 0.000 0.000
1 10 0.21
4 1 4 0.09 0.5 0.000 0.000
Table 3
The ability of students cluster in an operating fraction
Levels Cluster 1 Cluster 2 Cluster
n=16 n=18 n=13
1
Item 1 (0%) Item 1 (5) (27.78%)
Item 1(9) (69.23%) Item 2(0%)
Item 3 (0%) Item 2 (7) (38.89 %)
Item 2 (9) (69.23%) Item 4 (0%)
2
Item 3 (5) (27.78%)
Item 3 (5) (38.46%)
Item 4 (1) (5.56%)
Item 4 ((4) (23.08%)
In cluster 2, few members responded correctly in the four items. Cluster 3 on the other hand, 69% succeeded in operating items one and two but few on items three and four. The data suggested a developmental pattern in the respondents’ ability to operate on fractions because the success of the transition by the number of respondents in each class was associated with such success by more than the number of students in each subsequent class.
Qualitative Characterization of Developmental Levels
The finding supported the hypothesis that there are levels that characterize students’ ability to perform operations of fractions. As presented in table 3, no Cluster 1 student successfully operated addition, multiplication, and division of fractions. It indicated their insufficient skill. On the other hand, Cluster two and three students seem to perform the same tasks. However, cluster 3 students operated with greater accuracy in adding fractions than cluster 2. On the case of multiplying fractions clusters, two and three seemingly perform the same level of difficulty. Among the items, the division of fractions was seen as the most difficult to answer by groups two and three members. To this end, we examined further the students’ solution processes and their written explanation to characterize their thinking. Three levels are defined. We included level 0 since cluster 1 students did not answer correctly any of the items.
Level 0- at this level, students find difficulty operating
fractions. In performing addition to dissimilar fractions, their thinking is guided by the conception of adding two given numerators and denominators. They can't determine the concept of similar and dissimilar fraction. In the case of adding a similar fraction their thinking is guided by the idea of the so-called “cross multiplication.” In the case of multiplication, they multiply the numerator of one factor to the denominator of the second factor and repeat this procedure by multiplying the numerator of the second factor to the denominator of the second factor. In the case of division, level 0 students cannot recognize that division is the undo process of multiplication.
Level 1- students at level 1 shows a little understanding of
adding fractions but is misled by some aspects similar to level 0 thinking. The level1 thinking seems to depict student’s naïve attempt to add fractions. Many of the students attempted to add dissimilar fractions by changing them into its equivalent form, however, is distracted because of the lack of understating about similar fractions and LCM.
In the case of multiplication, students operating at this level have the conception that to multiply fraction is to multiply the numerators to the denominators. In the case of division, they exhibit the same thinking pattern similar to level 0 thinking.
Level 2- at this level, the students improved their
understanding of addition of fraction. They begin to establish the idea of similarity and dissimilarity of fractions. Their skill is much polished than in student operating at level 1thinking. They begin to connect ideas about LCM and used this in changing a dissimilar fraction to similar fractions. However, their skills in finding the LCM of the denominators of two given dissimilar fractions are not well polished. They still commit errors. In the case of adding similar fractions, although they started to distinguish the similarity of fractions, they always tend to cross multiply the numerators and denominators and then adding the products. Eventually, students operating at level 2 thinking don’t have enough understanding of multiplication and division of fractions. They still have the conception of cross-multiplying the numerators and denominators of two given fractions. Moreover, their thinking concerning dividing fraction is similar to student operating at level 1.
Quantitative description of conceptual performance level in operating fractions
We quantitatively gauge the conceptual underpinning of their solution based on the model below:
0 25 50 75 100 L 0 L1 L2 L3 L4
Fig.2. Gauge model for identifying conceptual performance in operating fractions
The conceptual levels are rated in this manner. Students at level 0 thinking have zero conceptual understanding and are mark 0 expressed in percent form. In L1, student knowledge is given 25% mark. At level 2, 50% is given to their conceptual understanding. Moreover, at level 3 thinking, 75% is for their conceptual understanding. At level 4, students have a full grasp of the conceptual knowledge in operating fractions and a 100% is given to it.
Performance level in operating fractions
With the initial findings, we finalized the level of performance and the difficulty of the students in performing operations of fractions based on the initial conceptualization of the level of performance. Table 4 presents the level of difficulty in operating fractions
Initial Concept
:
( )
( )
2
l l
p c
p P C
From the percentage of correct responses in each cluster, we computed the procedural index as follow.
n u m b e r o f c o r r e c t r e s p o n s e s P r o c e d u r a l in d e x =
n u m b e r o f in d iv id u a l in e a c h c lu s te r
Also, we get the mean procedural index since it has two cases. The computation is done in this manner:
1 2
p r o c In d x
+ =
2 In d e x In d e x M e a n
The Level of performance was calculated using :
P
( )
( )
2
l l pc
p P C
L
Level of Performance
Cluster 1
It was known that: Procedural index = 0 Conceptual Index = 0
P
0 + 0L = 0
2
It was true of all performance levels in the cases of cluster 1. Cluster 1 general performance is the mean of their performances depicted by the model:
, , )
= 3
( a m d
P L p p p
Cluster 2
The case of addition Procedural Index= 29.17% Conceptual Index=25%
P 2 1 .1 7 + 2 5 L = 2 9 .1 7
2
expressed in percent
The same procedures we applied for the remaining levels of performance for the other operations. It was carried in cluster three. The general level of performance in clusters two and three follow the same model:
, , )
= 3
( a m d
P L p p p
To summarize, level 1 is the highest general performance level that the respondents have responded. With these results, we further hypothesize that there are still possible levels that characterize students thinking when operating fractions.
4. Findings
4.1. Deep procedural and conceptual understating influence performance level. The level of performance is directly proportional to procedural and conceptual understanding. The high the procedural index and the high conceptual index impact on the overall performance. The converse is true. That is the insufficient procedural and conceptual indexes, and the low is the performance level.
4.2. Cluster 3 is the group with the highest performance level in adding fraction. They have better procedural and conceptual understanding in adding fractions than cluster two. This group has an advantage regarding procedural and conceptual knowledge than cluster two regarding addition. However, 30% of this group was seen not to have both types of knowledge. This was also the group which is a little bit better regarding their procedural knowledge in multiplication and division of fractions than cluster two. However, both cluster one and two exhibits level1 thinking in multiplying fractions. Concerning division, cluster 3 exhibit partial understanding and have tried to reach level 2 thinking.
4.3. Cluster one was the group who shows no procedural and conceptual knowledge. Hence, the level is zero. No knowledge in procedure at the same time no conceptual knowledge will have a substantial effect on difficulty.
4.4. Although cluster three, is more knowledgeable than cluster 2 in performing addition of fraction, the two perform at the same (level 1) based on the totality of their performances. However, cluster 3 almost reach level 2 (PLcl3=38.68% > PLcl2=23.61%.
4.5. There were three observed levels in the qualitative description of the students reasoning (levels 0, 1, and 2). This projected possible other levels that characterize students thinking in operating fractions.
5. Conclusion
this attempt is delimited only on grade 8 students at night
high school, whom some of them are working students.
References
[1]. Ndalichako, J. (2013). Analysis of Pupils’ Difficulties in Solving Questions Related to Fractions: The Case of Primary School Leaving Examination in Tanzania.
Creative Education, 4,
69-73.doi:10.4236/ce.2013.49B014
[2]. Siegler, R. S., Fazio, L. K., Bailey, D. H., & Zhou, X. (2013). Fractions: The new frontier for theories of numerical development. Trends in cognitive sciences, 17(1), 13-19.
[3]. Bailey, D. H., Hoard, M. K., Nugent, L., & Geary, D. C. (2012). Competence with fractions predicts gains in mathematics achievement. Journal of experimental child psychology, 113(3), 447- 455.
[4]. Booth, J. L., Newton, K. J., & Twiss-Garrity, L. K. (2014). The impact of fraction magnitude knowledge on algebra performance and learning. Journal of Experimental Child Psychology, 118, 110-118. [5]. Zientek, L. R., Younes, R., Nimon, K., Mittag, K. C., &
Taylor, S. (2013). Fractions as a foundation for algebra within a sample of prospective teachers. Research in the Schools, 20(1), 76-95. Retrieved from
https://search.proquest.com/docview/1549551718?accou nt =173015
[6]. Rodrigues, J., Dyson, N. I., Hansen, N., & Jordan, N. C. (2016). Preparing for algebra by building fraction sense. Teaching Exceptional Children, 49(2), 134-141. doi:http://dx.doi.org/10.1177/0040059916674326 [7]. Wilkins, J. L. M., & Anderson, N. (2018). Learning
progression toward a measurement concept of fractions. International Journal of STEM Education, 5(1), 1-11. doi:http://dx.doi.org/10.1186/s40594-018-0119-2 [8]. Newstead, K., & Murray, H. (1998). Young students'
constructions of fractions. In PME CONFERENCE (Vol. 3, pp. 3-295).
[9]. Charalambous, C. Y., & Pitta-Pantazi, D. (2005, July). Revisiting a theoretical model on fractions: Implications for teaching and research. In Proceedings of the 29th Conference of the International Group for the Psychology of Mathematics Education (Vol. 2, pp. 233240).
[10].Cramer, K. A., Post, T. R., & delMas, R. C. (2002). Initial fraction learning by fourth- and fifth-grade students: A comparison of the effects of using commercial curricula with the effects of using the rational number project curriculum. Journal for Research in Mathematics Education, 33(2), 111-144.
Retrieved from
https://search.proquest.com/docview/223492594?accou ntid=173015
[11].Newton, K. J. (2008). An extensive analysis of preservice elementary teachers' knowledge of fractions. American Educational Research Journal,
45(4), 1080-1110. Retrieved from
https://search.proquest.com/docview/200370080?accou nti d=141440
[12].Naiser, E. A., Wright, W. E., & Capraro, R. M. (2004). Teaching fractions: Strategies used for teaching fractions to middle grades students. Journal of Researchin Childhood Education, 18(3), 193-198. Retrieved from
https://search.proquest.com/docview/203889006?accou nti d=173015
[13].Fazio, L. K., Kennedy, C. A., & Siegler, R. S. (2016). Improving Children’s knowledge of fraction
magnitudes. PLoS One, 11(10)
doi:http://dx.doi.org/10.1371/journal.pone.0165243 [14].Gagani, R. F., Diano Jr, F. M., & Inocian, E. P. (2016).
Hypothesizing the Outcome of the EFA Goal No. 6 for 2015. University of the Visayas-Journal of Research, 10(1), 59-68.
[15].Aliustaoğlu, F., Tuna, A., & Biber, A. Ç. (2018). Misconceptions of sixth grade secondary school students on fractions. International Electronic Journal of Elementary Education, 10(5), 591-599. doi:http://dx.doi.org/10.26822/iejee.2018541308
[16].Wilkins, J. L. M., & Anderson, N. (2018). Learning progression toward a measurement concept of fractions. International Journal of STEM Education, 5(1),1-11. doi:http://dx.doi.org/10.1186/s40594- 018-0119-2
[17].Behr, M., Harel, G., Post, T. & Lesh, R. (1993). Rational Numbers: Toward a Semantic Analysis-Emphasis on the Operator Construct. In T. P. Carpenter, E. Fennema, & T.A. Romberg, (Eds.), Rational Numbers: An Integration of Research (pp. 13-47). NJ: Lawrence Erlbaum
[18].Often, E. A. (2016). Wholes, parts and quotients: Investigating children's reasoning on tasks involving fractions and fractional numbers (Order No. 10107166). Available from ProQuest Central; ProQuest
Dissertations & ThesesGl obal. (1787233740).
Retrieved from
https://search.proquest.com/docview/1787233740?acco unt id=173015
[19].Moss, J., & Case, R. (1999). Developing children's understanding of the rational numbers: A new model and an experimental curriculum. Journal for Research in Mathematics Education, 30(2), 122. Retrieved from https://search.proquest.com/docview/223493322?accou nti d=173015
[20].Saxe, G. B., Taylor, E. V., McIntosh, C., & Gearhart, M. (2005). Representing fractions with standard notation: A developmental analysis. Journal for research in mathematics education, 137-157.
[21].Nunes, T., Bryant, P., Hurry, J., & Pretzlik, U. (2006). Fractions: difficult but crucial in mathematics learning. Teaching and Learning Research Programme (TLRP) Research Briefing.
[22].Mukwambo, M., Ngcoza, K. & Ramasike, L.F. (2018). Use of angle model to understand addition and subtraction of fractions. Pedagogical Research, 3(1), 01. https://doi.org/10.20897/pr/85174
[23].Jordan, N. C., Resnick, I., Rodrigues, J., Hansen, N., & Dyson, N. (2016). Delaware Longitudinal Study of Fraction Learning: Implications for Helping Children With Mathematics Difficulties. Journal of Learning
Disabilities, 50(6), 621–630.
doi:10.1177/0022219416662033
[24].Lewis, K. E. (2014). Difference not deficit: Reconceptualizing mathematical learning disabilities. Journal for Research in Mathematics Education, 45(3), 351-396. Retrieved from
[25].Devika, R. (2016). Handling fractions and errors in
fractions. I-Manager's Journal on Mathematics, 5(3),
1- 7. Retrieved from
https://search.proquest.com/docview/1862113821?acco unt id=173015
[26].Rau, M. A., Aleven, V., & Rummel, N. (2017). Making connections among multiple graphical representations of fractions: Sense-making competencies enhance perceptual fluency, but not vice versa. Instructional Science, 45(3),
331-357.doi:http://dx.doi.org/10.1007/s11251-017- 9403-7 [27].Noura, K. (2009). Understanding fractions: what
happens between kindergarten and the army? In annualconference of The Mathematical Association of Victoria, Victoria, Australia.
[28].Gabriel F, Coché F, Szucs D, Carette V, Rey B and Content A (2013) A componential view of children's difficulties in learning fractions. Front. Psychol. 4:715. doi: 10.3389/fpsyg.2013.00715
[29].Bruce, C., Bennett, S., & Flynn, T. (2014). Fractions operations: Multiplication and Division literature review. Unpublished manuscript. Curriculum and Assessment Branch, Trent University, Ontario Ministry of Education, Ontario Canada. Retrieved from
http://www.edugains.ca/resourcesMath/CE/LessonsSup po rts/Fractions/FractionsOperations_M ultDivODA.pdf [30].Schneider, M., Rittle-Johnson, B., & Star, J. R. (2011).
Relations among conceptual knowledge, procedural knowledge, and procedural flexibility in two samples differing in prior knowledge. Developmental
Psychology, 47(6), 1525-1538.
http://dx.doi.org/10.1037/a0024997
[31].Bailey, D. H., Watts, T. W., Littlefield, A. K., & Geary, D. C. (2014). State and trait effects on individual differences in children’s mathematical development. Psychological science, 25(11), 2017-2026. Retrieved from
https://www.ncbi.nlm.nih.gov/pmc/articles/PMC429292 2/ pdf/nihms- 653416.pdf
[32].Vukovic, R. K., Fuchs, L. S., Geary, D. C., Jordan, N. C., Gersten, R., & Siegler, R. S. (2014). Sources of individual differences in children's understanding of fractions. Child development, 85(4), 1461- 1476.
Retrieved from
https://www.ncbi.nlm.nih.gov/pmc/articles/PMC410106 8/ pdf/nihms545227.pdf
Mr. Ray Ferdinand Gagani is a Doctor of Philosophy in Education major in Research and Evaluation candidate at the Cebu Normal University. He received his Bachelors and Masters of Arts degree in Education major in mathematics from the same university. Mr. Gagani is recently connected to the same university as a full-time college instructor at the same time as an Asst. Professor IV in graduate school. He has published research articles and co-authored a book for senior high school students. He is also involved in research
article reviewing. He was awarded as one of the outstanding teachers in 2016 by the Department of Education Lapu-Lapu City division.
Felix Mendoyos Diano Jr. is a full time College Research Coordinator, a part-time Mathematics Instructor and a Graduate School Professor in the University of the Visayas.
He graduated his Bachelor of Secondary Education major in Mathematics (Magna Cum laude) and Master of Arts in Education with concentration in Mathematics at the University of the Visayas (with research distinction). He is currently taking up Doctor of Philosophy major in Research and Evaluation at Cebu Normal University.