Sampling-Dependent Up-regulation of Gene Expression in
Sequential Samples of Human Airway Epithelial Cells
A
DRIANAH
EGUY,
1*B
EN-G
ARYH
ARVEY,
2*T
IMOTHYP O’C
ONNOR,
1N
EILR H
ACKETT,
3AND
R
ONALDG C
RYSTAL1,2,3As part of a study of in vivo gene expression levels in the human airway epithelium in response to chronic cigarette smoking, we have identified a number of genes whose expression levels are altered in a time-dependent fashion resulting from the procedure used to sample epithelial cells. Fiberoptic bronchoscopy and airway epithelium brushing were used to obtain independent samples from a single individual, 1st from the right lung, followed by sampling of the left lung. We observed that a specific subset of early response genes encoding proteins involved in transcription, signal transduction, cell cycle/growth, and apoptosis were significantly up-regulated in the left lung samples (the 2nd region to be sampled) compared with the right lung samples (the 1st region to be sampled). This response was due to the temporal nature of the sampling procedure and not to inherent gene expression differences between airway epithelium of the right and left lungs. When the order of sampling was reversed, with the left airway epithelium sampled 1st, the same subset of genes were up-regulated in the sam-ples obtained from the right airway epithelium. The time-dependent up-regulation of these genes was likely in response to the stress of the procedure and/or the anesthesia used. Sampling-dependent uncertainty of gene expression is likely a gen-eral phenomenon relevant to the procedures used for obtaining biological samples, particularly in humans where the sam-pling procedures are dependent on ensuring comfort and safety.
INTRODUCTION
The development of the technology of gene expression arrays has opened the possibility of assessment of the levels of mRNA for many genes from small samples (1-3). Inherent in the use of this biotechnology is the basic assumption that “real” gene expression exists, regardless of whether or not we observe it; that is, other than the variability in gene expression levels resulting from the inherent in vitro measurement technology, there is a “real” level of gene expression for the same population of cells within a given individ-ual. The focus of the present study is to describe an additional vari-able in the measurement of gene expression resulting from the sam-pling process, in which the timing of obtaining in vivo samples yields different values in the mRNA levels of a subset of genes mostly relevant to transcription, signal transduction, cell cycle/ growth, and apoptosis. Whereas our example is specifically related to sampling of the airway epithelium in humans, the sampling dependent superimposition of “uncertainty” of gene expression is likely applicable to assessment of gene expression in general.
Our laboratory is interested in cigarette smoking modifica-tions in the levels of gene expression in the human airway epithe-lium relevant to the development of major human airway dis-eases such as chronic bronchitis and bronchogenic carcinoma (4,5). Although experimental animal models can be used to eval-uate some aspects of the pathogenesis of these disorders (6-8), the ultimate goal is to understand disease pathogenesis in humans. In
this context, we have adapted the methodology of sampling the airway epithelium using fiberoptic bronchoscopy and brushing to collect pure samples of airway epithelium for gene expression studies using microarrays (9–11). This methodology routinely allows for collection of 106to 107airway epithelial cells of >99% purity. The fiberoptic bronchoscopy procedure requires mild, sys-temic, conscious sedation and local (nose, pharynx, vocal cords, trachea, and bronchi) anesthesia with a topical anesthetic. This is followed by the bronchoscopy procedure, in which a flexible fiberoptic bronchoscope is inserted through the mouth, passed through the vocal cords into the airways where the sampling is done by gliding a 1-mm brush along the epithelium to be sampled (10). The brush is withdrawn and the cells collected in a tube with media. After an aliquot is taken for cell number and morphology assessment, the mRNA is extracted and then handled as is typical for microarray studies (4,9–11).
The protocol for the procedure is to sample the airway epithe-lium of the right and left lung so that gene expression can be com-pared at 2 locations in the same organ in the same individual. Prior studies have demonstrated a remarkably close correlation of the same genes over time in the same individuals sampled over a period of months (4). On a global basis, when the entire set of genes on a chip is examined, the same is true between right and left lungs (4). However, when gene expression in right and left lung samples were assessed on a gene-by-gene basis, we recognized that there was a subgroup of genes that were consistently expressed at higher levels
1Department of Genetic Medicine, 2Division of Pulmonary and Critical Care Medicine, and 3Belfer Gene Therapy Core Facility, Weill
in the left (the 2nd site sampled) compared with the right (the 1st site sampled). Remarkably, when the order of sampling was reversed, with the left airway epithelium sampled 1st, the same subset of genes were up-regulated in the samples obtained from the right. Thus, while the mechanism of the up-regulation of these genes is unclear, it is clearly associated with the time of sample acquisition, likely caused by the stress of the procedure per se and/or the anes-thesia used. It is likely that sampling dependent “uncertainty” of the levels of expression of some genes is a general phenomenon relevant to the procedures used for obtaining biologic samples.
METHODS
Study Individuals
The study was approved by the Weill Cornell Medical College Institutional Review Board, and written informed consent was obtained from each individual prior to enrollment in the study. Two groups of individuals were recruited using advertisements in local newspapers: phenotypically normal nonsmokers and phenotypically normal chronic smokers with an approximate his-tory of 20 pack-year smoking, but no hishis-tory of current respira-tory tract infection, chronic bronchitis, or lung cancer.
To insure that both groups fit the enrollment criteria, individu-als underwent an initial screening evaluation that included a history of smoking habits, respiratory tract symptoms, and prior illnesses; a complete physical exam; blood studies; urine analysis; chest roentgenogram; electrocardiogram; and lung function tests. The blood studies included blood cell counts, coagulation parameters, serum electrolytes, liver and kidney function tests, serum evalua-tion for human immunodeficiency virus antibodies, hepatitis profile (A, B, and C), anti-nuclear antibodies, sedimentation rate, and rheumatoid factor. Screening evaluation relevant to smoking habits included the urinary levels of nicotine and its derivative cotinine and serum levels of carboxyhemoglobin. Upon completion of the baseline evaluation, all individuals who met the inclusion/exclu-sion criteria underwent fiberoptic bronchoscopy to obtain airway epithelial cells. Smokers were instructed not to smoke following the evening prior to undergoing bronchoscopy.
Collection of Airway Epithelial Cells
Fiberoptic bronchoscopy was performed to collect airway epithe-lial cells using methods developed in our laboratory to ensure the extraction of high quality RNA for gene expression analysis (4,9–11). A 1-mm disposable brush (Wiltek Medical Inc., Winston-Salem, NC, USA) was advanced through the working channel of the bronchoscope. The airway epithelial cells were obtained by gently gliding the brush back and forth on the airway epithelium 5 to 10 times in 10 different locations in the same general area. Two independent samples of airway epithelium were obtained from each individual, from the 3rd branching of the bronchi in the left and right lower lobes. For 20 individuals (13 smokers and 7 nonsmokers), samples were collected from the right lobe 1st and from the left lobe 2nd. In 4 additional nonsmokers, the order was reversed with airway epithelium collected from the left lobe 1st and then subsequently from the right lobe. The time elapsed in the process of obtaining airway epithelial cell samples from
sedation to last brush is as follows: from general sedation to administration of topical anesthesia (lidocaine) to the vocal cords, 6.0 ±1.8 min (mean ±SE); from passage of the fiberoptic bronchoscope through the vocal cords to obtaining the 1st brushes (right or left) 5.0 ±0.8 min; from starting the brushes on the 1st side to starting the brushes on the 2nd side, 12 ±2 min. The total time of the procedure, collecting airway epithelial cell samples from both sites (right and left) irrespective of the order, was 19 ±2.6 min.
The cells were detached from the brush by flicking into 5 mL of ice-cold LHC8 medium (Invitrogen, Carlsbad, CA, USA). An aliquot of 0.5 mL was kept for differential cell count. The remain-der (4.5 mL) was immediately processed for RNA extraction. Total cell number was determined by counting on a hemocytometer. Differential cell count (epithelial compared with inflammatory cells) was assessed on sedimented cells prepared by cytocentrifu-gation (Cytospin 11, Shandon Instruments, Pittsburgh, PA, USA) stained with DiffQuik (Baxter Healthcare, Miami, FL, USA). The samples from the right and left lungs were kept independent of each other throughout subsequent analyses. For a subset of 3 smokers and 3 nonsmokers, lung biopsy specimens were col-lected and processed for histological examination using hema-toxylin and eosin staining. The sections were evaluated for the presence of inflammatory cells, percentage of basal cells, goblet cells, and intermediate and ciliated cells.
Preparation of cDNA and Hybridization of cRNA
All analyses were carried out with the Affymetrix HuGeneFL chip using the protocols from Affymetrix (Santa Clara, CA, USA). Total RNA was extracted from the brushed cells using TRIzol (Invitro-gen Life Technologies, Carlsbad, CA, USA) followed by RNeasy (Qiagen, Valencia, CA, USA) to remove residual DNA, a proce-dure yielding approximately 2 µg from 106 cells. First-strand cDNA was synthesized using the T7-(dT)24primer (sequence 5′ -GGC CAG TGA ATT GTA ATA CGA CTC ACT ATA GGG AGG CGG-(dT)24-3′; high-performance liquid chromatography puri-fied from Oligos Etc., Wilsonville, OR, USA) and converted to double-stranded cDNA using Superscript Choice system (Invitro-gen Life Technologies). Double-stranded cDNA was purified by phenol chloroform extraction and precipitation, and the size dis-tribution was examined after agarose gel electrophoresis. This material was then used for synthesis of the biotinylated RNA transcript using the BioArray HighYield reagents (Enzo, New York, NY, USA), purified by the RNeasy kit (Qiagen) and frag-mented immediately before use. As specified by Affymetrix, the labeled cRNA was 1st hybridized to the test chip and then, when satisfactory, to the HuGeneFL GeneChip, for 16 h. The GeneChips were processed by the fluidics station under the control of the Microarray Suite software (Affymetrix) to receive the appropriate reagents and washes for detection of hybridized biotinylated cRNA and then manually transferred to the scanner for data acquisition.
Microarray Data Analysis
Microarray Suite software (version 5.1). Data analysis was carried out on all 48 microarrays representing the airway epithelium from the right and left lungs of the 24 individuals (7 nonsmokers and 13 smokers, for whom right airway epithelium was sampled 1st, and 4 nonsmokers for whom left airway epithelium was sampled 1st). The raw data was normalized using the GeneSpring software (Silicon Genetics, Redwood City, CA, USA). All 48 microarrays passed GeneSpring quality acceptance criteria. Normalization was carried out using the default normalization parameters recommended by the software, as follows: (1) per microarray sample, by dividing the raw data by the 50th percentile of all measurements; and (2) per gene, by dividing the raw data by the median of the expression level for the gene in all samples. Data from probe sets representing genes that failed the Affymetrix Detection criterion (labeled “Absent” or “A” or “Marginal” or “M”) in all 48 microarrays were eliminated from further assessment. All further analyses were carried out on the remaining 4427 genes selected using these criteria. Global expression analysis was carried out through hierarchical clustering with GeneSpring software using the Spearman correlation. Genes were categorized according to biological function using searches of the Affymetrix annotated databases (www.affymetrix.com) for the HuGeneFL chip and also searching public databases (for example, LocusLink, GenBank, and OMIM).
Statistical Analysis
The demographic data for nonsmokers whose right airway epithelium was sampled 1st (n= 7), smokers whose right airway epithelium was sampled 1st (n= 13), and nonsmokers whose left airway epithelium was sampled 1st (n= 4) were assessed for age, cell yield, % epithelial and non-epithelial cells using analysis of variance (ANOVA). Sex and race of the 3 groups were compared by Chi-square test. The initial identification of genes that were differentially expressed in the 2nd sample of airway epithelium compared with the 1st sample was conducted using the 20 indi-viduals whose right airway epithelium was sampled 1st. Com-parison of gene expression levels in the 2nd airway epithelium sample were compared with expression levels in the 1st sample by calculating the Pvalues using the paired Student t-test. Addi-tionally, the fold-change in expression levels between 1st and 2nd samples were calculated for each gene in each individual, and the mean fold change for each gene was calculated as the average fold change of all individuals. These analyses were done on the 4427 genes that passed the Affymetrix Detection criterion (labeled “Present”) in at least 1 microarray for the 20 individuals whose right airway was sampled 1st, and genes were identified as sig-nificantly up-regulated or down-regulated if they met the follow-ing 2 criteria: the calculated Pvalue of the paired Student t-test
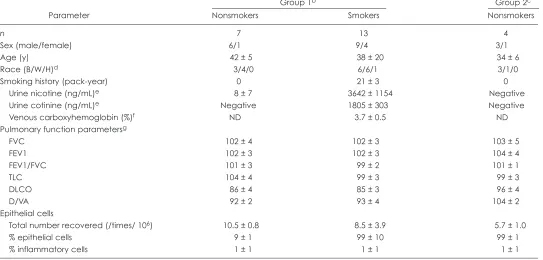
Table 1. Study population and airway epithelial samplesa
Group 1b Group 2c
Parameter Nonsmokers Smokers Nonsmokers
n 7 13 4
Sex (male/female) 6/1 9/4 3/1
Age (y) 42 ± 5 38 ± 20 34 ± 6
Race (B/W/H)d 3/4/0 6/6/1 3/1/0
Smoking history (pack-year) 0 21 ± 3 0
Urine nicotine (ng/mL)e 8 ± 7 3642 ± 1154 Negative
Urine cotinine (ng/mL)e Negative 1805 ± 303 Negative
Venous carboxyhemoglobin (%)f ND 3.7 ± 0.5 ND
Pulmonary function parametersg
FVC 102 ± 4 102 ± 3 103 ± 5
FEV1 102 ± 3 102 ± 3 104 ± 4
FEV1/FVC 101 ± 3 99 ± 2 101 ± 1
TLC 104 ± 4 99 ± 3 99 ± 3
DLCO 86 ± 4 85 ± 3 96 ± 4
D/VA 92 ± 2 93 ± 4 104 ± 2
Epithelial cells
Total number recovered (/times/ 106) 10.5 ± 0.8 8.5 ± 3.9 5.7 ± 1.0
% epithelial cells 9 ± 1 99 ± 10 99 ± 1
% inflammatory cells 1 ± 1 1 ± 1 1 ± 1
aDemographic characteristics of the 24 individuals in the study. The epithelial cell data represent the samples used for the 48 microarrays (2 per individual, 1 per right or left
lung). Data are presented as mean ± standard error. ND = not determined.
bSubjects whose right airway epithelium was sampled 1st. cSubjects whose left airway epithelium was sampled 1st. dB = Black; W = White; H = Hispanic.
eUrine nicotine and cotinine used as screen to ensure current smoking; > 200 = active smoker; 50 to 200 = passive smoker; < 50 nonsmoker. Data represent the mean of 2
determinations from the day of the initial screening and day of bronchoscopy. “Negative” = not detectable.
fDetermined for 8 of 13 smokers; venous carboxyhemoglobin was used as a secondary marker of current smoking; nonsmokers < 1.5%.
gPulmonary tests are expressed as percentage of predicted. FVC, forced vital capacity; FEV1, forced expiratory volume in 1 sec; TLC, total capacity; DLCO, total diffusion
was < 0.01 and the fold change between the 2 sequential samples was greater than 2.0. The ratio of expression levels in the 2nd sam-ple to that in the 1st samsam-ple was also determined separately for the smokers and nonsmokers whose right airway epithelium was sampled 1st. Smokers were compared with nonsmokers using a two-tailed Student t-test.
RESULTS
Study Population and Airway Epithelium Samples
The study population consisted of 2 groups that were based on the location that was sampled 1st by bronchoscopy and brushing: group 1 included 20 individuals whose right lung was sampled 1st, and group 2 included 4 individuals whose left lung was sam-pled 1st (Table 1). All individuals were determined to be pheno-typically normal based on standard history, physical exam, rou-tine blood and urine studies, chest X-ray, EKG, and pulmonary function tests. Urine nicotine, urine cotinine, and venous car-boxyhemoglobin levels verified that the individuals who gave a history of current smoking were current smokers and those reporting nonsmoking were nonsmokers.
The cells recovered by bronchial brushing contained 4 major epithelial cell types (ciliated, basal, secretory, and undifferentiated cells) and a small number of inflammatory cells (1 ± 1%, all groups). In all cases, >106epithelial cells were obtained, which is more than sufficient for the microarray analysis.
Global Assessment of Gene Expression
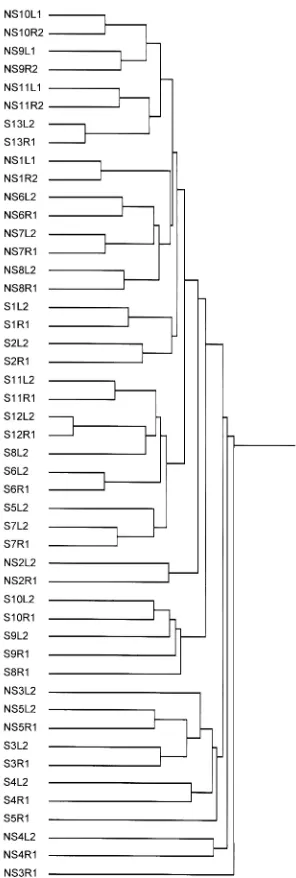
The human HuGeneFL microarray GeneChip has probe sets rep-resenting approximately 5000 human genes. For global gene expression analysis, the probe sets that were used were those identified as expressed (“Present,” as labeled by Affymetrix according to their expression-determining algorithm) in at least 1 microarray of the 48 microarrays included in the present study. 4427 probe sets were identified as expressed in at least 1 chip. A cluster analysis carried out using the normalized expression lev-els for all 4427 expressed probe sets did not segregate the indi-viduals whose right lung was sampled 1st (group 1) from those whose left lung was sampled 1st (group 2; Figure 1). As noted pre-viously, this type of analysis did not segregate the smokers from the nonsmokers (4). As expected, the inter-individual variability in global gene expression patterns was greater than intra-individual variability, as shown by the fact that samples from the right and left lungs of the same individual tended to cluster together.
Up-regulation of Specific Genes in Sequentially
Collected Samples of Airway Epithelium
Group 1 subjects were part of a study to evaluate the in vivo effects of cigarette smoking on airway epithelial gene expression in healthy smokers compared with nonsmokers (4). In this group, we routinely sampled the airway epithelium of the right lung 1st. After sampling in the right lung, the bronchoscope was posi-tioned in the left lung and samples were obtained by brushing. The right lung and left lung samples were processed independ-ently throughout the RNA extraction and labeling procedure with the purpose of utilizing them as biological and experimental
replicates in the subsequent microarray processing and data analy-sis. When intra-individual comparisons of gene expression levels in the right lung samples versus the left lung samples of 13 healthy smokers and 7 healthy nonsmokers were carried out using the paired Student t-test, a total of 23 genes were up-regulated >2-fold in the airway epithelium obtained from the left lung (2nd sampling
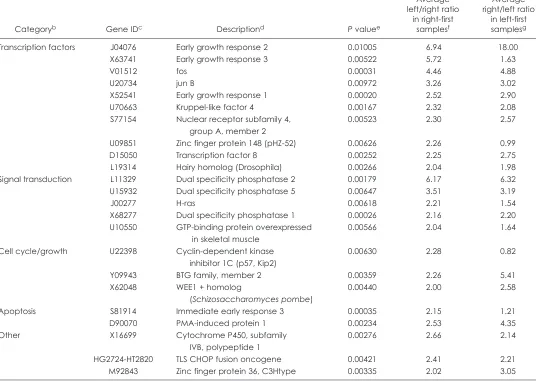
site) compared with that obtained from the right lung (1st sample site), with a Pvalue < 0.01 (Figure 2). These genes were grouped by general functional category using the annotations in the pub-lic genomic databases into 4 main categories: transcription factors, signal transduction, cell cycle/growth, and apoptosis (Table 2). Analysis of the available information regarding these genes showed that the majority of these genes are known to be tran-scribed early during cellular stress responses to various stimuli. Ten genes encode transcription factors known to be part of early stress cellular responses, 5 genes encode proteins or enzymes involved in signal transduction cascades. Three of the genes are involved in the regulation of cell cycle or cellular growth control and 2 related to apoptosis. Only 3 of the 23 up-regulated genes do not belong to any of these functional categories.
We hypothesized that these genes were up-regulated in the 2nd sample as a consequence of the temporal acquisition of the samples and not due to inherent differences in gene expression between the 2 lungs. The biological nature of the up-regulated genes (early stress response) pointed in that direction, because the delay in collection of the airway epithelium sample from the 2nd location would allow for the induction of transcription of these genes to occur and be reflected in increased mRNA levels for these genes. To test this hypothesis we recruited 4 additional indi-viduals (all healthy nonsmokers) and reversed the order of the procedure by sampling their left lung airway epithelium before proceeding to sample collection in the right lung. Remarkably, when the order of sampling was reversed, with the left airway epithelium sampled 1st, almost all of the same subset of genes were up-regulated in the samples obtained from the right lung airway epithelium (see Table 2, Figure 3). Specifically, 18 of 23 genes (76%) fulfilled the criteria of 2-fold up-regulation in the 2nd
sampling site compared with the 1st sampling site. Thus, the observed up-regulation in gene expression of this subset of genes is due to the timing of sample collection and not to real differ-ences in gene expression between the 2 lungs.
Because all the individuals that had their left lung sampled 1st were nonsmokers, we investigated whether smoking was a confounding factor by calculating separately the average left lung–to–right lung gene expression ratio for the 23 up-regulated genes for the 13 smokers and 7 nonsmokers in group 1. The aver-age ratios of left-to-right gene expression for nonsmokers ranged from 1.21- to 10.47-fold, with 1.21 being the only ratio <2-fold. The gene, zinc finger protein 148, was 1 of 6 genes that did not confirm the original observation when the sampling order was reversed (see Table 2). The average left-to-right gene expres-sion levels for the smokers ranged from 1.26 to 5.04. The differ-ences in the ratios of left-to-right expression levels between non-smokers and non-smokers were not significant for any of the 23 genes (Welch t test, assuming variances unequal; Pvalues 0.06 to 0.88). Thus, smoking is not a confounding factor in the observation of up-regulation of this specific subset of genes in sequentially obtained samples of airway epithelium.
To further illustrate the observation of temporal effects on the expression levels of specific early stress response genes in airway epithelium samples obtained sequentially by bronchoscopy, the normalized gene expression values of representative genes that were up-regulated in the airway epithelium of the 2nd sampling site were examined in all individuals involved in the study (20 individuals who had their right lung sampled 1st and 4 individu-als whose left lung was sampled 1st; Figure 4). The data demon-strate that most individuals show a higher level of expression of these genes in the airway epithelium of the lung that was brushed 2nd, regardless of whether it was the right or the left lung. As a control, 2 housekeeping genes commonly used as controls in gene expression studies, glyceraldehyde phosphate dehydrogenase, (GAPDH) and TATA-box binding factor IIB (TFIID), show the same level of expression in both lungs in most individuals, regardless of timing of sample collection (Fig. 4B).
DISCUSSION
The basic assumption of science that a “real world” exists independ-ent of us, regardless of whether or not we observe it, was challenged in 1927 by Werner Heisenberg in his paper “Über die Grundprinzip-ien der ‘Quantenmechanik’” (12). Generally called “Heisenberg’s uncertainty principle” or the “principle of uncertainty,” it articulates that every concept has a meaning only in the terms of the experi-ments used to measure it. Although Heisenberg was focused at the time on the fundamental question in physics regarding wave versus quantum mechanics, his principle that “the more precisely the posi-tion is determined, the less precisely the momentum is known in this instant, and vice-versa” (12) has evolved as a general concept regard-ing the limits of certainty. Fundamentally, the Heisenberg uncer-tainty principle states that an event comes into existence when we observe it (www.aip.org/history/heisenberg/).
The same basic assumption of reality is an inherent principle of assessment of gene expression. In this context, and in the
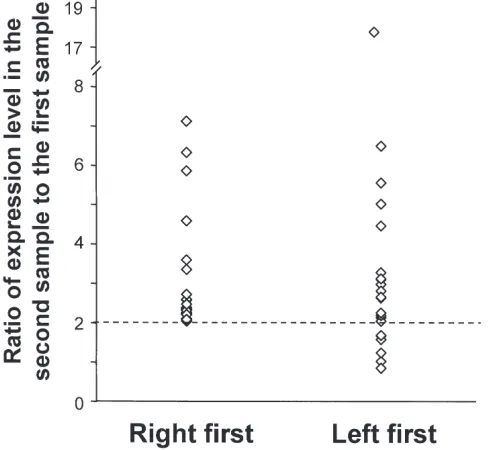
Figure 2.Statistical significance of genes up-regulated in the left airway epithelium compared with the airway epithelium of 20 healthy non-smokers and non-smokers in whom the right airway epithelium was sampled 1st. The Pvalues of the 267 genes that were up-regulated >2-fold in the left airway epithelium (sampled 2nd) compared with the right airway epithelium (sampled 1st) were calculated using the two-tailed Student
broader sense of the Heisenberg principle as alteration of an exper-imental scientific observation caused by the observer (or the pro-cedure performed by the observer), our observation of collection procedure-induced temporal differences in gene expression levels between samples collected from the right and left lungs reflects the general concept of the Heisenberg principle. In addition to the variability inherent in the methodology used to quantify gene expression such as the purity and quality of the RNA samples, and the variability in the microarrays and hybridizations per se, the present study illustrates a significant issue inherent in measuring gene expression in vivo, particularly in human samples, that is, the influence of the methodology used to obtain the biologic samples of interest. Importantly, the data demonstrates that, whereas
assessment of gene expression in a global level suggests minimal variability in airway epithelial samples taken sequentially from normal volunteers, assessment on a gene-by-gene basis demon-strates the genes that respond to stress, such as those involved in transcription, signal transduction, and cell cycle/growth and apoptosis, can be up-regulated as a function of time, likely due to the procedure inherent in the sampling process. This sampling-dependent uncertainty is likely a widespread phenomenon that is relevant to assessing gene expression in a variety of organs and circumstances, particularly in humans where the procedure per se is associated with some stress to the individual.
The majority of genes identified in the present study as up-regulated due to the sampling procedure belong to the functional
[
T
B
]
F
C
t
a
e
g
o
r
yb
Dc
I
n
e
G
e
o
nd
i
p
t
i
r
D
c
s
e
u
ee
l
a
P
v
sampl
st
ir
ght
esf
ri
-f
in
ght
at
io
Aver
ri
r
t/
lef
age
sampl
rst
fi
esg
t-
lef
in
io
Aver
rat
ght
ef
t
age
ri
/l
Average Average left/right ratio right/left ratio
in right-first in left-first
Categoryb Gene IDc Descriptiond Pvaluee samplesf samplesg
Transcription factors J04076 Early growth response 2 0.01005 6.94 18.00
X63741 Early growth response 3 0.00522 5.72 1.63
V01512 fos 0.00031 4.46 4.88
U20734 jun B 0.00972 3.26 3.02
X52541 Early growth response 1 0.00020 2.52 2.90
U70663 Kruppel-like factor 4 0.00167 2.32 2.08
S77154 Nuclear receptor subfamily 4, 0.00523 2.30 2.57
group A, member 2
U09851 Zinc finger protein 148 (pHZ-52) 0.00626 2.26 0.99
D15050 Transcription factor 8 0.00252 2.25 2.75
L19314 Hairy homolog (Drosophila) 0.00266 2.04 1.98
Signal transduction L11329 Dual specificity phosphatase 2 0.00179 6.17 6.32
U15932 Dual specificity phosphatase 5 0.00647 3.51 3.19
J00277 H-ras 0.00618 2.21 1.54
X68277 Dual specificity phosphatase 1 0.00026 2.16 2.20
U10550 GTP-binding protein overexpressed 0.00566 2.04 1.64
in skeletal muscle
Cell cycle/growth U22398 Cyclin-dependent kinase 0.00630 2.28 0.82
inhibitor 1C (p57, Kip2)
Y09943 BTG family, member 2 0.00359 2.26 5.41
X62048 WEE1 + homolog 0.00440 2.00 2.58
(Schizosaccharomyces pombe)
Apoptosis S81914 Immediate early response 3 0.00035 2.15 1.21
D90070 PMA-induced protein 1 0.00234 2.53 4.35
Other X16699 Cytochrome P450, subfamily 0.00276 2.66 2.14
IVB, polypeptide 1
HG2724-HT2820 TLS CHOP fusion oncogene 0.00421 2.41 2.21
M92843 Zinc finger protein 36, C3Htype 0.00335 2.02 3.05
aThe genes listed are the 23 genes that were expressed, on average, at more than 2-fold higher level in the airway epithelium of the left lung compared with the right lung
of each individual, using 20 individuals whose right lung was sampled 1st (P< 0.01 by paired t-test).
bCategories assigned are based on GenBank, PubMed, and literature searches. cGenBank or TIGR unique identifier.
dDescription is based on GenBank identifier together with PubMed, Locus Link, GenBank, and OMIM searches.
ePvalue was calculated based on 20 individuals (40 microarrays) whose right lungs were sampled 1st, using the paired Student t-test
fThe average ratio for the 20 individuals whose right lungs were sampled 1st was assessed as follows: the ratio of left airway epithelium to right airway epithelium expression
levels for all genes labeled “P” in at least 1 microarray were calculated for each individual, and then the average of all individual ratios for each gene was determined.
gThe average ratio for the 4 individuals whose left lungs were sampled 1st was assessed as follows: the ratio of left airway epithelium to right airway epithelium expression
category of early response genes that include transcription factors and signal transducers. Many of these genes have been identified by their ability to be rapidly induced by a variety of stresses and stimuli, including proliferation signals, and belong to a category known as immediate-early or early response genes (13–16). These include 3 members of the early growth response gene family (EGR1, EGR2, EGR3) of zinc-finger transcription factors that are rapidly induced by mitogenic stimulation, radiation, or hypoxia (17–21). EGR1 has been linked to the expression of several medi-ators, including platelet-derived growth factor and fibroblast growth factor-2, the mitogen-activated protein, extracellular sig-nal-regulated kinase, and c-junNH2-terminal kinase kinase path-ways (19). In the lung, we have previously reported that EGR1 is induced in lung growth responses within 2 h following postneu-monectomy in mice (22), and Yan and others (23,24) have demon-strated rapid induction of EGR1 in the lung within 30 min response to hypoxia. EGR1 also plays an important role in regu-lating macrophage differentiation in response to viral infections and inflammatory states (25-27) and is responsive to biomechani-cal stress, evidenced by rapid, transient EGR1 expression in endothelial cells in response to sheer stress (28).
Two other immediate early response genes, fos and jun, the transcription factors that dimerize to form the transcription factor complex as AP-1, were also identified as up-regulated in the 2nd sampling site in the airway epithelium. These transcription
fac-tors have been implicated as regulafac-tors of cell proliferation, dif-ferentiation, transformation, and apoptotic cell death (29). c-fos has also been described in several studies to be induced by lido-caine (30), the topical anesthetic used in the bronchoscopy proce-dure used in this study. The expression of c-fosand junBare up-regulated in the rat brain by general aesthetics, such as pentobarbital and halothane (31). c-junmRNA is also increased in rat heart, liver, and kidney by isoflurane and propofol, while c-fos expression is increased in the kidney by all 3 anesthetics (32). Together, these observations suggest the stress of anesthesia affects immediate early gene expression, but there are inter-anesthetic and inter-organ differences in the effect. Because immediate early response genes are induced by a myriad of external stimuli, including cytokines and other inflammatory mediators (33), it is
Figure 4.Expression of representative genes up-regulated in a statisti-cally significant fashion in the airway epithelium of 2nd brushed area compared with the 1st brushed area in individuals whose right lung was brushed 1st () and those whose left lung was brushed 1st (). A: Transcription factors c-fos, jun B, and 3 early growth response genes (EGR1, EGR2, and EGR3). B: Two signal transduction genes, dual speci-ficity phosphatases 2 and 5 (DUSP2 and DUSP 5); 1 gene involved in apoptosis, immediate early response 3 (IER3); and 2 examples of house-keeping genes, glyceraldehyde phosphate dehydrogenase (GAPDH) and TATA-box binding factor IID (TFIID), that did not show significant changes in expression levels between the 1st and 2nd brush in most indi-viduals. The ordinate represents the ratio of the expression level in the 2nd brushed area compared with the 1st brushed area.
not possible to determine whether the observed increase in these genes in the present study is due to the application of the local anesthetic lidocaine, to the mechanical or psychological stress of the procedure, or to systemic inflammatory events derived from the local epithelial desquamation.
We also observed up-regulation of 2 members of the dual specificity protein phosphatase (DUSP) subfamily, DUSP 2 and DUSP 5. These phosphatases inactivate their target kinases by dephosphorylating both the phosphoserine/threonine and phos-photyrosine residues (34). They negatively regulate members of the mitogen-activated protein (MAP) kinase superfamily (MAPK/ ERK, SAPK/JNK, p38), which are associated with cellular prolif-eration and differentiation (16,34). Different members of the fam-ily of dual specificity phosphatases show distinct substrate speci-ficity for various MAP kinases, different tissue distribution and subcellular localization, and different modes of inducibility of their expression by extracellular stimuli. For example DUSP-1 (also known as MKP-1) is induced by heat shock and oxidative stress in human skin cells (35), DUSP-2 by a variety of growth factors in human cell lines, while DUSP-5 expression is induced by stress stimuli such as anisomycin and osmotic stress in cultured cells and by inflammatory cytokines in human T cells in vitro (36–39). Our observations suggest that unidentified stress stimuli inherent to the bronchoscopy procedure are able to stimulate an increase in the expression of at least some members of this family of phoserine, phosphothreonine, and phosphotyrosine phos-phatases.
Regarding the possible mechanisms of induction of early response gene expression in the lung that is sampled 2nd (con-tralateral lung), in addition to psychological stress or effects of the anesthetic, all of which may be mediated by the central nervous system, the increase in gene expression levels in the contralateral lung could also be mediated by systemic inflammatory phenom-ena derived from the induction of the local injury caused by the brushing procedure and consequent accumulation of neutrophils and other inflammatory cells. In this context, our observations are similar to the neutrophil sequestration and injury observed in the “unchallenged” lung in focal HCl aspiration into one of the lungs in a rat model (40).
In conclusion, we have identified a new potentially confound-ing factor in studies of gene expression usconfound-ing microarrays. Specif-ically, we have demonstrated differential expression levels of sev-eral genes in samples of airway epithelium that were collected sequentially in each individual. These differences are not “real” in the sense of being inherent to the biological samples, but instead are the result of differences in the sampling protocol that are nec-essarily introduced to obtain the sample, particularly in humans.
ACKNOWLEDGMENTS
We thank M Harris for her assistance in the recruitment of volunteers for this study, K Luettich for microarray processing, and N Mohamed for help in preparing this manuscript. These studies were supported, in part, by P01 HL51746 Gene Therapy for Cystic Fibrosis CFF/NIH/NHLBI; Cystic Fibrosis Foundation (Bethesda, MD, USA); Will Rogers Memorial Fund (Los Angeles, CA, USA); and CUMC GCRC: NIH M01RR00047.
Address correspondence and reprint requests toDonald G Crystal, Department of Genetic Medicine, Weill Medical College of Cornell University, 515 East 71st Street, S-1000, New York, NY 10021. Phone: 212-746-2258; fax: 212-746-8383; e-mail: geneticmedicine @med.cornell.edu.
Submitted December 12, 2003; accepted for publication March 9, 2004.
REFERENCES
1. King HC, Sinha AA. (2001) Gene expression profile analysis by DNA microarrays: promise and pitfalls. JAMA286:2280-8.
2. Schulze A, Downward J. (2001) Navigating gene expression using microarrays— a technology review. Nat. Cell Biol. 3:E190-5.
3. Holloway AJ, van Laar RK, Tothill RW, Bowtell DD. (2002) Options available—from start to finish—for obtaining data from DNA microarrays II. Nat. Genet. 32 Suppl:481-9.
4. Hackett NR et al. (2003) Variability of antioxidant-related gene expression in the airway epithelium of cigarette smokers. Am. J. Respir. Cell Mol. Biol. 29:331-43. 5. Kaplan R, Luettich K, Heguy A, Hackett NR, Harvey BG, Crystal RG. (2003)
Monoallelic up-regulation of the imprinted H19 gene in airway epithelium of phenotypically normal cigarette smokers. Cancer Res. 63:1475-82.
6. Malkinson AM, Belinsky SA. (2000) Animal models for studying lung cancer and evaluating novel intervention strategies. In: Lung Cancer: Principles and Practice.Pass HI, Mitchell JB, Johnson DH, Turrisi AT, Minna JD (eds.) Lippincott Williams & Wilkins, Philadelphia, PA, pp. 347-63.
7. Shapiro SD. (2000) Animal models for chronic obstructive pulmonary disease: age of klotho and marlboro mice. Am. J. Respir. Cell Mol. Biol. 22:4-7. 8. Shapiro SD. (2000) Animal models for COPD. Chest117:223S-7S.
9. Danel C, Erzurum SC, McElvaney NG, Crystal RG. (1996) Quantitative assess-ment of the epithelial and inflammatory cell populations in large airways of normals and individuals with cystic fibrosis. Am. J. Respir. Crit. Care Med. 153:362-8.
10. Russi TJ, Crystal RG. (1997) Use of bronchoalveolar lavage and airway brushing to investigate the human lung. In: The Lung: Scientific Foundations. Crystal, RG (ed.) Lippencott-Raven, Philadelphia, PA. pp. 371-82.
11. Harvey BG et al. (1999) Airway epithelial CFTR mRNA expression in cystic fibrosis patients after repetitive administration of a recombinant adenovirus. J. Clin.
Invest.104:1245-55.
12. Cassidy DC. aip.org/history/heisenberg/bibliography/1920-29.htm. 2003. (GENERIC).
13. Sukhatme VP. (1990) Early transcriptional events in cell growth: the Egr family.
J. Am. Soc. Nephrol. 1:859-66.
14. Madden SL, Rauscher III FJ. (1993) Positive and negative regulation of transcrip-tion and cell growth mediated by the EGR family of zinc-finger gene products.
Ann. N.Y. Acad. Sci. 684:75-84.
15. Gashler A, Sukhatme VP. (1995) Early growth response protein 1 (Egr-1): proto-type of a zinc-finger family of transcription factors. Prog. Nucleic Acid Res. Mol.
Biol. 50:191-224.
16. Tamura S, Hanada M, Ohnishi M, Katsura K, Sasaki M, Kobayashi T. (2002) Regulation of stress-activated protein kinase signaling pathways by protein phosphatases. Eur. J. Biochem. 269:1060-6.
17. Chavrier P, Zerial M, Lemaire P, Almendral J, Bravo R, Charnay P. (1988) A gene encoding a protein with zinc fingers is activated during G0/G1 transition in cul-tured cells. EMBO J. 7:29-35.
18. Keyse SM. (1993) The induction of gene expression in mammalian cells by radi-ation. Semin. Cancer Biol. 4:119-28.
19. Khachigian LM, Collins T. (1998) Early growth response factor 1: a pleiotropic mediator of inducible gene expression. J. Mol. Med. 76:613-6.
20. Nishi H, Nishi KH, Johnson AC. (2002) Early Growth Response-1 gene mediates up-regulation of epidermal growth factor receptor expression during hypoxia.
Cancer Res. 62:827-34.
21. Semenza GL. (2000) Oxygen-regulated transcription factors and their role in pul-monary disease. Respir. Res. 1:159-62.
22. Landesberg LJ, Ramalingam R, Lee K, Rosengart TK, Crystal RG. (2001) Upregulation of transcription factors in lung in the early phase of postpneu-monectomy lung growth. Am. J. Physiol. Lung Cell Mol. Physiol. 281:L1138-49. 23. Yan SF et al. (1999) Hypoxia-associated induction of early growth response-1
gene expression. J. Biol. Chem. 274:15030-40.
24. Yan SF et al. (2000) Pulmonary expression of early growth response-1: biphasic time course and effect of oxygen concentration. J. Appl. Physiol. 88:2303-9. 25. Black AC, Luo J, Chun S, Tabibzadeh S. (1997) Constitutive expression of the
HTLV-I pX and env regions in Jurkat T-cells induces differential activation of SRE, CRE and NF kappa B pathways. Virus Genes15:105-17.
27. Krishnaraju K, Hoffman B, Liebermann DA. (2001) Early growth response gene 1 stimulates development of hematopoietic progenitor cells along the macrophage lineage at the expense of the granulocyte and erythroid lineages.
Blood97:1298-305.
28. Khachigian LM, Anderson KR, Halnon NJ, Gimbrone Jr MA, Resnick N, Collins T. (1997) Egr-1 is activated in endothelial cells exposed to fluid shear stress and interacts with a novel shear-stress-response element in the PDGF A-chain pro-moter. Arterioscler. Thromb. Vasc. Biol. 17:2280-6.
29. Shaulian E, Karin M. (2002) AP-1 as a regulator of cell life and death. Nat. Cell Biol. 4:E131-6.
30. Chae HJ et al. (1999) Systemic injection of lidocaine induced expression of c-fos mRNA and protein in adult rat brain. Res. Commun. Mol. Pathol. Pharmacol. 104:31-41.
31. Marota JJ, Crosby G, Uhl GR. (1992) Selective effects of pentobarbital and halothane on c-fos and jun-B gene expression in rat brain. Anesthesiology
77:365-371.
32. Hamaya Y, Takeda T, Dohi S, Nakashima S, Nozawa Y. (2000) The effects of pen-tobarbital, isoflurane, and propofol on immediate-early gene expression in the vital organs of the rat. Anesth. Analg. 90:1177-83.
33. Hattori M et al. (1993) Activation of activating protein 1 during hepatic acute phase response. Am. J. Physiol264:G95-103.
34. Theodosiou A, Ashworth A. (2002) MAP kinase phosphatases. Genome Biol
3:Reviews 1-10.
35. Keyse SM, Emslie EA. (1992) Oxidative stress and heat shock induce a human gene encoding a protein-tyrosine phosphatase. Nature359:644-7.
36. Chu Y, Solski PA, Khosravi-Far R, Der CJ, Kelly K. (1996) The mitogen-activated protein kinase phosphatases PAC1, MKP-1, and MKP-2 have unique substrate specificities and reduced activity in vivo toward the ERK2 sevenmaker muta-tion. J. Biol. Chem. 271:6497-501.
37. Hirsch DD, Stork PJ. (1997) Mitogen-activated protein kinase phosphatases inactivate stress-activated protein kinase pathways in vivo. J. Biol. Chem. 272:4568-75.
38. Tanoue T, Moriguchi T, Nishida E. (1999) Molecular cloning and characteri-zation of a novel dual specificity phosphatase, MKP-5. J. Biol. Chem. 274:19949-56.
39. Kovanen PE et al. (2003) Analysis of gamma c-family cytokine target genes. Identification of dual-specificity phosphatase 5 (DUSP5) as a regulator of mito-gen-activated protein kinase activity in interleukin-2 signaling. J. Biol. Chem. 278:5205-13.
40. Motosugi H, Quinlan WM, Bree M, Doerschuk CM. (1998) Role of CD11b in focal acid-induced pneumonia and contralateral lung injury in rats. Am. J. Respir.