SLEEP DISORDERED BREATHING
Obstructive Sleep Apnea and 15-Year Cognitive Decline: The Atherosclerosis
Risk in Communities (ARIC) Study
Pamela L. Lutsey, PhD1; Lindsay G.S. Bengtson, PhD1; Naresh M. Punjabi, MD2; Eyal Shahar, MD3; Thomas H. Mosley, PhD4; Rebecca F. Gottesman, MD, PhD2; Lisa M. Wruck, PhD5; Richard F. MacLehose, PhD1; Alvaro Alonso, MD, PhD1
1University of Minnesota, Minneapolis, MN; 2Johns Hopkins University, Baltimore, MD; 3University of Arizona, Tucson, AZ; 4University of Mississippi Medical Center, Jackson, MS; 5University of North Carolina, Chapel Hill, NC
Study Objectives: Prospective data evaluating abnormal sleep quality and quantity with cognitive decline are limited because most studies used subjective data and/or had short follow-up. We hypothesized that, over 15 y of follow-up, participants with objectively measured obstructive sleep apnea (OSA) and other indices of poor sleep quantity and quality would experience greater decline in cognitive functioning than participants with normal sleep patterns.
Methods: ARIC participants (n = 966; mean age 61 y, 55% women) with in-home polysomnography (1996–1998) and repeated cognitive testing were followed for 15 y. Three cognitive tests (Delayed Word Recall, Word Fluency, and Digit Symbol Substitution) were administered at two time points (1996–1998 and 2011–2013). Ten additional cognitive tests were administered at the 2011–2013 neurocognitive examination. OSA was modeled using established clinical OSA severity categories. Multivariable linear regression was used to explore associations of OSA and other sleep indices with change in cognitive tests between the two assessments.
Results: A median of 14.9 y (max: 17.3) passed between the two cognitive assessments. OSA category and additional indices of sleep (other measures of hypoxemia and disordered breathing, sleep fragmentation, sleep duration) were not associated with change in any cognitive test. Analyses of OSA severity categories and 10 cognitive tests administered only in 2011–2013 also showed little evidence of an association.
Conclusions: Overall, abnormal sleep quality and quantity at midlife was not related to cognitive decline and later-life cognition. The effect of adverse sleep quality and quantity on cognitive decline among the elderly remains to be determined.
Keywords: Atherosclerosis Risk in Communities (ARIC) study, cognitive decline, epidemiology, obstructive sleep apnea
Citation: Lutsey PL, Bengtson LG, Punjabi NM, Shahar E, Mosley TH, Gottesman RF, Wruck LM, MacLehose RF, Alonso A. Obstructive sleep apnea and 15-year cognitive decline: the Atherosclerosis Risk in Communities (ARIC) study. SLEEP 2016;39(2):309–316.
INTRODUCTION
Dementia and mild cognitive impairment (MCI) are common
among US elderly.1 Yet, despite the immense and growing
burden of these conditions, gaps exist in the understanding of characteristics leading to cognitive decline. Recent evidence, both epidemiological and pathophysiological, has suggested a possible association between abnormal sleep quality and quan-tity and cognitive impairment due to both cerebral vascular etiologies and Alzheimer disease.2–6 However, understanding
of the underlying associations is incomplete.
In an acute setting, it is well established that poor sleep quality and curtailment of sleep duration is associated with worse cognitive function.3 However, evidence is limited
re-garding whether long-standing impairments in sleep quality and quantity have long-lasting effects on cognitive function. Dementia and MCI are believed to have a long preclinical phase and the etiologically relevant stage of life may be middle age, as has been suggested with other risk factors for cogni-tive decline (e.g., hypertension,7,8 diabetes,9–12 smoking13). Most
prospective work exploring associations of sleep quantity and quality with cognitive decline has used subjective measures of sleep which have limited accuracy,14 had limited
follow-up, and/or has focused on older individuals,15–18 in whom
pathophysiological processes through which sleep results in
pii: sp-00219-15 http://dx.doi.org/10.5665/sleep.5434
Significance
Cognitive decline among older adults is a major public health concern, yet effective interventions to prevent cognitive decline are elusive. Intriguing research conducted largely in cross-sectional samples and animal models has suggested that obstructive sleep apnea (OSA) and other indices of poor sleep quantity and quality may result in cognitive decline. Counter to prior evidence, using observational data from nearly 1,000 individuals who were followed for about 15 years, there was no relation between sleep characteristics and cognitive decline. Although these results dampen enthusiasm about the role of sleep in cognitive decline, there are important methodological considerations—namely selection bias, statistical power, and the length of follow-up—that need to be taken into account when interpreting these findings.
cognitive decline may be well underway. There are several mechanisms through which poor sleep quality and habitual short sleep duration may affect cognitive decline,3,4 which
in-clude: cyclical nocturnal hypoxemia,19–21 sleep fragmentation,22
mediation through cardiovascular disease risk factors (e.g.
hy-pertension, diabetes, inflammation), stroke (both clinical and
subclinical),21,23,24 Aβ plaque buildup5, and interaction with the apolipoprotein E (APOE) ε4 risk allele.6,25
several domains of cognitive functioning assessed as part of the follow-up neurocognitive examination.
METHODS
Study Design Overview
The ARIC study is a prospective cohort which in 1987–1989 enrolled 15,792 men and women aged 45–64 years using prob-ability sampling from four US communities (visit 1).26 A total
of four cohort reexaminations have taken place (visit 2: 1990– 1992, visit 3: 1993–1995, visit 4: 1996–1998, visit 5: 2011– 2013). Hospitalizations and mortality for ARIC participants have been tracked continuously since study enrollment though annual phone calls (semiannual since 2012), surveillance of local hospitals, and monitoring of state and national death in-dexes. Institutional review boards at each of the participating institutions approved the study protocols, and all participants provided informed consent at each study visit.
In 1996–1998 (visit 4, baseline for the current study) a subset of 1,920 ARIC participants from the Washington County, MD
and suburban Minneapolis, MN field centers were recruited
into the SHHS20 and underwent an in-home overnight
poly-somnogram (PSG). Virtually all participants recruited from the MD and MN centers were white. Cognitive function as measured by the DWRT, WFT, and DSST tests took place at ARIC visits 2, 4, and 5. As part of visit 5, also referred to here as the follow-up neurocognitive examination, extensive cogni-tive testing was done with the overall objeccogni-tive to determine the prevalence of cognitive impairment and dementia and the associations of midlife vascular risk factors and markers with later-life cognitive impairment, cognitive decline, and dementia.27 Participants were invited for examinations in the
study clinic or in their homes or in long-term care facilities. Of the 1,920 SHHS participants, we excluded 193 partici-pants with incomplete data on OSA severity, 32 with central sleep apnea, 203 with incomplete data on cognitive tests and/ or covariates of interest, and 506 who did not participate in the follow-up neurocognitive examination due to either death
(n = 277) or refusal to participate (n = 229). Our final analytic
sample included 966 participants.
Sleep Measurements
The overnight unattended PSG was conducted using a portable monitor (PS-2 System; Compumedics Limited, Abbotsford, Victoria, Australia), using methods previously described.21
As in prior analyses of SHHS data, an apnea was considered
present if there was an absence or near-absence of airflow (at least < 25% of baseline) for ≥ 10 sec.28,29 Hypopnea was de-fined as a decrease in the amplitude of the airflow below 70% of baseline for ≥ 10 sec. The apnea-hypopnea index (AHI) was defined as the average number of obstructive apneas
(any apnea, regardless of the oxygen desaturation level) plus hypopneas (with at least a 4% decrease in oxygen saturation), per hour of sleep. As has been done previously in SHHS, par-ticipants were categorized into four OSA severity groups ac-cording to the AHI: < 5.0 events/h (normal), 5.0–14.9 events/h (mild sleep apnea), 15.0–29.9 events/h (moderate sleep apnea),
and ≥ 30.0 events/h (severe sleep apnea). Central sleep apnea
events, which were defined by the absence of airflow with no
associated respiratory effort detected, were excluded from this
definition. Information on measurement of other sleep related
variables is provided in the supplemental material.
Cognitive Testing
Three cognitive tests were administered at the time of the sleep examination (1996–1998) and repeated at the follow-up neuro-cognitive examination (2011–2013): the DWRT, DSST, and WFT.
Digit Symbol Substitution Test (DSST)30
Tests executive function and processing speed; participants are asked to translate numbers to symbols using a key. The score is the total number of digits correctly translated to symbols within 90 sec and the range of possible scores is 0 to 93.
Delayed Word Recall Test (DWRT)31
Tests verbal learning and recent memory. Participants are pre-sented with 10 common nouns that they are asked to use in a sentence. Two exposures to the words are given. After a 5-min delay, participants are given 60 sec to recall the words. The score for the DWRT is the number of words correctly recalled.
Word Fluency Test (WFT)32
Tests executive function and language. Participants are given 60 sec to generate as many words as possible beginning with the letters F, A, and S (60 sec for each letter), avoiding proper nouns. The WFT score is the total number of acceptable words generated for the three letters.
In general, low scores on the DWRT are more reflective of
memory impairment and Alzheimer disease; whereas low scores on the WFT and DSST are more strongly associated with executive function and cerebral vascular dementia.33
The cognitive battery administered at the follow-up neuro-cognitive examination was much more extensive, and included most of the neuropsychological tests recommended for inclu-sion in the National Institute of Aging’s National Alzheimer’s Disease Coordinating Center’s (NACC) Uniform Data Set Bat-tery34: Trail Making Test, part A; Trail Making Test, part B;
Digit Span Backwards, Logical Memory Test, part A; Logical Memory Test, part B; Incidental Learning, digit-symbol pairs; Clock Time Perception. Protocols for the tests, which have been described elsewhere, were standardized and examiners
were trained centrally. The tests were administered in a fixed
order during one session in a quiet room.
Statistical Analysis
Standardized z-scores for each cognitive test were calculated by subtracting the mean and dividing by the standard deviation (SD). For the DSST, DWRT, and WFT, z-scores were created
based on the means and SD at visit 2 (when the first cognitive
calculated using the log of the test scores. In addition, because a higher score on this test in-dicates worse performance, the z-scores were
multiplied by −1 so that low z-scores indicated
worse performance across all tests.
Participant characteristics (% or mean ±
SD) are provided stratified by OSA severity
and, separately, by follow-up neurocogni-tive examination participation status. For continuous variables, the linear trend across OSA categories was tested by modeling OSA categories ordinally. For categorical variables, the Cochran-Armitage trend test was used. To evaluate change in the DSST, DWRT, and WFT tests between the sleep and follow-up
neurocognitive examinations, multivariable linear regression was used with the outcome being the follow-up neurocognitive examina-tion z-score minus the sleep exam z-score. For cognitive function tests only measured at the follow-up neurocognitive examination, multi-variable linear regression was also used, with the outcome being the follow-up neurocogni-tive examination z-score. OSA was modeled using established clinical OSA severity catego-ries; dummy variables for each category were included in the regression model. Other indices of sleep quality and quantity were modeled as continuous variables, per 1 SD. Quadratic terms were included in the models to assess nonlinearity, and if evidence of nonlinearity was present, the sleep variables of interest were modeled as quartiles.
A series of nested models were explored; covariates came from the sleep examination, unless otherwise noted. Model 1 adjusted for
age, sex, field center, and educational attain -ment (visit 1). Model 2 further adjusted for ethanol intake, smoking status, leisure time
physical activity (visit 3), and APOE ε4 risk
allele. Model 3 additionally adjusted for body mass index (BMI). Model 4 also adjusted for characteristics believed to be on the causal pathway between OSA and cognitive decline
(i.e., high-sensitivity C-reactive protein (CRP), diabetes mel-litus, hypertension, and prevalent coronary heart disease, heart failure, and stroke).
In sensitivity analyses, to account for attrition due to ei-ther death or failure to attend the follow-up neurocognitive examination (censoring), we incorporated inverse probability of attrition weighting (IPAW) methods,35 as has been done
previously with the ARIC follow-up neurocognitive data.27
Weights for each individual were the inverse of the product of the estimated probability of being alive and the probability of participating in the study (conditional on being alive). Charac-teristics included in the IPAW weighting models are provided in the supplemental material. We also calculated stabilized weights35 by multiplying our original weights by probabilities
of follow-up neurocognitive examination participation calcu-lated using only baseline age, sex, and educational level.
RESULTS
Of the original 1,472 SHHS participants, 966 participated in the ARIC follow-up neurocognitive examination and were
in-cluded in our final analytic sample, whereas 506 (34%) were
not included due to death, attrition, or incomplete cognitive testing information. Relative to those who did not participate in the follow-up neurocognitive examination, those who par-ticipated tended, at the time of the sleep examination, to be younger, have higher educational attainment, and have a lower prevalence of cardiovascular diseases and risk factors (Table 1).
Overall, when stratified by OSA category, characteristics of Table 1—Participant characteristics at the sleep examination (visit 4; 1996–1998),
stratified by neurocognitive follow-up examination (visit 5; 2011–2013) participation status. Neurocognitive Follow-Up Examination Participant (n = 966) Nonparticipant (n = 506)
Age, y 61.3 ± 5.0 65.1 ± 5.5
Female 51.4 48.6
Education ≥ high school graduate 91.8 84.8 Leisure time physical activity 2.6 ± 0.5 2.5 ± 0.5 Smoking status
Current 8.7 13.6
Former 48.6 49.0
Never 42.8 37.4
Usual ethanol intake, g/w 39.6 ± 70.9 37.2 ± 78.5
BMI, kg/m2 28.5 ± 4.8 29.1 ± 5.4
Hypertension 33.1 49.2
Diabetes mellitus 8.5 16.2
Prior stroke 0.4 3.8
Prior heart failure 2.1 7.5
Prior coronary heart disease 5.7 14.2
C-reactive protein 3.6 ± 5.2 4.5 ± 6.3
APOE ε4 risk allele
0 72.6 67.8
1 25.3 27.5
2 2.2 4.7
Obstructive sleep apnea
Normal 53.9 46.8
Mild 28.5 32.2
Moderate 12.2 13.2
Severe 5.4 7.7
Delayed Word Recall 6.8 ± 1.4 6.4 ± 1.6
z-score 0.2 ± 0.9 0.1 ± 1.0
Word Fluency 37.7 ± 10.8 34.7 ± 11.3
z-score 0.4 ± 0.9 0.12 ± 0.90
Digit Symbol Substitution 50.8 ± 10.2 45.1 ± 10.8
z-score 0.4 ± 0.7 0.03 ± 0.8
the entire SHHS sample were similar to those of our final ana -lytic sample (Table S1, supplemental material versus Table 2).
The 966 ARIC participants included in our final analytic
sample were on average 61.3 ± 5.0 y old and 51.4% female when the baseline sleep study (1996–1998) was conducted. Of
these participants, 5.4% (n = 52) were classified as having se -vere OSA, 12.2% (n = 118) as having moderate OSA, 28.5% (n = 275) as having mild OSA, and 53.9% (n = 521) as having a normal sleep breathing pattern. Relative to participants
clas-sified as normal, those with severe OSA were more likely to
be male, have a higher BMI, have a higher CRP level, and to be hypertensive, diabetic, and have prevalent heart failure or coronary heart disease (Table 2).
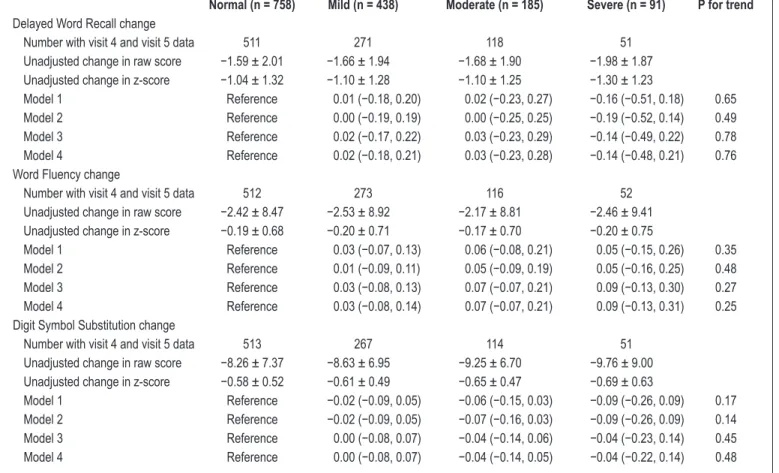
A median of 14.9 y (max: 17.3 y) passed between the cogni-tive assessments at the sleep and follow-up neurocognicogni-tive ex-aminations. Over this time cognitive performance decreased, according to mean (± SD) scores (raw score / z-score) on
the DWRT (−1.64 ± 1.97 / −1.08 ± 1.30), WFT (−2.42 ± 8.68 / −0.19 ± 0.69), and DSST (−8.57 ± 7.27 / −0.60 ± 0.51). As -sociations between OSA severity categories and linear change in cognitive test scores between the sleep and follow-up neu-rocognitive examinations are presented in Table 3. There was
no association between OSA category and change in DWRT, WFT, or DSST, regardless of degree of adjustment. Results were similar when we accounted for attrition by employing in-verse probability weighting and stabilized inin-verse probability weighting models (Tables S2 and S3, supplemental material).
We also examined associations between measures of disor-dered breathing, including severity of nocturnal hypoxemia and sleep fragmentation, habitual sleep duration, and change in scores on the DWRT, WFT, and DSST tests. Overall, there was no evidence of an association (Table 4). For measures of disordered breathing including nocturnal hypoxemia and sleep fragmentation, which were modeled continuously, there also was no evidence of nonlinearity. The only evidence of an as-sociation was that, across all models, participants with habitu-ally short sleep duration (< 7 h) experienced a slightly greater decline in DSST scores relative to participants who slept 7 to
8 h: mean change (95% confidence interval [CI]): Model 1: −0.10 (−0.18, −0.02); Model 2: −0.11 (−0.19, −0.03); Model 3: −0.10 (−0.19, −0.02); Model 4: −0.10 (−0.19, −0.02). Overall, re -sults were similar when IPAW or stabilized IPAW were used (Table S4, supplemental material). For the association be-tween sleep duration and DSST, estimates which accounted for
Table 2—Demographic and clinical characteristics of the final analytic sample (n = 966) at the sleep examination (visit 4; 1996–1998), stratified by sleep examination obstructive sleep apnea categories.
Normal (n = 521) Mild (n = 275) Moderate (n = 118) Severe (n = 52)
Age, years 60.7 ± 5.1 61.8 ± 4.8 62.3 ± 5.2 62.4 ± 4.5
Female 66.6 45.1 32.2 38.5
Education ≥ high school graduate 93.5 89.8 90.7 88.5
Leisure time physical activity 2.6 ± 0.5 2.5 ± 0.5 2.6 ± 0.4 2.5 ± 0.6
Smoking status
Current 11.1 5.5 5.1 9.6
Former 44.2 52.7 56.8 51.9
Never 44.7 41.8 38.1 38.5
Usual ethanol intake, g/w 37.9 ± 66.8 45.0 ± 82.4 37.0 ± 63.9 33.1 ± 59.3
BMI, kg/m2 27.0 ± 4.3 29.4 ± 4.3 30.6 ± 4.9 33.5 ± 5.4
Hypertension 29.8 35.3 35.6 50.0
Diabetes mellitus 5.8 11.3 7.6 23.1
Prior stroke 0.4 0.7 0.0 0.0
Prior heart failure 1.5 2.6 2.5 3.9
Prior coronary heart disease 5.4 5.1 8.5 5.8
C-reactive protein 3.6 ± 5.1 3.5 ± 5.5 3.6 ± 4.9 5.0 ± 4.9
APOE ε4 risk allele
0 70.3 74.2 78.8 73.1
1 27.5 23.3 19.5 26.9
2 2.3 2.6 1.7 0.0
Delayed Word Recall 7.0 ± 1.4 6.6 ± 1.5 6.6 ± 1.4 6.8 ± 1.1
z-score 0.3 ± 0.9 −0.01 ± 1.0 −0.04 ± 1.0 0.1 ± 0.7
Word Fluency 38.3 ± 10.7 37.5 ± 11.1 36.1 ± 10.7 36.2 ± 10.1
z-score 0.4 ± 0.9 0.3 ± 0.9 0.2 ± 0.9 0.2 ± 0.8
Digit Symbol Substitution 52.3 ± 10.4 49.3 ± 9.9 49.1 ± 9.2 48.9 ± 9.2
z-score 0.5 ± 0.7 0.3 ± 0.7 0.3 ± 0.6 0.3 ± 0.6
attrition were slightly stronger; the Model 1 IPAW estimated
change was −0.15 (−0.26, −0.05), while the Model 1 stabilized IPAW estimate was −0.14 (−0.23, −0.05).
Table 5 presents associations between sleep examination OSA severity categories and 10 cognitive tests administered only at the follow-up neurocognitive examination, as well as the follow-up neurocognitive examination values (not change) for the DWRT, WFT, and DSST. For the Trail Making Test, part A, there was evidence of a linear trend (P trend = 0.03) whereby participants with greater OSA severity at the sleep ex-amination had worse scores on this test. This association per-sisted across all statistical models (data not shown). Those with severe OSA also had lower scores on the Clock Time
Percep-tion tests (−0.29 [−0.52, −0.05]) relative to those who had no
evidence of OSA (Table 5). This association was also present across all models (data not shown).
DISCUSSION
In a community-based sample of nearly 1,000 individuals we evaluated the association between abnormal indices of sleep quality and quantity, measured objectively in middle age, with
15-y change in cognitive test scores. Overall, we found no evi-dence that severity of OSA, degree of nocturnal hypoxemia, sleep fragmentation, or habitual sleep duration were associ-ated with cognitive decline. In secondary analyses exploring the association between OSA severity and tests spanning mul-tiple cognitive domains, which were only administered 15 y after the sleep study, there was also no evidence of an associa-tion between midlife OSA and later life cogniassocia-tion. The lack of a prospective association of sleep quality and quantity with later-life cognition was counter to our hypothesis, which con-sidered midlife as the etiologically relevant frame for evalu-ating the association between OSA and cognitive decline.
The strongest existing epidemiologic evidence that sleep may be associated prospectively with cognitive decline comes from the Study of Osteoporotic Fractures, which has evaluated prospectively the relation between objectively measured sleep and risk of incident MCI and dementia (combined outcome).4
Over a median 4.7 y, after multivariable adjustment women (median age, 82.3 y) with moderate or severe OSA, were 85% more likely to develop MCI or dementia.4 The relation
be-tween subjectively measured sleep quality and quantity with
Table 3—Adjusted mean change and 95% confidence intervals from linear regression models for change in cognitive score from sleep exam (visit 4; 1996–1998) to the neurocognitive follow-up examination (visit 5; 2011–2013) (z-scores standardized to visit 2; 1990–1992) stratified by obstructive sleep apnea categories.
Normal (n = 758) Mild (n = 438) Moderate (n = 185) Severe (n = 91) P for trend Delayed Word Recall change
Number with visit 4 and visit 5 data 511 271 118 51
Unadjusted change in raw score −1.59 ± 2.01 −1.66 ± 1.94 −1.68 ± 1.90 −1.98 ± 1.87 Unadjusted change in z-score −1.04 ± 1.32 −1.10 ± 1.28 −1.10 ± 1.25 −1.30 ± 1.23
Model 1 Reference 0.01 (−0.18, 0.20) 0.02 (−0.23, 0.27) −0.16 (−0.51, 0.18) 0.65 Model 2 Reference 0.00 (−0.19, 0.19) 0.00 (−0.25, 0.25) −0.19 (−0.52, 0.14) 0.49 Model 3 Reference 0.02 (−0.17, 0.22) 0.03 (−0.23, 0.29) −0.14 (−0.49, 0.22) 0.78 Model 4 Reference 0.02 (−0.18, 0.21) 0.03 (−0.23, 0.28) −0.14 (−0.48, 0.21) 0.76 Word Fluency change
Number with visit 4 and visit 5 data 512 273 116 52
Unadjusted change in raw score −2.42 ± 8.47 −2.53 ± 8.92 −2.17 ± 8.81 −2.46 ± 9.41 Unadjusted change in z-score −0.19 ± 0.68 −0.20 ± 0.71 −0.17 ± 0.70 −0.20 ± 0.75
Model 1 Reference 0.03 (−0.07, 0.13) 0.06 (−0.08, 0.21) 0.05 (−0.15, 0.26) 0.35
Model 2 Reference 0.01 (−0.09, 0.11) 0.05 (−0.09, 0.19) 0.05 (−0.16, 0.25) 0.48
Model 3 Reference 0.03 (−0.08, 0.13) 0.07 (−0.07, 0.21) 0.09 (−0.13, 0.30) 0.27
Model 4 Reference 0.03 (−0.08, 0.14) 0.07 (−0.07, 0.21) 0.09 (−0.13, 0.31) 0.25
Digit Symbol Substitution change
Number with visit 4 and visit 5 data 513 267 114 51
Unadjusted change in raw score −8.26 ± 7.37 −8.63 ± 6.95 −9.25 ± 6.70 −9.76 ± 9.00 Unadjusted change in z-score −0.58 ± 0.52 −0.61 ± 0.49 −0.65 ± 0.47 −0.69 ± 0.63
Model 1 Reference −0.02 (−0.09, 0.05) −0.06 (−0.15, 0.03) −0.09 (−0.26, 0.09) 0.17 Model 2 Reference −0.02 (−0.09, 0.05) −0.07 (−0.16, 0.03) −0.09 (−0.26, 0.09) 0.14 Model 3 Reference 0.00 (−0.08, 0.07) −0.04 (−0.14, 0.06) −0.04 (−0.23, 0.14) 0.45 Model 4 Reference 0.00 (−0.08, 0.07) −0.04 (−0.14, 0.05) −0.04 (−0.22, 0.14) 0.48
incident cognitive decline has been evaluated in several prior studies.15–18 Recently, self-reported short and long sleep
dura-tion was associated with higher risk of MCI and dementia in a large prospective study of older women who were followed from 1995–2008.36 Results of the other studies were mixed, but
they were limited by short follow-up (at most 3 y), and making
direct comparisons is difficult as they used varying measures
of sleep disturbances and cognition.
Although several other risk factors for cognitive decline show stronger associations when measured in midlife,7,9–11,13 it
is possible that if poor sleep quality and/or quantity and disor-ders such as OSA are causally associated with cognition, their effect may be more acute. As has been reviewed by others,37
several small, short, randomized trials of patients with OSA have reported modest improvements in cognitive functioning after continuous positive airway pressure therapy for OSA, with the greatest gains observed in the executive function do-main.38 Cross-sectional studies have suggested that poor sleep
quality and quantity are most closely linked to lower cognition in the executive function and attention domains.38–40 Notably, Table 4—Adjusted mean change and 95% confidence intervals of sleep disordered breathing, sleep architecture, sleep fragmentation, and sleep
duration from linear regression models for change in cognitive score from the sleep examination (visit 4; 1996–1998) to the follow-up neurocognitive examination (visit 5; 2011–2013) (z-scores standardized to visit 2; 1990–1992).
1 SD Delayed Word Recall Estimate (95% CI) P Estimate (95% CI)Word Fluency P Digit Symbol SubstitutionEstimate (95% CI) P Hypoxemia and disordered breathing
Percentage sleep time SaO2 < 90% 7.9 −0.01 (−0.10, 0.09) 0.92 0.01 (−0.03, 0.05) 0.65 −0.01 (−0.05, 0.03) 0.61 Apnea-hypopnea index 12.5 −0.02 (−0.10, 0.06) 0.61 0.02 (−0.02, 0.07) 0.31 −0.04 (−0.08, 0.00) 0.07 # Apnea/hypopnea events per night 83.4 −0.01 (−0.08, 0.07) 0.85 0.03 (−0.01, 0.07) 0.11 −0.03 (−0.07, 0.01) 0.13 Sleep fragmentation
Arousal index 9.5 −0.03 (−0.10, 0.05) 0.52 −0.03 (−0.07, 0.01) 0.16 0.00 (−0.04, 0.03) 0.86 Average sleep WASO 37.6 −0.05 (−0.13, 0.04) 0.28 0.00 (−0.04, 0.05) 0.83 0.01 (−0.02, 0.04) 0.47 Average sleep duration
< 7 h 0.01 (−0.21, 0.22) −0.06 (−0.17, 0.05) −0.10 (−0.18, −0.02)
7 h Reference Reference Reference
8 h 0.16 (−0.03, 0.35) 0.10 (0.00, 0.20) 0.02 (−0.05, 0.10)
≥ 9 h −0.14 (−0.50, 0.23) 0.02 (−0.15, 0.20) 0.05 (−0.10, 0.21)
P for difference 0.24 0.06 0.02
Adjusted for age, sex, field center, and educational ascertainment. Results reported per change in standard deviation of the exposure. P for trend from linear regression model with average sleep duration modeled as a categorical variable. P for difference based on a Wald chi-square 3 degrees of freedom test. CI, confidence interval; SaO2, saturation of oxygen; WASO, wake after sleep onset.
Table 5—Estimates and 95% confidence intervals per standard deviation of cognitive test score (2011–2013) by obstructive sleep apnea category (1996–1998).
Normal Mild Moderate Severe P for trend
n 513 273 118 51
Delayed Word Recall Reference −0.07 (−0.21, 0.07) −0.04 (−0.23, 0.16) −0.11 (−0.39, 0.16) 0.36 Word Fluency Reference 0.02 (−0.11, 0.16) −0.02 (−0.20, 0.17) −0.04 (−0.30, 0.22) 0.82 Digit Symbol Substitution Reference −0.07 (−0.18, 0.05) −0.06 (−0.22, 0.11) −0.13 (−0.36, 0.10) 0.18 Trail Making Test, part A Reference −0.10 (−0.20, 0.00) −0.10 (−0.24, 0.04) −0.15 (−0.34, 0.04) 0.03 Trailing Making Test, part B Reference −0.03 (−0.15, 0.09) −0.01 (−0.18, 0.15) 0.03 (−0.21, 0.27) 0.98 Digit Span Backwards Reference −0.03 (−0.17, 0.11) 0.00 (−0.19, 0.19) 0.14 (−0.12, 0.41) 0.55 Logical Memory Test, part A Reference 0.03 (−0.11, 0.18) 0.03 (−0.16, 0.23) 0.05 (−0.22, 0.33) 0.61 Logical Memory Test, part B Reference −0.01 (−0.16, 0.13) −0.03 (−0.23, 0.16) 0.17 (−0.11, 0.45) 0.58 Incidental Learning, digit-symbol pairs Reference 0.07 (−0.07, 0.22) 0.01 (−0.19, 0.21) 0.23 (−0.06, 0.52) 0.21 Clock Time Perception Reference −0.05 (−0.17, 0.07) 0.01 (−0.15, 0.18) −0.29 (−0.52, −0.05) 0.11 Animal Naming Reference −0.03 (−0.17, 0.11) −0.14 (−0.33, 0.06) −0.17 (−0.45, 0.10) 0.10 Boston Naming Test Reference −0.01 (−0.10, 0.09) −0.01 (−0.15, 0.12) −0.05 (−0.24, 0.14) 0.64 Mini-Mental State Examination Reference 0.01 (−0.11, 0.14) 0.13 (−0.05, 0.30) 0.05 (−0.19, 0.29) 0.28
a prior cross-sectional analysis of the ARIC data revealed no association between the severity of OSA and cognitive perfor-mance.41 Yet, ARIC participants were 53–74 y old at the time,
and the analysis may have taken place too early in the natural history of the disease.
Limitations of the current study are the single assessment of sleep, incomplete information on continuous positive airway pressure intervention during the follow-up period, that the eti-ologically relevant timeframe for the association between sleep and cognitive decline could be outside the examined window, that all cognitive tests were not administered at the time of the SHHS, and that selection bias may have been present. Ana-lyzing only those persons who attended a visit, when the likeli-hood of attending the visit is associated with both abnormal sleep characteristics and cognition, may provide biased re-sults. Of the original SHHS participants, one-third did not at-tend the follow-up neurocognitive examination due to either death or attrition. We attempted to account for selection bias by using IPAW models. Results of these analyses were similar to those from standard analyses. Our study also has important strengths, including objectively measured sleep assessments, a relatively large sample size, the availability of information on numerous potential confounders, and the assessment of an extensive battery of cognitive tests, which were administered by centrally trained staff.
To summarize, in this community-based study of nearly 1,000 men and women the associations of the severity of OSA, sleep fragmentation, nocturnal hypoxemia, and habitual sleep duration with cognitive decline over 15 y of follow-up were
re-soundingly null. However, although we observed no significant
associations, it remains possible that in more acute settings poor sleep quality may be associated with cognitive decline, particularly among the elderly.
REFERENCES
1. Fitzpatrick AL, Kuller LH, Ives DG, et al. Incidence and prevalence of dementia in the Cardiovascular Health Study. J Am Geriatr Soc 2004;52:195–204.
2. Somers VK, White DP, Amin R, et al. Sleep apnea and cardiovascular disease: an American Heart Association/American College of Cardiology Foundation Scientific Statement from the American Heart Association Council for High Blood Pressure Research Professional Education Committee, Council on Clinical Cardiology, Stroke Council, and Council on Cardiovascular Nursing in collaboration with the National Heart, Lung, and Blood Institute National Center on Sleep Disorders Research (National Institutes of Health). Circulation 2008;118:1080–111.
3. Amlander C, Fuller P. Basics of sleep guide. Westchester, IL: Sleep Research Society, 2009.
4. Yaffe K, Laffan AM, Harrison S, et al. Sleep-disordered breathing, hypoxia, and risk of mild cognitive impairment and dementia in older women. JAMA 2011;306:613–9.
5. Kang JE, Lim MM, Bateman RJ, et al. Amyloid-beta dynamics are regulated by orexin and the sleep-wake cycle. Science 2009;326:1005–7.
6. Gottlieb DJ, DeStefano AL, Foley DJ, et al. APOE epsilon4 is associated with obstructive sleep apnea/hypopnea: the Sleep Heart Health Study. Neurology 2004;63:664–8.
7. Staessen JA, Richart T, Birkenhäger WH. Less atherosclerosis and lower blood pressure for a meaningful life perspective with more brain. Hypertension 2007;49:389–400.
8. Gottesman RF, Schneider AC, Albert M, et al. Midlife hypertension and 20-year cognitive change: the atherosclerosis risk in communities neurocognitive study. JAMA Neurol 2014;71:1218–27.
9. Elias PK, Elias MF, D’Agostino RB, et al. NIDDM and blood pressure as risk factors for poor cognitive performance. The Framingham Study. Diabetes Care 1997;20:1388–95.
10. Gregg EW, Yaffe K, Cauley JA, et al. Is diabetes associated with cognitive impairment and cognitive decline among older women? Arch Intern Med 2000;160:174–80.
11. Logroscino G, Kang JH, Grodstein F. Prospective study of type 2 diabetes and cognitive decline in women aged 70-81 years. BMJ 2004;328:548.
12. Rawlings AM, Sharrett AR, Schneider ALC, et al. Diabetes in midlife and cognitive change over 20 years: a cohort study. Ann Intern Med 2014;161:785–93.
13. Hernan MA, Alonso A, Logroscino G. Cigarette smoking and dementia: potential selection bias in the elderly. Epidemiology 2008;19:448–50.
14. Wolfson AR, Carskadon MA, Acebo C, et al. Evidence for the validity of a sleep habits survey for adolescents. Sleep 2003;26:213–6. 15. Potvin O, Lorrain D, Forget H, et al. Sleep quality and 1-year incident
cognitive impairment in community-dwelling older adults. Sleep 2012;35:491–9.
16. Cricco M, Simonsick EM, Foley DJ. The impact of insomnia on cognitive functioning in older adults. J Am Geriatr Soc 2001;49:1185–9.
17. Tworoger SS, Lee S, Schernhammer ES, Grodstein F. The association of self-reported sleep duration, difficulty sleeping, and snoring with cognitive function in older women. Alzheimer Dis Assoc Dis 2006;20:41–8.
18. Jelicic M, Bosma H, Ponds RWHM, Van Boxtel MPJ, Houx PJ, Jolles J. Subjective sleep problems in later life as predictors of cognitive decline. Report from the Maastricht Ageing Study (MAAS). Int J Geriatr Psychiatry 2002;17:73–7.
19. Bliwise DL. Sleep apnea, APOE4 and Alzheimer’s disease 20 years and counting? J Psychosom Res 2002;53:539–46.
20. Durgan DJ, Bryan RM. Cerebrovascular consequences of obstructive sleep apnea. J Am Heart Assoc 2012;1.
21. Redline S, Yenokyan G, Gottlieb DJ, et al. Obstructive sleep apnea– hypopnea and incident stroke: the Sleep Heart Health Study. Am J Respir Crit Care Med 2010;182:269–77.
22. Born J, Wilhelm I. System consolidation of memory during sleep. Psychol Res 2012;76:192–203.
23. Yaggi HK, Concato J, Kernan WN, Lichtman JH, Brass LM, Mohsenin V. Obstructive sleep apnea as a risk factor for stroke and death. N Engl J Med 2005;353:2034–41.
24. Munoz R, Duran-Cantolla J, Martínez-Vila E, et al. Severe sleep apnea and risk of ischemic stroke in the elderly. Stroke 2006;37:2317–21. 25. Kadotani H, Kadotani T, Young T, et al. Association between
apolipoprotein e ε4 and sleep-disordered breathing in adults. JAMA 2001;285:2888–90.
26. The Atherosclerosis Risk in Communities (ARIC) study: design and objectives. The ARIC investigators. Am J Epidemiol 1989;129:687–702.
27. Gottesman RF, Rawlings AM, Sharrett AR, et al. Impact of differential attrition on the association of education with cognitive change over 20 years of follow-up: the ARIC Neurocognitive Study. Am J Epidemiol 2014;179:956–66.
28. Quan SF, Howard BV, Iber C, et al. The Sleep Heart Health Study: design, rationale, and methods. Sleep 1997;20:1077–85.
29. Redline S, Sanders MH, Lind BK, et al. Methods for obtaining and analyzing unattended polysomnography data for a multicenter study. Sleep Heart Health Research Group. Sleep 1998;21:759–67.
31. Knopman DS, Ryberg S. A verbal memory test with high predictive accuracy for dementia of the Alzheimer type. Arch Neurol 1989;46:141–5.
32. Benton AL, Eslinger PJ, Damasio AR. Normative observations on neuropsychological test performances in old age. J Clin Neuropsychol 1981;3:33–42.
33. Selnes OA, Vinters HV. Vascular cognitive impairment. Nat Clin Pract Neurol 2006;2:538–47.
34. Morris JC, Weintraub S, Chui HC, et al. The Uniform Data Set (UDS): clinical and cognitive variables and descriptive data from Alzheimer Disease Centers. Alzheimer Dis Assoc Disord 2006;20:210–6. 35. Weuve J, Tchetgen Tchetgen EJ, Glymour MM, et al. Accounting for
bias due to selective attrition: the example of smoking and cognitive decline. Epidemiology 2012;23:119–28.
36. Chen JC, Espeland MA, Brunner RL, et al. Sleep duration, cognitive decline, and dementia risk in older women. Alzheimer Dement 2015 Jun 15. [Epub ahead of print].
37. Sanchez AI, Martinez P, Miro E, Bardwell WA, Buela-Casal G. CPAP and behavioral therapies in patients with obstructive sleep apnea: effects on daytime sleepiness, mood, and cognitive function. Sleep Med Rev 2009;13:223–33.
38. Saunamäki T, Jehkonen M. A review of executive functions in obstructive sleep apnea syndrome. Acta Neurol Scand 2007;115:1–11. 39. Sforza E. Sleep apnea syndrome and cognition. Front Neurol 2012;3. 40. Jackson ML, Howard ME, Barnes M. Cognition and daytime
functioning in sleep-related breathing disorders. Progress in brain research 2011;190:53–68.
41. Boland LL, Shahar E, Iber C, et al. Measures of cognitive function in persons with varying degrees of sleep-disordered breathing: the Sleep Heart Health Study. J Sleep Res 2002;11:265–72.
ACKNOWLEDGMENTS
The authors thank the staff and participants of the ARIC study for their important contributions.
SUBMISSION & CORRESPONDENCE INFORMATION
Submitted for publication April, 2015 Submitted in final revised form July, 2015 Accepted for publication August, 2015
Address correspondence to: Pamela L. Lutsey, PhD, Division of
Epidemiology and Community Health, School of Public Health, University
of Minnesota, 1300 S 2nd Street, Suite 300, Minneapolis, MN 55455; Tel:
(612) 624-5812; Fax: (612) 624-0315; Email address: [email protected]
DISCLOSURE STATEMENT