CRYPTS-ON-A-CHIP:
DEVELOPING AN EX VIVO MODEL OF THE INTESTINAL CRYPTS
Brent Jacob Puthoff
A thesis submitted to the faculty of the University of North Carolina at Chapel Hill and North Carolina State University in partial fulfillment of the requirements for the degree of Masters of Science in the Department of Biomedical Engineering.
Chapel Hill 2012
Approved By:
Scott T. Magness, Ph.D.
Nancy Allbritton, MD. Ph.D.
iii ABSTRACT
BRENT JACOB PUTHOFF: Crypts-on-a-Chip: Developing an ex vivo Model of the Intestinal Crypts
iv
ACKNOWLEDGEMENTS
Dr. Scott Magness for guidance, mentorship, and constructively challenging me.
Dr. Susan Henning, Dr. Nancy Allbritton, Dr. Glenn Walker, Dr. Yuli Wang and Dr. Sharon Lubkin: who’s wealth of knowledge provided very helpful advice, direction, and support of this work.
Dr. Yuli Wang and Joe Balowski for most of the design and fabrication of the scaffolds used in this work.
Megan Fuller, Richard von Furstenberg, Adam Gracz, Dr. Victoria Bali, Ian
Williamson, and everyone in the UNC GI Stem Cell Group for their support of this work and thoughtful advice and suggestions.
v
TABLE OF CONTENTS
List of Tables ... vii
List of Figures ... viii
List of Abbreviations ... ix
Chapter I. INTRODUCTION ... 1
II. SCAFFOLD DEVELOPMENT ... 6
Introduction ... 6
Materials and methods... 10
Results ... 15
Discussion ... 24
III. OPTIMIZATION AND CHARACTERIZATION OF CRYPT ISOLATION .... 26
Introduction ... 26
Methods ... 28
Results ... 31
vi
IV. IMAGING STRATEGIES ... 40
Introduction ... 40
Methods ... 41
Results ... 42
Discussion ... 44
V. CONCLUSIONS AND FUTURE WORK ... 46
vii
LIST OF TABLES
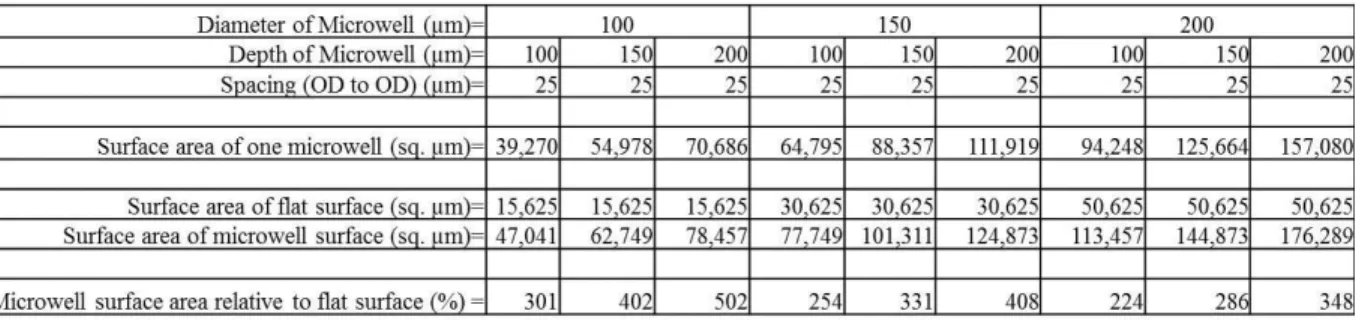
1. Increase of scaffold surface area for varying diameters and depths of microwells ...8
2. Crypt seeding probabilities as governed by the Poisson distribution ...18
3. Comsol input parameters ...21
viii
LIST OF FIGURES
1. Microanatomy of the small intestine epithelium and stem cell niche ...3
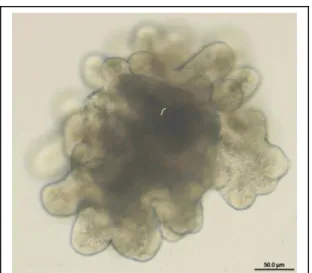
2. Enteroid cultured in 3-D protein matrix...5
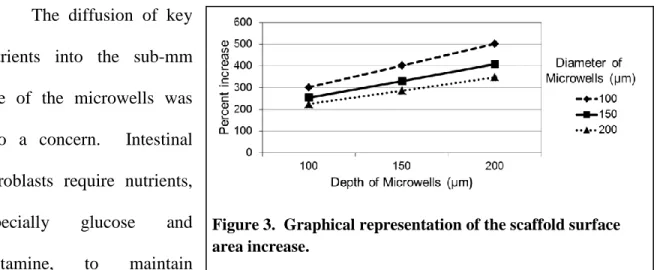
3. Graphical representation of the scaffold surface area increase ...9
4. Microstrainer array fabrication ...11
5. Proliferation of myofibroblasts is more rapid on Polystyrene, PDLA, and 1002F than on PDMS ...15
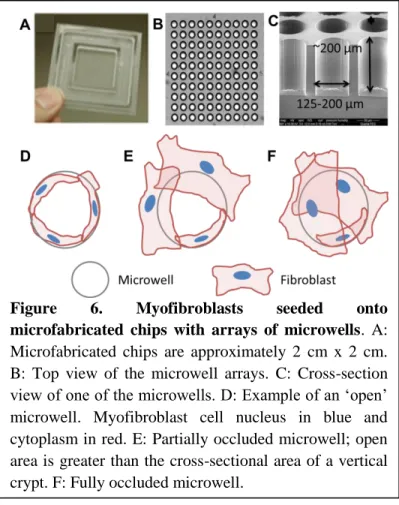
6. Myofibroblasts seeded onto microfabricated chips with arrays of microwells ...16
7. Crypt seeding can be increased with openings in the base of the wells and shortening fibroblast pre-seeding times ...19
8. Accelerometer readings, yield, and viability of epithelial cells isolated by various shaking alternatives ...32
9. Yield of crypt cells from crypt enriched cell preparations compared with a standard EDTA preparation ...35
10. Viability analysis of crypt enriched cell preparations compared with a standard EDTA preparation ...38
11. Confocal microscopy of myofibroblasts within microwells ...42
ix
LIST OF SYMBOLS AND ABBREVIATIONS
Unit Prefixes
Symbol Value
n x10-9
µ x10-6
m x10-3
c x10-2
k x103
Units
Symbol Name
g gram
s second
m meter
M mole
o
C degrees Celsius
G gravity
Abbreviations
APC allophycocyanin
Ascl2 achaete-scute complex homolog 2 BAC bacterial artificial chromosome
BFP blue fluorescent protein
CBC crypt base columnar
CD cluster of differentiation
CFP cyan fluorescent protein
DMEM Dulbecco’s modified eagle medium
DPBS Dulbecco’s phosphate buffered solution
DTT Dithiothreitol
ECM extra cellular matrix
x Abbreviations continued
EE enteroendocrine
EGFP enhanced green fluorescent protein EpCAM epithelial cell adhesion molecule FACS fluorescence-activated cell sorting
FBS fetal bovine serum
FDA US Food and Drug Administration GENSAT gene expression nervous system atlas
GI gastrointestinal
HBSS Hank’s buffered saline solution IESC intestinal epithelial stem cell
Lgr5 leucine-rich repeat containing G-protein coupled receptor 5 LSM laser scanning microscope
MEF murine embryonic fibroblast
MF myofibroblast
MPE multi-photon excitation OCT optimal cutting temperature Olfm4 Olfactomedin 4
PDLA Poly (DL-lactide)
PDMS polydimethylsiloxane
PFA paraformaldehyde
PI Propidium iodide
RFP red fluorescent protein
SDC spinning-disk confocal
SMA smooth muscle actin
Sox Sry-Box-containing
Sry Sex determining region Y
TA Transit-amplifying
UV ultraviolet
CHAPTER 1
INTRODUCTION
In recent years, there has been significant interest in the development of ex vivo living models of organ systems of the human body [1, 2]. Animal models, especially rodent, have
been a standard for biomedical research, however technical, ethical, and financial constraints
limit the types of research that can be performed. An ex vivo organ model would not completely replace animal models, but could be used as a supplement for researchers to gain
a better understanding of organ development and response to stimuli. Previous work has
shown the ability to create organ-on-a-chip models using cells from the lung, liver, and
gastrointestinal (GI) tract [3-5]. Many of these models, especially those of the GI tract, do not
recreate the microanatomy of the organ as they are essentially a monolayer of cells plated on
a chip. The goal of this work was to develop an ex vivo model that recapitulated the anatomy and physiology of the crypts and underlying mesenchyme of the intestine.
With the recent interest and potential benefits of organ-on-a-chip models, the
National Institute of Health and the Defense Advanced Research Projects Agency (DARPA)
have made the development of these models a priority by allocating more than $100 million
dollars towards their development. These agencies have set forth guidelines for
organ-on-a-chip models developed with these research dollars. The models should be modular, that is,
important components should be interchangeable to allow easy integration with other
organ-on-a-chip systems. Techniques to create the models should be easily reproducible. The
2
the organ-on-a-chip models should allow seamless integration with various imaging
modalities.
Organ-on-a-chip models offer researchers several benefits over animal models. First,
the models give researchers the ability to tightly control variables. In a mouse model,
cellular signaling, gut microbiota, the immune response, and other factors can influence
experimental results. By tightly controlling these variables, researchers can pinpoint the
molecule or signaling pathway that caused an experimental outcome, which is particulary
useful if that outcome is promising. Tight variable control is especially powerful for studying
stem cell genetics, as Wnt signaling or the gradients of mitogens and morphogens can be
very carefully controlled, allowing the analysis of the proliferation and differentiation of the
stem cell population.
Ethical sentiments and FDA guidelines also prevent most research on human patients.
However, small tissue samples could be extracted, expanded in vitro, and seeded onto a supporting layer to create an ex vivo system. Rather than interpreting and extrapolating the results from an animal model experiment, an ex vivo model composed of human tissue would allow researchers to more accurately study the response of the human tissue to
pharmaceuticals, carcinogens, or pathogenic microbes.
With the current emphasis on individualized medicine, an ex vivo could be an additional safeguard employed prior to the administration of a new treatment to a patient.
Biopsies of diseased tissue could be excised from a patient and cultured as multiple ex vivo models. Each model could then be subjected to a unique pharmaceutical combination, and
3
The primary barriers of pharmaceutical development and approval could be lowered
as these models would reduce the time and cost associated with the current large format
screening process of novel nanoparticles or pharmaceuticals. The ex vivo system can be compartmentalized allowing the study of a dozen or more pharmaceuticals simultaneously.
Labor and material costs can be reduced by minimizing the time, space, and expensive
reagents required for these screening procedures. Screening with an ex vivo human tissue
model also gives researchers the ability to test pharmaceuticals earlier in the three phase
clinical trial schedule. The majority of the drugs shown to be safe in animal models fail in
phase III clinical trials, therefore, testing the pharmaceuticals on a human ex vivo model could eliminate some of the unsuccessful
drugs earlier and save overall drug
development outlays [4].
Successful development of an ex vivo model of the intestinal crypts requires a deep
understanding of the anatomy and
physiology of the intestine, which is a very
complex organ consisting of layers of
muscle, submucosa, and epithelial layer, with
an intricate system of nerves and blood
vessels. The intestinal crypts are
invaginations in the intestinal epithelium and
are the proliferative portion of the epithelial
layer (Figure 1). The other portion of the
4
intestinal epithelial layer, villi, are finger-like protrusions which extend into the lumen and
absorb nutrients from food ingested by the organism.
The intestinal epithelium is maintained by a pool of stem cells at the base of the crypt
called crypt base columnar cells (CBCs), also referred to as intestinal epithelial stem cells
(IESCs). The CBCs typically divide asymmetrically to generate more rapidly dividing
transit-amplyfying (TA) progenitor cells located above the IESCs in the crypt. These
progenitor cells commit to one of four distinct cell types: the enterocyte (absorptive), goblet
cell (mucous-producing), enteroendocrine (EE, hormone-producing), and Paneth cell
(antimicrobial-peptide-producing). Paneth cells migrate toward the base of the crypt, while
the other cells types migrate up the length of the villi, where they are sloughed off into the
lumen. This cell division, differentiation, and transit process is very rapid, and regenerates
the entire intestinal epithelium every 3-7 days. Underlying the epithelium is a layer of
myofibroblasts, which support the epithelium through extra cellular matrix (ECM)
production and extrinsic signaling [6, 7].
In previous studies, we have shown the ability to isolate IESCs using a Sox9 extra
green fluorescent protein (EGFP) reporter mouse model developed in our lab in which the
stem cells have a fluorescence level characterized as Sox9EGFPlow. After isolation, the
IESCs have been successfully cultured in vitro into crypt/villus-like units termed ‘enteroids,’ which consist of all four cell types of the intestinal epithelium. There are a few limitations,
though, of the in vitro model. The success rate, as defined by enteroid formation divided by plated cells, has been quite low. The enteroids also form into irregular enclosed shapes that
5 This low culture efficiency and the
uneven and inconsistent shape of the enteroids
creates the necessity to develop tools that would
allow for a more representative and functional ex vivo model of the epithelium. A supporting layer, called a scaffold, can be employed for
more systematic placement of the epithelial
tissue. Previous studies have shown that multiple
layers can be cultured on these scaffolds
allowing the directed differentiation and
expansion of stem cells [8]. Microfabrication techniques were used in the production of the
scaffolds as they are capable of high spatial resolution which allows the recreation of the
intricate architecture of the endogenous intestinal epithelium [9].
Thesis Overview
The following chapters detail the methodology and experiments that were performed
in the development of an ex vivo model of the intestinal crypts. Chapter 2 details the considerations and experiments involved in selecting a scaffold material and determining the
geometry of the scaffold that promotes monolayer formation. Chapter 3 presents our work to
characterize and optimize the isolation and culture of epithelial cells from murine mouse
models. This work is necessary for the reproducibility of the ex vivo model, allowing quantitative scientific study and analysis. Chapter 4 describes our work to develop novel
imaging and modeling of the ex vivo system. Chapter 5 includes conclusions and suggestions for future work.
6 CHAPTER 2
SCAFFOLD DEVELOPMENT
INTRODUCTION
The establishment of a favorable environment and niche for the IESCs is essential to
generating ex vivo intestinal epithelial tissue. This niche is thought to consist of the IESCs themselves, paneth cells also located at the base of the crypt, and the underlying
myofibroblasts. Extrinsic signaling between these cell types is generally considered
necessary for the proper expansion of the intestinal epithelial layer [6, 7, 10]. Recreating this
stem cell niche ex vivo requires determining the properties that are essential to generating a consistent and persistent monolayer of myofibroblasts on the scaffold.
An important consideration in generating this niche is determining a scaffold material
that will allow proper adhesion and proliferation of the myofibroblasts and epithelial cells.
To generate the complex architecture of the intestine, microfabrication was chosen for its
high spatial resolution capabilities, allowing replication of the physical structure of the in vivo environment [11]. Microfabrication is a technique that was developed out of the microprocessor industry and allows the formation of 3-D structures at the micron scale and
can be fabricated with techniques including soft lithography, photolithography, and chemical
7
Four scaffold materials were considered based on their compatibility with
microfabrication: a) polydimethlysiloxane (PDMS); b) polystyrene; c) Poly (DL-lactide)
(PDLA); and d) 1002F. PDMS is often used for microfabrication due to its ease of
manipulation and optical clarity [12]. Polystyrene is frequently used in tissue culture because
of its low cost, optical clarity, chemical inertness, and cell adhesion properties when
chemically functionalized [13, 14]. Techniques have recently been developed to allow
polystyrene fabrication via soft lithography, making it more attractive for microfabrication
prototyping and research [15]. PDLA has been FDA approved for implantation, therefore, it
is often selected as a scaffold material for tissue engineering applications. The fourth
material studied, 1002F, is a photoreactive material and, thus, photolithography can be
employed for its fabrication. Photolithography allows the fabrication of features as small as
10 µm in diameter, which some of the designs presented in this work required. 1002F is also
less auto-fluorescent than the more commonly used SU-8 [13], making it more desirable for
our application since imaging compatibility is a key requirement of the ex vivo model.
After successful development of the scaffold architecture, the mesenchymal layer,
that is, the myofibroblast monolayer, needed to be established. An extra cellular matrix
(ECM) component, bovine gelatin, was seeded onto the scaffold to facilitate adhesion of the
myofibroblasts. The age of the pups used for myofibroblast harvest was also considered.
Murine embryonic fibroblasts (MEF) are often used as feeder cells for stem cell culture in vitro as they provide the correct signaling for single stem cells. This research, however, focused on the seeding of intact crypts, not single stem cells. For the intact crypts, the goal of
the culture is more focused on retaining viability of the epithelial cells rather than proper
8
myofibroblasts from 4 to 6-day old pups were utilized as they are more developmentally
mature. Myofibroblasts from this age pups have successfully been used in previous small
intestine tissue engineering applications [16] and they also eliminate the need to sacrifice the
mother, which can reduce mouse costs.
Another critical parameter in developing the scaffold is the size of wells for the ex vivo crypts. Isolated murine crypts average 45 µm in cross-sectional diameter and 190 µm in length (data not shown). Ideally, an intestinal scaffold would contain synthetic microwells of
the same size; previous studies have noted, however, that fibroblasts obstructed the openings
when cultured in wells less than 200 µm in diameter [8]. The diameter of the wells were
varied to determine a size that would: a) allow a consistent monolayer to form; b) allow the
diffusion of key nutrients to the tissue within the wells; and c) allow epithelial tissue to seed
into the biological scaffold.
The surface of the microfabricated scaffolds is substantially increased by the array of
synthetic crypt microwells. Both Table 1 and Figure 3 depict the increase in surface area of
the scaffolds over a flat surface when varying the depth and diameter of the microwells. This
increase in surface area is of utmost importance when considering the number of seeded
myofibroblasts required to generate a consistent monolayer.
9 The diffusion of key
nutrients into the sub-mm
size of the microwells was
also a concern. Intestinal
fibroblasts require nutrients,
especially glucose and
glutamine, to maintain
cellular homeostasis [17]. Comsol, a differential equation modeling software, was used to
verify that both glucose and glutamine diffused into the microwells at a sufficient rate to
promote equilibrium. Due to the large increase in surface area of the scaffolds and the
additional number of fibroblasts required to create a monolayer, we also calculated the total
amount of nutrients that would be consumed by the myofibroblasts in culture.
The microwells also had to be of sufficient diameter to allow epithelial tissue to seed
into them following myofibroblast seeding. Single intestinal epithelial stem cells (IESCs) and
intact crypts were considered as potential options for seeding onto the biological scaffolds.
IESCs are smaller and, thus, have higher seeding rates than intact crypts. However, intact
crypts have higher culture efficiencies, shorter and less expensive isolation since cell sorting
is not required, and can be used with any mouse model since stem cells do not need to be
isolated. With these considerations, the benefits of intact crypts outweighed those for single
cells, and this research focused on intact crypts.
10 MATERIALS AND METHODS
Scaffold Materials
Polystyrene used for microfabrication in these studies was obtained and prepared as
previously described [15]. PDLA was purchased from Purac (Lincolnshire, IL) and is sold
commercially as Purasorb PDL 05. PDMS was prepared from the Sylgard 184 silicone
elastomer kit (Dow Corning, Midland, MI).
Formulation of 1002F photoresist
Microstrainers were manufactured with 1002F photoresist, which was formulated by
mixing 1002F resin, photoinitiator (triarylsulfonium hexafluoroantimonate salts), and solvent (γ-butyrolactone) as previously described [13]. The weight ratio of resin : photoinitiator :
solvent was 49 : 4.9 : 46.1 for formulation 10, and 64 : 29.6 : 6.4 for formulation 100.
Formulation 10 and 100 generated 1002F film thickness of around 10 and 100 µm,
respectively, when the spin coating speed was set at 2000 rpm.
Microstrainer Fabrication
Methodology for the fabrication of the microstrainers is described in a previous
publication [18]. Figure 4 shows a detailed schematic of the fabrication process to create the
microstrainers, which was a two-layer process. A 1002F film of 10-µm thickness was
spin-coated on a clean glass slide at 2000 rpm using 1002F photoresist (formulation 10) (Figure
4-ii). After baking at 95 C for 10 min, the film was exposed to UV light at a dose of 1000
11 followed by a 120 °C hotplate for 5 min. The
sample was then developed for 45 sec, and baked
on a 120 °C hotplate for 60 min (Figure 4-iv). To
prevent trapping of air bubbles during the second
layer coating step, the sample was treated with air
plasma for 5 min to make its surface hydrophilic.
A second 1002F layer of 100-µm thickness was
spin-coated at 2000 rpm using 1002F photoresist
formulation 100 (Figure 4-v), baked at 95 C for
60 min, exposed to UV light at a dose of 1000
mJ/cm2 (Figure 4-vi), post-exposure baked at 95 C for 10 min, and then developed for 15 min
(Figure 4-vii). The film was solidified by baking it
on a 120 °C hotplate for 60 min. Finally, the
sample was soaked in a soap solution overnight to facilitate release of the freestanding film
from the glass slide (Figure 4-viii). The solid bottom wells were fabricated with the same
process, except that the entire 10 µm thick bottom layer was exposed to UV light to create a
surface without any openings.
Mice/Genotyping
All mice used in this study were maintained on a 12:12-h light-dark cycle in
American Association for Accreditation of Laboratory Animal Care-approved facilities.
CD-1 mice were used for myofibroblast isolation. Sox9EGFP mice were used for intestinal crypt
isolation. The Sox9EGFP mouse line contains genomic integration of a modified BAC Figure 4. Microstrainer array.
12
(RP32-140-D18) with ~75.5kb upstream and ~151kb downstream sequence to Sox9. This
mouse line was initially created as part of the GENSAT Brain Atlas Project [19]. Frozen
Sox9EGFP mouse embryos were obtained from the Mutant Mouse Regional Resource Center
at the University of California at Davis and were reconstituted by transfer into foster mice.
This mouse strain was maintained as heterozygotes on the CD-1 genetic background. Mice
bred normally and progressed to adulthood without any overt phenotypes due to the
transgene. About 10 days after birth, tails were snipped and viewed under an epi-fluorescent
microscope fitted with filters for visualizing EGFP to determine phenotype.
Intestinal crypt isolation
Ten cm of jejunal tissue from 6 to 10 week old Sox9EGFP mice was incubated in
PBS containing 4 mM ethylenediaminetetraacetic acid EDTA and 1 mM Dithiothreitol
(DTT) for 30 min at 4°C on a rotating platform. Villi were removed by light shaking at a
force of 1 to 2 times gravity for 10 back and forth cycles. The tissue was transferred into a
tube with PBS. Crypts were released by vigorous shaking (3 to 4 times gravity) at 2.5 to 3
back and forth shake cycles per second for two minutes. Crypts were then passed through a
70 µm filter (Becton Dickenson) to remove larger contaminating villi. Sucrose was added to
a final concentration of 4% w/v and the solution was pelleted at 13g for 7 min to remove
debris and single cells.
Myofibroblast isolation and culture
Gut myofibroblasts were harvested from 4 to 6-day-old murine CD-1 pups. The
small intestine was cut into 2 mm x 2 mm sections and rinsed of debris and fecal matter at 4o
13
mg/mL Streptomycin, P/S). The intestinal fragments were allowed to settle and the
supernatant was removed. The wash procedure was repeated 8 times. The intestinal
fragments were then minced to 1 mm X 1 mm segments with a new razor blade and added to
6 mL of DMEM with 0.3U/mL dispase (BD Biosciences, Franklin Lakes, NJ), 300 U/ml
collagenase I (Sigma), and P/S (50 µg/mL, 50 mg/mL). The resulting solution was placed on
an orbital shaker and allowed to incubate at room temperature for 25 min.
After incubation, the myofibroblast isolation procedure consists of a sequential and
repetitive dissociation of the same intestinal segments. 10 mL of DMEM with 10% FBS was
added to the solution and mixed by pipetting 50 times to break apart the intestinal fragments.
The fragments were allowed to settle for 1 min in a 50 mL conical tube and the supernatant
was removed and transferred to a new tube. Fresh 10 mL of DMEM with 10% FBS was
added to the initial tube with intestinal fragments and the solution was again mixed 50 times
by pipetting. After allowing the fragments to settle, the supernatant was removed and
combined with the first supernatant. The initial fragments were re-suspended in DMEM and
10% FBS and both solutions were pelleted at 200g. Supernatants were removed and each
pellet was re-suspended in 10mL of DMEM with 10% FBS, P/S (50 µg/mL, 50 mg/mL),
Gentamicin (50 µg/mL, Sigma), and Glutamax (1X, Gibco). Both cell solutions were plated
in a 10 cm plate and the media changed for each of the first two days to minimize the chance
of contamination.
Cells were cultured at 37o C in 5% CO2. After two weeks in culture, the Gentamicin
was removed. Media was changed every 3-4 days until the cultures became confluent.
When the cultures achieved confluency, they were detached by trypsin, split into 3 equal
14
eliminate non-fibroblastic cells. Cells were used before passage 15, as a transformation to a
more muscle-like phenotype was observed around this time.
Material Comparison
Plasma-treated polystyrene was obtained from BD Falcon (Cat# 353043) and used
without further treatment. PDMS, PDLA, and 1002F were thinly coated on glass coverslips,
cured on a hot plate, and vacuum-gas plasma oxidized for 5 min. Gut myofibroblasts were
pipetted onto fifteen samples of each material at 12,000 cells/cm2. At each time point after
the initial plating (1 hour, 24 hours, 2 days, 4 days, and 8 days), three samples of each
material were rinsed with PBS to remove non-adherent cells and fixed with PFA. Nuclei
were stained with Bisbenzimide (Sigma), and cells were counted in three separate fields of
view with fluorescent imaging. Population doubling times of the cell cultures were calculated
using the algorithm provided by http://www.doubling-time.com [20].
Statistics
15 RESULTS
Gut myofibroblast proliferation is faster with PS, PDLA, and 1002F, than with PDMS
A critical component of tissue engineering is finding the correct scaffold material for
each particular tissue type. In developing the ex vivo intestinal model, we hypothesized that scaffold material could impact the development of the tissue. We focused primarily on
proliferation rates of gut myofibroblasts on polystyrene, PDLA, 1002F, and PDMS, which
are compatible with
microfabrication.
To determine the
proliferation rates of gut
myofibroblasts on the four
materials, MFs were seeded at
12,000 cells/sq. cm., cultured
for eight days, and cell
numbers were counted at time
points 1 hour, 24 hours, 2 days,
and 4 days after the initial
plating. The material surfaces
had warped by day 8, which
likely skewed the cells counts,
therefore, cell counts at day 8
are not reported here.
16
Proliferation was the most rapid and logarithmically linear for myofibroblasts cultured on
polystyrene. Cell doubling time was 1.82 days for the first four days. The number of
myofibroblasts doubled on each of the first two days, followed by a slower proliferation rate,
likely due to cell contact inhibition as the MFs approached confluency (Figure 5A) [21]. The
fibroblast density also appeared to plateau around 30,000 cells/sq.cm (data not shown).
Myofibroblast proliferation rates were slightly slower on both 1002F and PDLA (3.56 and
3.50 days, respectively) and slowest on PDMS (4.29 days). The growth curves were also not
as logarithmically linear for MFs cultured on 1002F, PDLA, and PDMS (Figure 5A).
Microwells with 10 µm openings in their base facilitate increased crypt seeding
After verifying that several
materials were compatible with gut
myofibroblast adhesion and
proliferation, the dimensions of the
synthetic crypt microwells
necessary for myofibroblast
monolayer formation and crypt
seeding was explored. As stated
earlier, murine crypts average 45
µm in diameter, therefore
microwells diameters would ideally
be near this size to recreate the in vivo environment. Preliminary
Figure 6. Myofibroblasts seeded onto
17
experiments showed, however, that myofibroblasts spread over the surface of the chips and
occluded microwells with diameters of 50, 75, and 100 µm. To determine a microwell size
that would not be occluded by the fibroblasts and would allow crypt seeding, PDLA chips
with arrays of microwells were fabricated with diameters ranging from 125 µm to 200 µm
(Figure 6 A,B,C). The chips were seeded with myofibroblasts at a density of 60,000 cells/sq.
cm and cultured for two days. Light microscopic examination revealed that many of the
microwells were either partially or fully occluded by myofibroblasts spanning the opening of
the wells (See Figure 6 D,E,F for a graphic representation).
Early experiments showed that very few of the intact crypts successfully seeded into
the microwells with solid bottoms after myofibroblasts had been seeded. We hypothesized
that openings in the base of the crypt would create a slight flow through the wells and,
therefore, increase the number of crypts settling into the wells. Ten-µm diameter circular
openings (Figure 7A) were chosen since they are small enough to prevent transit of
fibroblasts and crypts, but large enough to allow the passage of fluids. This array of wells
with 10-µm openings will be referred to as ’microstrainers’, and were fabricated with 1002F
as described in the Materials and Methods section.
To determine if microstrainers would increase the number of crypts settling into the
wells, fibroblasts were first seeded in both microwells with solid bases and microstrainers at
a density of 30,000 cells/cm2. Intestinal murine crypts were seeded 2 days after the initial
fibroblast seeding in a solution of DMEM at 1,000 crypts/mL. (Crypts often aggregated
when seeded at densities greater than 1,000 crypts/mL, preventing them from settling into the
wells [data not shown]). The crypt solution was pipetted onto the microstrainers and allowed
18
equaled half the number of microwells. Seeding more than this set number of crypts would
have skewed the seeding efficiency by increasing the chance of multiple crypts settling in
one microwell. The probability of any given well containing 0, 1 or 2 crypts is defined by
the Poisson distribution:
( )
Where k = number of crypts seeding into a well (in this study, k could be 0,1,2, etc.)
k! = the factorial of k
ƛ = simple probability that one crypt will seed into a well (i.e., if 10 crypts are seeded into an array of 100 wells, ƛ would be set at 0.10. ƛ remains constant for varying values of k. See Table 2 for examples of k and ƛ values.)
e = base of the natural logarithm (e=2.71828...)
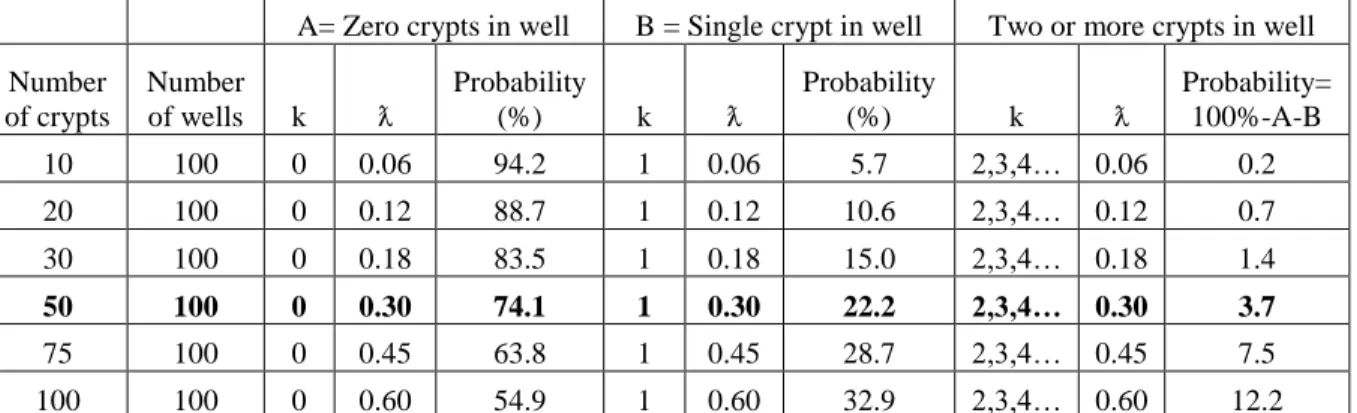
Table 2. Crypt seeding probabilities as governed by the Poisson distribution, F(k,ƛ) = (ƛk e-ƛ)/k!. Values are based on a 200 µm diameter well with 25 µm spacing. These dimensions create a surface that is approximately 60% open well and 40% intervening areas. ƛ was set by assuming that 50% of the surface area of the crypt would need to be positioned above the well to allow the crypt to settle into the well. The percent chance that any one crypt would seed into a well is very near 60% for vertical and horizontal orientations of the crypts as they settle. ƛ was thus calculated as 0.60*(# of seeded crypts/# of wells).
A= Zero crypts in well B = Single crypt in well Two or more crypts in well
Number of crypts
Number
of wells k ƛ
Probability
(%) k ƛ
Probability
(%) k ƛ
Probability= 100%-A-B
10 100 0 0.06 94.2 1 0.06 5.7 2,3,4… 0.06 0.2
20 100 0 0.12 88.7 1 0.12 10.6 2,3,4… 0.12 0.7
30 100 0 0.18 83.5 1 0.18 15.0 2,3,4… 0.18 1.4
50 100 0 0.30 74.1 1 0.30 22.2 2,3,4… 0.30 3.7
75 100 0 0.45 63.8 1 0.45 28.7 2,3,4… 0.45 7.5
19
The number of seeded crypts was assessed in four arrays of 100 wells using light
microscopy (Figure 7B). The number of crypts seeding into 125 and 150 µm diameters wells
were not assessed as many of the wells were occluded by myofibroblasts and seeding
efficiencies were nearly zero (data not shown). Our results demonstrate that circular
openings in the base of the microwells nearly doubled the percentage of crypts that seed into
the wells compared to solid bottoms for 200 µm diameter wells (7.8±0.5% vs. 3.8±0.5%,
P<0.01, Figure 7C). Seeding efficiencies in the microstrainers for the 175 µm diameter wells
were slightly lower than the 200 µm diameter wells (4.8±1.0% vs. 7.8±0.5%, P<0.05, Figure
7C).
20
Shorter fibroblast seeding times increase crypt seeding efficiency
Although microstrainers increased the number of crypts settling into the wells,
seeding efficiency was less than 8%. The efficiency should be approximately 25% based on
the geometry of the microwells, the number of seeded crypts, and the Poisson distribution
(See Table 2). Light microscopy showed that, as expected, the pre-seeded fibroblasts had
attached and spread, obstructing some of the 10 µm openings, which likely limited the flow
rate through the wells. We hypothesized that shorter pre-seed durations would result in a
higher seeding efficiency. To test this hypothesis, three separate conditions were evaluated.
For the first two conditions, myofibroblasts were seeded into the microstrainers at similar
densities (30,000 cells/cm2), but the pre-seed durations were varied (i.e., 2 days for the first
and 1 hour for the second). In the third condition, myofibroblasts were only seeded along
with the crypts, thus, it was the control or “no pre-seed” condition. Intestinal murine crypts
were seeded and assessed as described in the previous section. Our results show that seeding
efficiencies increase with decreased fibroblast pre-seeding durations. Seeding efficiencies
were highest with the “no pre-seed” condition (15.8±0.6%, p<0.01), but also increased with
the one hour pre-seeding (11.8±0.9%, p=0.02) when compared to the two-day pre-seed in the
microstrainers (7.8±0.5%, Figure 7D). Seeding efficiencies in the microstrainers were lower
in the 175 µm than in the 200 µm diameter well for all pre-seed durations (No pre-seed,
8.8±0.6% vs. 15.8±0.6%, P<0.01; 1 hour pre-seed, 9.3±0.6% vs. 11.8±0.9%, P<0.05; 2 day
21
Key nutrients fully diffuse into the synthetic crypt microwells within 30 minutes
Due to the small geometry of the microwells, there was a need to confirm the ex vivo model would be continually supplied with the nutrients glucose and glutamine, which have
been shown in previous research to be necessary for intestinal epithelial homeostasis [17]. In
the referenced work, rat epithelial cells were found to metabolize 20 nmol glucose/(hr*mg
cell dry matter). Factoring in an average cell dry matter mass of 3 ng/cell and the molecular
weight of glucose, 180.16 g/mol, the metabolization rate converts to 0.26 ng
glucose/(cell*day). The study found the metabolic rate of glutamine to be 17 nmol
glucose/(hr*mg cell dry matter) by rat intestinal epithelial cells. With a molecular weight of
146.15, the metabolic rate of glutamine converts to 0.18 ng/(cell*day).
To verify the diffusion, a differential equations fluid modeling software, Comsol, was
employed. The convection and diffusion feature in Comsol, which solves the diffusion
equation (given below), was selected for this study. A transient analysis was run in Comsol
with a duration of four days since media in the cultures is normally changed every 3 to 4
days. The values entered into Comsol are given in Table 3.
( )
( ) ( )
Where: Φ(r,t)=density of the diffusing material at a location ra and time t
D(Φ,r) is the collective diffusion coefficient for density Φ at location r
22 Table 3. Comsol input parameters.
Comsol input Value Basis for chosen value
Diffusion coefficient 3x10⁻¹⁰ m2/s Diffusion coefficient of glucose in water is 6x10⁻¹⁰ m2/s at 25oC. This value was halved for a
conservative estimate of glucose and glutamine in DMEM and Matrigel.
Beginning concentration of glucose [and glutamine]
25 mol/m3 [6 mol/m3]
4500 mg/L glucose in DMEM.
4mM Glutamine in DMEM supplemented with 2mM GlutaMAX OR No Glutamine in Advanced DMEM/F12 with 6mM GlutaMAX added
Uptake (flux) of glucose [and glutamine] within microwells
-4.9x10⁻⁹ [-3.4x10⁻⁹] mol/(m2*s)
Assuming 30,000 cells per sq. cm., the # of cells in each 200 µm well works out to 28. An uptake per cell of 0.26 ng glucose/(cell*day) [calculated above] was also factored in.
Height of media layer 1.27 mm Based on 10 ml of media in a 10 cm culture dish
Comsol modeling with the given parameters showed that the concentrations of
glucose and glutamine should stabilize in the cultures within 30 minutes (data not shown).
The diffusion rate varies with the temperature of the fluid, the viscosity of the fluid, and the
size of the particle of the diffusing molecule. All else being equal, smaller particles diffuse
more rapidly than larger particles. Because glutamine and oxygen are smaller molecules than
glucose (molecular weight 146 and 32 vs. 180), their diffusion in DMEM is more rapid than
glucose (data not shown).
Supplementing glutamine concentrations may be necessary for proper intestinal epithelial
homeostasis
In addition to the diffusion of key nutrients, the total consumption of glutamine and
glucose in culture was considered. To determine whether the amount of nutrients provided to
23
supplied and also metabolized was calculated. Oxygen was not a concern as it is in constant
supply in the atmosphere provided to the cultures. For glucose and glutamine, the previously
calculated values of 0.26 ng glucose/(cell*day) and 0.18 ng glutamine/(cell*day) were used
for the consumption calculation. To calculate the total number of cells metabolizing
nutrients, both the number of myofibroblasts and the epithelial cells in one sq. cm of the ex vivo culture were estimated. Assuming 30,000 myofibroblasts/sq.cm for a flat surface (Figure 5A) and a 350% increase in surface area for wells with 200 µm diameter, 200 µm depth, and
25 µm outside diameter spacing (Table 1), the number of myofibroblasts in one sq. cm is
105,000 for the ex vivo cultures. To calculate the number of epithelial cells, the number of crypts and the number cells in each crypt were estimated. The number of 200 µm diameter
wells with 25 µm spacing in one sq. cm is 1600. Assuming 250 cells per crypt in a mouse
[22], the number of epithelial cells in one sq. cm is 400,000. The rate of nutrient consumption
calculated as 131,000 ng glucose/(sq. cm.*day) and 90,000 ng glutamine/(sq. cm.*day).
To calculate the quantity of nutrients supplied to the culture, the concentration of the
nutrients and the volume of the media were determined. As stated in Table 3, the
concentration of glucose in the media used in this study is 4500 mg/L and glutamine is 6
mM, which converts to 877 mg/L of glutamine. Next, the volume of media supplied to one
sq. cm of the ex vivo culture was estimated. We assumed 10 mL of media is added to a 10 cm culture plate with a surface area of 78.5 cm2. The volume supplied to one sq. cm is calculated
as 0.127 mL. The amount of glucose and glutamine supplied to one sq. cm of the culture is
then calculated as 572,000 ng glutamine and 110,000 ng glutamine. Using the consumption
24
days. These figures suggest the amount of glutamine supplied to the cultures should be
increased to avoid the necessity of changing the media daily.
DISCUSSION
This chapter presents experiments conducted in the development of a 3-D biomimetic
scaffold that promotes a monolayer of myofibroblasts and allows the seeding of intestinal
crypts into synthetic microwells. The ability of several materials to facilitate adhesion and
proliferation was first characterized. Our experiments showed that myofibroblasts cultured
on polystyrene, PDLA, and 1002F, proliferated more rapidly than on PDMS. During the
culture, the myofibroblasts formed aggregates of cells, leaving portions of the scaffold
uncovered for several days on all materials except polystyrene. This cell aggregation was
most pronounced on days 2 to 4 after initial cell seeding and likely limited cell proliferation
(Figurea 5 A,B,C). Following this initial aggregation and slowed proliferation, the
myofibroblasts began dividing to fill intervening opening spaces (Figure 5B). Cell
aggregation could be the result of the scaffold becoming more hydrophobic after plasma
oxidation as PDMS has been shown to lose charge stability within a few hours [23]. Future
studies could explore more advanced ECM coating techniques that promote retention of the
scaffold material hydrophilicity. The commercially treated polystyrene was found to promote
proliferation more logarithmically linear and more rapid than the other materials. PDMS,
PDLA, and 1002F were all treated in the lab with plasma oxidation and ECM coating. To
25
oxidation and ECM coating strategies may need to be standardized and more technologically
advanced.
Myofibroblast proliferation was slowest and aggregation most pronounced on PDMS
than on all other materials, therefore this material was eliminated as a possible material for
the ex vivo scaffold. Myofibroblast proliferation was similar on PDLA and 1002F, therefore the proliferation rate does not need to be a consideration when choosing between these two
materials.
Experiments were also conducted to determine the dimensions of the microwells that
would allow: 1) the formation of a monolayer of fibroblasts; 2) crypts to seed into the
microwells; and 3) the diffusion of key nutrients into the microwells. The experiments
conducted in this study demonstrated that microwells of 200 µm diameter and depth met the
criteria for crypt seeding and nutrient diffusion. Shortening fibroblast seeding times and
creating small openings in the bottom of the wells were also shown to enhance seeding
efficiencies. Theoretical seeding efficiencies were also calculated based on microwell
dimensions, crypt dimensions, the number of seeded crypts, and the Poisson distribution.
Comsol analysis showed that glucose and glutamine readily diffuse into the wells. Total
nutrient calculations showed that glucose supplied to the cultures is sufficient for four days,
but the amount of glutamine should be elevated by increasing either the concentration of
glutamine or the volume of the media added to the cultures. These experiments and the
seeding efficiency characterization are applicable to lab-on-a-chip, organ-on-a-chip, and
tissue engineering applications which involve seeding cells or cell conglomerates into
26 CHAPTER 3
OPTIMIZATION AND CHARACTERIZATION OF CRYPT ISOLATION
INTRODUCTION
We have recently shown the ability to culture IESCs in vitro into enteroids which consist of all four cell lineages of the intestinal epithelium [24]. This culture system is a
powerful tool that can be used to study the signaling pathways responsible for proliferation
and differentiation of IESCs, study the effects of various pharmaceuticals on epithelial tissue
at the cellular level, and expand epithelial tissue for subsequent transplantation into patients
whose intestinal epithelium has been damaged by necrotizing enterocolitis, cancer, or other
diseases sometimes requiring intestinal tissue resection.
In the creation of this in vitro culture, primary epithelial tissue is isolated from murine or other animal models. Many labs, including ours, use a chelation step to isolate the
epithelial tissue and this procedure has been studied extensively [25, 26] Despite previous
work, the quantity and viability of isolated tissue is highly variable.In addition, the isolation
of IESCs has only been accomplished very recently, and the downstream potency of the stem
cell population has not been fully characterized [27].Standardizing the isolation and culture
of epithelial tissue and IESCs will facilitate the establishment of quantitative assays to allow
27
Our strategy was to approach this standardization as a workflow engineering problem
and to optimize each step of the process. The isolation step was first examined. The isolation
procedure entails incubating the intestinal tissue in EDTA followed by a crucial step in which
the tissue is shaken by hand to remove the epithelial layer from the basement membrane.
This hand shaking step clearly introduces variability to the isolation procedure. By studying
the force and frequency of the shaking procedure, we sought to characterize the amount and
viability of tissue isolated, and minimize variability.
If whole crypts are desired, following release from the basement membrane, the tissue
is rinsed and is ready for downstream use. Some research studies, however, require single
IESCs. To isolate the stem cells, following isolation, the epithelial tissue is dissociated to
single cells to allow cell sorting. Typically, dispase has been used for dissociation, however,
recent work found that trypsin provided the best balance of dissociation efficiency, viability,
and antigen retention for neural cells [28].In the work presented herein, dispase and trypsin
were compared for their ability to dissociate epithelial tissue to single cells while maintaining
the integrity of important cell surface receptors CD24 and CD44.
IESCs must be separated from the intestinal tissue by FACSorting to allow single cell
culture. Tissue from a Sox9EGFP reporter gene mouse model was used for the isolation. In previous work, we demonstrated that ‘low’ levels of Sox9, designated Sox9EGFPlow, mark cells that are enriched for IESC gene markers including Lgr5, Olfm4, and Ascl2 [24]. By design, FACS is meant to preserve the viability of cells, however we had recently learned
that hematopoietic cell viability could be increased by changing FACS parameters such as
the nozzle size. We sought to determine whether the viability and culture efficiency of
28 MATERIALS AND METHODS
Mice/Genotyping
All mice used in this study were 6 to 10 weeks old and were maintained on a 12:12-h
light-dark cycle in American Association for Accreditation of Laboratory Animal Care-approved
facilities. C57BL/6J mice were used for the majority of the experiments and were procured
from Jackson Laboratories. Sox9EGFP mice were used for the FACS optimization
experiments.
Tissue Isolation
For all experiments, mice were drop anesthetized in isoflurane and sacrificed by
cervical dislocation. The small intestine was removed by cutting at the pyloric sphincter and
immediately proximal to the cecum. The first 2 cm distal to the pyloric sphincter was
designated as the duodenum, which was removed and discarded. The next 10 cm segment
(from 2 to 12 cm distal to the pyloric sphincter) was designated the jejunum. This segment
was collected and used for all experiments in this study.
Removal from basement membrane
To begin the epithelial isolation and remove mucus, intestinal tissue was first incubated for 20 min on ice in Dulbecco’s phosphate buffered saline (DPBS) containing 30
mM ethylenediaminetetraacetic acid (EDTA) and 1.5 mM Dithiothreitol (DTT). The tissue
was transferred to a 15 mL conical tube containing 6 mL of DPBS and 30 mM EDTA and
29
frequency and acceleration of the shakes were measured using the accelerometer in the Apple
iPhone. Using Context Logger, a free application available online, the characteristics of the
shaking procedure could be viewed in real-time and uploaded into Microsoft Excel. See
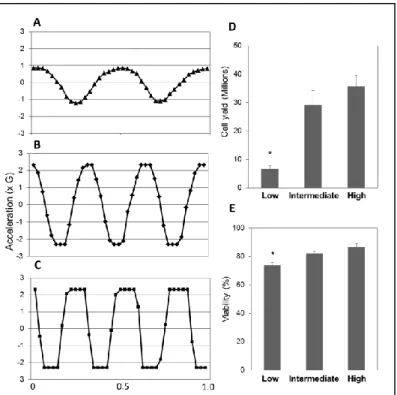
Figure 8 for examples of the various shaking alternatives tested in this study.
To assess the amount of epithelial tissue removed, the remnant intestinal tissue was
Swiss-rolled and fixed in optimal cutting temperature (OCT) compound (Sakura Finetek
USA, Inc, Torrance, CA). Tissues were sectioned and stained with Bisbenzimide (Sigma)
and an epithelial cell adhesion molecule (EpCAM) antibody preconjugated to Alexa Fluor
647 (Biolegend, San Diego, CA). The entire section was then imaged and analyzed using
Image J. The crypts and villi were often removed in continuous sections; therefore, the
percent of epithelial tissue removed was measured by summing the length of the sections
removed along the longitudinal axis of the intestinal tissue and dividing by the total length of
10 cm.
Separation of crypt cells from villus cells
Due to the relatively small population of crypt cells in the intestinal epithelium, it is
sometimes necessary to enrich for either crypt or villus cells. Two different methods of
accomplishing this were compared: filtering, and mechanical separation by scraping. In the
filtering method, after removing the epithelium from the basement membrane, the epithelial
tissue was passed through a 70 µm filter (BD Falcon) with the goal of collecting the villi in
the filters and allowing the crypts to pass through. In the scraping method, the intact
intestine was first cut into 5 cm segments and everted on to a pasteur pipette. The everted
30
for 5 min then laid flat on a petri dish and each mucosal side was scraped very delicately with
a cover slip to remove the villi. Each of the preparations were then dissociated to single cells
and analyzed by flow cytometry to determine the corresponding percentages of crypt cells.
Dissociating to single cells
If intestinal epithelial cells are to be analyzed by flow cytometry, dissociating them to
single cells is necessary. In the standard protocol, dispase (Collaborative Biomedical,
product discontinued) is added to HBSS at 0.3 U/mL and the cell preparation is incubated in
this solution for 10 min. Trypsin (TrypLE Express, Invitrogen) was also tested for its ability
to dissociate the epithelium to single cells and avoid cleaving important cell surface receptors
such as CD24 and CD44. Cell fractions from five WT mice were split in half and dissociated
by incubating for 10 min in either dispase or trypsin. Dissociation to single cells was
evaluated by counting with the aid of light microscopy and by flow cytometry. For the visual
counting, cells from three separate samples were counted under a Zeiss Axiovert 40C
microscope. Four separate fields of view were counted for each sample to ensure accurate
numbers. Doublets were counted as two cells, and multimers with three or more cells were
counted as three and a half. The percent of single cells was then calculated as the number of
single cells divided by the total number of counted cells.
For flow cytometry, cells were analyzed under side scatter height versus side scatter
area. Single cells fell along a narrow diagonal line in this plot, and the percentage of cells in
this population was recorded. Cell fractions were also stained with anti-CD24 preconjugated
31
antibodies and evaluated by flow cytometry for their corresponding percentages of cells
expressing the target surface receptors.
FACS
The final step in the systematic evaluation of this protocol was to evaluate the
survival rate of epithelial cells after FACS. After dissociating to single cells, cells were
filtered through a 40 µm filter and rinsed with HBSS. Cells were then resuspended in
Advanced DMEM/F12 (Gibco), with supplements as described in previous work (Gracz,
2009). Cells were stained with propidium iodide (PI, Invitrogen) and sorted by FACS. Dead
cells and lymphocytes were excluded by side scatter versus forward scatter, and doublets
were excluded by side scatter height versus side scatter area as previously described. Cells
positive for PI were then excluded and the PI negative cells were sorted into Advanced
DMEM/F12 media with the previously stated supplements and allowed to incubate on ice for
90 min. Cells were stained with PI again and analyzed by flow cytometry.
Statistics
The data are presented as the mean ± SEM.
RESULTS
The removal of epithelial tissue from the intestinal basement membrane can be
standardized
One critical and highly variable step in epithelial isolations is the removal of the
32 typically shaken by hand in a 15
mL conical tube to release the
epithelial tissue from the
underlying lamina propria. To
improve reproducibility between
centers, technicians, and
experiments, the removal of the
epithelial tissue during the hand
shaking step was standardized.
Three variations of shaking force
were tested, classified as low (1
times gravity, 1G), intermediate
(2.5G), and high (>2.5G) (Figure
8 A,B,C). The intermediate and
high shaking force removed a
similar number of cells (29.2±5.0
x106 vs 35.6±3.9 x10⁶, p=0.37,
Figure 8D). The cells isolated with the intermediate and high shaking force also had similar
viabilities (82±1 vs. 87±, p=0.23, Figure 8E), however, a larger percentage of crypts and villi
were dissociated to single cells and cell aggregates with the high shaking force. Shaking
forces slightly above 2.5g, therefore, are not detrimental to cell viability, and can be
33
produced fewer cells than the intermediate force (6.7±1.1 x10⁶ vs. 29.2±5.0 x10⁶, p<0.05,
Figure 8D) and cells were also less viable (73±2 vs 82±1, p<0.05, Figure 8E).
The suggested frequency of the shake, between 2.5 and 3 back and forth cycles per
second, was chosen to promote a natural rhythmic motion and organically produce the
intermediate force. This frequency also allows for 75 to 90 shake cycles in 30 seconds. This
number of shake cycles is suggested for its ability to remove a large portion of the crypts,
about 80 to 85%.
Mechanical scraping of the intestine facilitates crypt enriched fractions
IESCs constitute less than 1% of total epithelial cell preparations; therefore, sort
times can sometimes be several hours. Sort times can be reduced by generating a cell
preparation with a larger percentage of crypt cells, i.e. a crypt enriched preparation. To
determine whether crypt enrichment is possible and reproducible, two methods were studied
and compared to a total epithelial cell preparation: a filtering method, and mechanical
separation of the crypts from the villi with a glass cover slip. Since murine intestinal crypts
are on average 45 µm in diameter, the hypothesis for the filtering method was that passing
the cell solution through a 70 µm filter would filter out the larger villus cell aggregates while
allowing the crypts to pass through. During this experiment, light microscopy demonstrated that a large percentage of the epithelial tissue was removed in ‘crypt-villus units’ consisting
of one villi and several attached crypts. Therefore, while filtering out the larger villus pieces,
the crypts were also filtered out. To quantify these findings, cell preparations were analyzed
by flow cytometry and compared to the standard total epithelial cell preparation. Sox9EGFP
34 are localized to the crypts. Sox9EGFPlow and
Sox9EGFPsublow fluorescent intensities mark
IESCs and transit amplifying cells, respectively,
and both cell types are located in the crypts. The
analysis paralleled our visual observations and
confirmed there was a trend toward
de-enrichment of crypts with the filtering method
versus the total epithelial preparation
(2.18±0.75% vs. 2.45±0.75%)
In the scraping method, jejunal tissue
was everted and soaked in a 10 mM EDTA
solution for 5 min. The tissue was laid flat on a
petri dish and very lightly scraped with a glass
coverslip to remove the villi. The remnant
intestinal segment was then incubated as
described earlier and the crypts removed by the
hand shaking step.
Light microscope examination of the
tissue scraped off with the coverslip
demonstrated a portion of the crypts were removed with the villi. Flow cytometry was used
as described above to quantify the percentages of crypt cells in each of the cell fractions: the
tissue removed during the scraping and the tissue removed during the hand shaking step.
35
in the percentage of crypt cells compared to the total epithelial preparation (5.50±1.00% vs.
2.45±0.75% P<0.05, Figure 9A). To verify cells were not being lost in the scraping method,
the total number of cells isolated by each method was determined. Both the total epithelial
method and the scraping method (when totaling the crypt and villus fractions) generated cell
preparations with 220,000±50,000 crypt cells (Figure 9B).
Crypt cells remain more viable than villus cells after dissociation
To ensure mechanical scraping of the epithelial tissue was not causing decreased
viability of the isolated cells, cell preparations from Sox9EGFP mice were stained with PI
and analyzed by flow cytometry. Preliminary experiments showed the scraping procedure
generated total cell
preparations with
viabilities of 64±6%.
Previous literature
noted the use of an
anoikis inhibitor,
Y27632 (10 µM,
Sigma, #Y0503),
during culture to
improve viabilities
[29]. We hypothesized
that viabilities could be
improved by adding the
36
anoikis inhibitor to cell solutions immediately after their removal from the mesenchyme.
After adding the anoikis inhibitor at this point in the isolation, cell viabilities from the
scraping method increased to 86±2%, which is very similar to viabilities from the standard
preparation (data not shown).
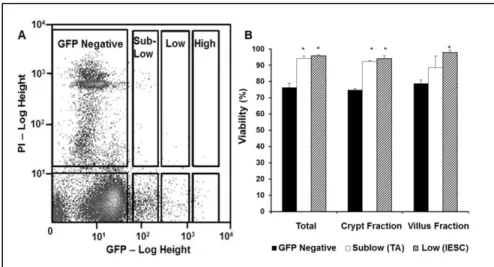
Interestingly, crypt cells were also observed to be more viable than villus cells. Both
the IESCs and the transit amplifying cells, characterized by Sox9EGFPlow and
Sox9EGFPsublow fluorescent intensity, had cell viabilities of 94±1%, while villus cells,
characterized by Sox9EGFPneg fluorescence, had viabilities of 77±1% (Figure 10 A,B).
Trypsin and dispase are equally effective at single-cell dissociation and preserving the
integrity of important surface receptors
Dispase has typically been used for dissociation during cell preparations [24];
however, recent work has cited the use of trypsin [30]. To determine whether dispase or trypsin produced a higher percentage of single cells, total epithelial cell preparations were
split in half and incubated with each reagent. Cells were analyzed for the extent of
dissociation to single cells by visual inspection and by flow cytometry. Both analyses
produced similar results; that there was a trend for dispase to more fully dissociate
preparations to single cells than trypsin (58±4 vs. 51±1 by visual counting; 68±2 vs. 64±2 by
37
Table 4. Comparison of dissociation by trypsin and dispase.
Proteases have a potential to compromise the integrity of cell surface molecules,
which may impact the ability of ligands, peptides, or antibodies to bind to these surface
receptors. CD24 and CD44 have been shown to bind differentially to IESCs, [24, 31]
therefore preserving these receptors allows IESCs to be distinguished from differentiated
cells in the intestinal epithelium in any mouse model. To determine whether trypsin or
dispase preserved CD24 and CD44 integrity, cell preparations were stained with anti-CD24
preconjugated with Pac. Blue (Biolegend, Cat# 101820) and anti-CD44 preconjugated with
APC (Biolegend, Cat# 103012) and analyzed by flow cytometry. No statistically significant
difference was observed between the percent of cells with surface receptors intact when
dissociated by dispase or trypsin (9±1 vs 7±2 CD24+, 16±2 vs. 16±2 CD44+, Table 4).
FACS does not reduce IESC viability, as measured by PI
Prior work has shown that when fluorescently sorted IESCs are plated in matrigel
with a cocktail of mitogens/morphogens, they form organoids consisting of all four cell types of the intestinal epithelium, which have been termed ‘enteroids’ [24]. These organoids had
previously been referred to as cryptoids, however, they are composed of disparate
morphologies resembling both crypts and villi. ‘Enteroids’ was therefore chosen as a more
38
As stated above, IESC viabilities were greater than 90% at the time of flow
cytometric analysis; however, fewer than 5% of the plated IESCs formed enteroids when
plated in culture suggesting FACS may be compromising cell viability. To ensure FACS
was not reducing viability of IESCs, PI negative, Sox9EGFPlow cells were sorted and
incubated on ice for 90 min. This duration was chosen as the maximum amount of time
between FACSorting and cell plating. The IESCs were post-sort analyzed by the same FACS
machine to determine viability based on PI staining. This re-analysis revealed that only 5%
of the IESC sorted population had converted to PI-positive status demonstrating FACS
conditions did not severely compromise cell viability.
DISCUSSION
In this portion of the work we sought to characterize and optimize the isolation of
epithelial cells from mouse models. By making this an engineering workflow problem, the
sources of variability in the protocol were isolated. In the initial isolation step, which
involves a hand shaking procedure, various forces of shaking were shown to cause
differential yields and viability of epithelial tissue. These differences could be sources of
error for any research study that includes tissue obtained by different technicians or in
multiple research centers. The method of tissue isolation from the basement membrane,
therefore, must be carefully defined when creating protocols for research studies.
In this study, the ability to differentially isolate crypt cells and villus cells was
demonstrated using a mechanical scraping step. This procedure is useful for any study that
39
Future work could focus on optimizing the durations and EDTA concentrations during the
chelation step and could lead to increased enrichment of crypt and villus cells.
Dissociation methods were also compared. Dispase and trypsin were found to be
relatively similar in their ability to dissociate to single cells and maintain cell surface
receptors, although there was a trend for a more complete dissociation to single cells by
dispase. Further studies could expand the list to include other surface receptors important for
intestinal epithelial research including CD166, CD29, and CD133; and also compare the
dissociation efficacy of trypsin and dispase on human tissue. These studies are useful to
translational medicine applications where dissociation of collected epithelial issue is required
for downstream transplantation or analysis.
Finally, the effect of FACSorting on stem cell viability was tested. Using Propidium
iodide as an indicator, we demonstrated that FACSorting does not significantly affect the
viability of IESCs. Further studies with other apoptosis and annoikis markers such as
Annexin V may be required to better understand the effect of FACS on the ability of IESCs