Published online May 30, 2014 (http://www.sciencepublishinggroup.com/j/cbb) doi: 10.11648/j.cbb.20140203.11
A burrows-wheeler transform based method for DNA
sequence comparison
Chun Li
1, 2, *, Huan Liu
1, Junhong Liu
1, Yuping Qin
3, Zhifu Wang
11
College of Mathematics and Physics, Bohai University, Jinzhou 121013 China 2
Food Safety Key Lab of Liaoning Province, Bohai University, Jinzhou 121013 China 3
College of Engineering, Bohai University, Jinzhou 121013 China
Email address:
[email protected] (Chun Li)To cite this article:
Chun Li, Huan Liu, Junhong Liu, Yuping Qin, Zhifu Wang. A Burrows-Wheeler Transform Based Method for DNA Sequence Comparison. Computational Biology and Bioinformatics. Vol. 2, No. 3, 2014, pp. 33-37. doi: 10.11648/j.cbb.20140203.11
Abstract:
Burrows-Wheeler Transform (BWT) is an extremely useful tool for textual lossless data compression. Recently, it has found many applications to bioinformatics. In this paper, BWT is introduced from the view of combinatorics, and then an equivalence relation on words is proposed which shows that the transformation captures some common features of equivalent words. Based on the rationale that to what extent two words differ can be evaluated by the factors excluding their common features, a matrix representation for a DNA sequence is defined by means of a “subtraction operation” between the original word and its BWT word, thus a DNA sequences is converted into a 24-D vector whose components are the spectral norms of such matrices. To illustrate the use of the quantitative characterization of DNA sequences, phylogenetic trees of the full β-globin genes of 15 species and the S segments of 13 hantaviruses are constructed. The resulting monophyletic clusters agree well with the established taxonomic groups.Keywords:
BWT, Elementary Row Operations, Equivalence, k-Word, Matrix Representation, Permutation, Phylogenetic Analysis1. Introduction
Sequence comparison is often viewed as a fundamental precondition for further study, for instance, for the identification and quantification of conserved regions or functional motifs, for profiling of genetic disease, for phylogenetic analysis, and for sequence profiling and prediction. One of the most important problems in this area is how to measure the similarity/dissimilarity between two biological sequences. The first widely accepted solution to this problem is based on sequence alignments, in which a distance function or a score function is used to represent insertion, deletion, and substitution of letters in the compared sequences. However, the computational complexity and the inherent ambiguity of the alignment cost criteria are still the bottleneck problems. In addition, as pointed out by Yang et al. [1], there are many integral properties lost if we use the alignment methods only. Therefore, the emergence of research into alignment-free measure is apparent and necessary to overcome the limitation of alignment-based measure.
The graphical representation of DNA is one kind of
ordered alphabet to another one which can be compressed easier. To compare the similarity of two sequences, Mantaci et al. [25,30] introduced an extension of the Burrows-Wheeler Transform (EBWT) and defined a class of dissimilarity measures. While Yang et al. [1] used a Burrows-Wheeler similarity distribution (BWSD) based on Burrows-Wheeler transform to express the similarity between two protein sequences. In this paper, we first introduce the algorithm of BWT from the view of the linear permutation and the circular permutation. Then we construct matrix representations for a DNA sequence by means of a “subtraction” between the sequence and its BWT sequence, on the basis of which we characterize a DNA sequence by a 24-D vector whose entries are the spectral norms of these matrices. The proposed method is tested by phylogenetic analysis on two different data sets: one is composed of full β-globin genes of 15 species, and the other is composed of S segments of 13 hantaviruses. The results show that the approach proposed in this paper is a powerful and useful tool for the comparison of DNA sequences.
2. Burrows-Wheeler Transform
Let Ω be a finite ordered alphabet. A k-word s over the alphabet Ω is an ordered k-tuple s=s1s2…sk of symbols
from Ω. The set of k-words over Ω is denoted by Ωk. Obviously, a k-word can be treated as a linear k-permutation, and thus one can naturally obtain a circular k-permutation from the k-word. Let u,v∈Ωk, and define a relation ~ on Ωk by u~v provided that u and v have the same circular permutation. Then it is easy to check that ~ is an equivalence relation, and the equivalence class of u is a subset of Ωk consisting of all words with the same circular permutation as u. We denote by CL(u) the equivalence class of k-word u: CL(u)={v∈Ωk:u~v}.
On the other hand, once a circular k-permutation is obtained from k-word u, one can easily list k linear k-permutations (repetition is allowed) corresponding to the
circular permutation. For convenience, we denote the multiset of all these linear k-permutations by CPL(u). Obviously, the underlying set of CPL(u) is the equivalence class CL(u).
The Burrows Wheeler Transform (BWT), introduced by Burrows and Wheeler in 1994, is a well founded mathematical transformation on sequences, and is considered as an extremely useful tool in the field of lossless textual data compression. The transform does not perform any compression but modifies the string in a way to make it easy to compress with a secondary algorithm. Now let’s explain this transformation from the view of combinatorics: given an input
k-word u, BWT first forms the multiset CPL(u) and sorts its members lexicographically, and then extracts the last character of each word in the sorted multiset CPL(u). BWT(u), the output of BWT is a string L consisted of these extracted characters. This transformation also computes the index I that
stands for the position of the original word u in the sorted multiset CPL(u). With only BWT(u) and the index I there is an efficient algorithm to recover the original word.
For example, let u=ATGGTGCACCTGACT, then the corresponding circular permutation is shown in Fig. 1, while the multiset CPL(u) and the sorted CPL(u) are as
follows.
Fig 1. The circular permutation of ATGGTGCACCTGACT.
) (u L
CP :
⋮
GGTGC ACCTGACTAT
GTGCA CCTGACTATG
TGCAC CTGACTATGG
GCACC TGACTATGGT
CACCT GACTATGGTG
ACCTG ACTATGGTGC
CCTGA CTATGGTGCA
CTGAC TATGGTGCAC
TGACT ATGGTGCACC
the sorted CPL(u):
⋮
ATGGT GCACCTGACT
CACCT GACTATGGTG
TGCAC CTGACTATGG
CCTGA CTATGGTGCA
GTGCA CCTGACTATG
TGGTG CACCTGACTA
TGACT ATGGTGCACC
ACCTG ACTATGGTGC
GGTGC ACCTGACTAT
So, BWT(u)=CGTGAACTTTGCCGA, and I=3.
From the discussion above, one can obtain the following proposition.
3. The Matrix Representation of a DNA
Sequence
Usual representation of a DNA primary sequence is that of a string of letters A, G, C, and T, which signify the four nucleic acid bases adenine, guanine, cytosine, and thymine, respectively. In other words, a DNA sequence
n x x x x … 2 1
= is an n-word over the alphabet } T G, C, A, { =
Ω . In order to numerically characterize a DNA sequence, we assign the following fractions to the four bases:
A: 1/3, C: 1/5, G: 1/7, T: 1/11, and define a homomorphic mapping φ1 by φ1(x)=φ1(x1)φ1(x2)…φ1(xn) ,
where = = = = = T , 11 1 G , 7 1 C , 5 1 A , 3 1 ) ( 1 j j j j j x x x x x
φ , (j=1,2,⋯,n)
Then DNA sequence x can be transformed into a sequence of real numbers. Here, the 3, 5, 7, 11 are different prime number that could make the mapping is one-to-one. Take
TGACT ATGGTGCACC =
x and
BWT(x)=CGTGAACTTTGCCGA as examples, the corresponding sequences of real numbers are
11 1 5 1 3 1 7 1 11 1 5 1 5 1 3 1 5 1 7 1 11 1 7 1 7 1 11 1 3 1 ) ( 1 x =
φ and 3 1 7 1 5 1 5 1 7 1 11 1 11 1 11 1 5 1 3 1 3 1 7 1 11 1 7 1 5 1 )) ( BWT (
1 x =
φ , respectively. From the two sequences of real numbers, a “subtraction matrix” can be constructed by the formula:
) ( ) (x aij
M = , aij=φ1(xi)−φ1(BWT(xj)) (1)
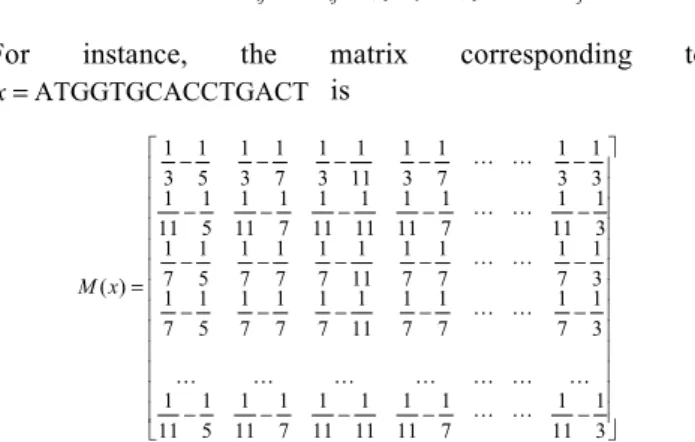
For instance, the matrix corresponding to
TGACT ATGGTGCACC =
x is
− − − − − − − − − − − − − − − − − − − − − − − − − = 3 1 11 1 7 1 11 1 11 1 11 1 7 1 11 1 5 1 11 1 3 1 7 1 7 1 7 1 11 1 7 1 7 1 7 1 5 1 7 1 3 1 7 1 7 1 7 1 11 1 7 1 7 1 7 1 5 1 7 1 3 1 11 1 7 1 11 1 11 1 11 1 7 1 11 1 5 1 11 1 3 1 3 1 7 1 3 1 11 1 3 1 7 1 3 1 5 1 3 1 ) ( ⋯ ⋯ ⋯ ⋯ ⋯ ⋯ ⋯ ⋯ ⋯ ⋯ ⋯ ⋯ ⋯ ⋯ ⋯ ⋯ ⋯ x M
Based on the knowledge of algebra, we have
Proposition 2. Suppose u~v, and their subtraction matrices are M(u) and M(v) , respectively. Then
) ( ~ ) ( 1 v M u
M , that is, the two matrices can be converted into one another by a series of the first type of elementary row operations.
From proposition 2, we immediately get the following conclusion.
Proposition 3. For ∀ x,y∈CL(u), M(x)2 = M(y)2, where M 2 is the spectral norm of matrix M.
Please note that there are 4!=24 ways to arrange the four fractions 1/3, 1/5, 1/7, and 1/11 to the four bases A, C, G and T. Therefore, in total, we can define 24 homomorphic mappings φ1,φ2, …, φ24. And then, a DNA sequence can
be characterized by a 24-D vector whose components are the corresponding 24 spectral norms.
4. Applications to Phylogenetic Analysis
In this section, we demonstrate the performance of the proposed approach in the field of the construction of phylogenetic trees. The underlying assumption is that two DNA sequences are similar if the corresponding 24-D vectors point to a similar direction and have similar magnitudes. The similarities among such two vectors
) , , ,
(v1 v2 v24
v= ⋯ and u=(u1,u2,⋯,u24) can be examined by the formula below:
(
)
∑
= − × − = 24 1 2 ) ( ) , cos( 1 ) , ( j j j u v u v u vD . (2)
For convenience, we call D(v,u) as the overall distance between v and u. Clearly, the smaller is the overall distance, the more similar are the two DNA sequences.
In order to test our method, in the following, we will construct the phylogenetic tree of full β-globin genes of 15 species (see Table 1). By (2) we calculate the overall distances between any two of the 15 sequences. Consequently, a 15×15 real symmetric matrix is obtained. On the basis of the distance matrix, the phylogenetic tree (see Fig. 2) is constructed using the UPGMA program included in MEGA4.0. The branch lengths are not scaled according to the distances and only the topology of the tree is concerned.
Table 1. The β-globin genes of 15 species.
NO. Species AC Location Length(nt)
1 Human U01317 62187-63610 1424
2 Chimpanzee X02345 4189-5532 1344
3 Gorilla X61109 4538-5881 1344
4 Lemur M15734 154-1595 1442
5 Rat X06701 310-1505 1196
6 Mouse V00722 275-1462 1188
7 Goat M15387 279-1749 1471
8 Sheep DQ352470 238-1708 1471
9 Mouflon DQ352468 238-1706 1469
10 Bovine X00376 278-1741 1464
11 Rabbit V00882 277-1419 1143
12 European hare Y00347 1485- 2620 1136
13 Opossum J03643 467-2488 2022
14 Gallus V00409 465-1810 1346
Fig 2. The relationship tree of the 15 species.
Observing Fig. 2, we find that the two kinds of non-mammals (Gallus, and Muscovy duck) are situated at an independent branch, while the 13 mammals appear to cluster together and form a separate branch. A closer look at the subtree of mammals shows that opossum can be distinguished easily from the remaining mammals, while the four kinds of Primates (Human, Chimpanzee, Gorilla and Lemur) tend to cluster together. Also, (European hare, rabbit) and (mouse, rat) tend to cluster together, respectively, while goat, mouflon, sheep and bovine form a separate branch. This result is similar to that reported in other literature [7, 14, 16, 17, 33-35].
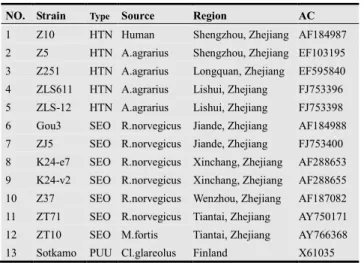
As another application, we choose the S segments of 13 hantaviruses to construct the phylogenetic tree. Hantaviruses (HV) are negative sense RNA viruses in the Bunyaviridae family. The name hantavirus is derived from the Hantan River area in South Korea. Humans may be infected with hantaviruses through rodent bites, urine, saliva or contact with rodent waste products. Some hantaviruses cause 2 zoonoses, hemorrhagic fever with renal syndrome (HFRS) and hantavirus pulmonary syndrome (HPS). The later occurred in North and South America, while the former mainly in Asia and Europe [36]. China is the country affected by HFRS most seriously and the number of the cases accounts for more than 90% of the total reported cases in the world [37]. Among the 13 hantaviruses analysed in this study, twelve are isolated in China, one from Finland, which is used as a reference. And the data files can be retrieved from GenBank (see Table 2).
Table 2. The 13 Hantavirus strains.
NO. Strain Type Source Region AC
1 Z10 HTN Human Shengzhou, Zhejiang AF184987
2 Z5 HTN A.agrarius Shengzhou, Zhejiang EF103195
3 Z251 HTN A.agrarius Longquan, Zhejiang EF595840
4 ZLS611 HTN A.agrarius Lishui, Zhejiang FJ753396
5 ZLS-12 HTN A.agrarius Lishui, Zhejiang FJ753398
6 Gou3 SEO R.norvegicus Jiande, Zhejiang AF184988
7 ZJ5 SEO R.norvegicus Jiande, Zhejiang FJ753400
8 K24-e7 SEO R.norvegicus Xinchang, Zhejiang AF288653
9 K24-v2 SEO R.norvegicus Xinchang, Zhejiang AF288655
10 Z37 SEO R.norvegicus Wenzhou, Zhejiang AF187082
11 ZT71 SEO R.norvegicus Tiantai, Zhejiang AY750171
12 ZT10 SEO M.fortis Tiantai, Zhejiang AY766368
13 Sotkamo PUU Cl.glareolus Finland X61035
In the same way, we obtain a 13×13 distance matrix, and then construct the phylogenetic tree of the 13 hantaviruses (see Fig. 3). From Fig. 3, we find that Sotkamo can be distinguished easily from other two groups of hantaviruses. The 5 Hantaan (HTN) viruses, Z10, Z5, Z251, ZLS611, ZLS-12, form a separate branch, while the 7 Seoul (SEO) viruses, ZT71, ZT10, Z37, Gou3, ZJ5, K24-e7, K24-v2, form another branch. A closer look at the subtree of 12 HV strains from Zhejiang Province shows that the phylogeny was closely related to the isolated regions, but had no distinct relationship with the host. In other words, HV distributions showed geographical clustering within individual HV types. This result is in accordance with that reported by Ref. Yao et al.[37].
Fig 3. The relationship tree of the 13 HV strains.
Acknowledgements
This work was partially supported by the National Natural Science Foundation of China (No. 11171042), the Program for Liaoning Excellent Talents in University (No. LJQ2011122), the Liaoning BaiQianWan Talents Program (No. 2012921060), and the Open Project Program of Food Safety Key Lab of Liaoning Province (No. LNSAKF2011034).
References
[1] Yang LP, Chang G, Zhang X, Wang TM, Use of the Burrows-Wheeler similarity distribution to the comparison of the proteins, Amino acids, 39: 887-898, 2010.
[2] Hamori E, Ruskin J, H curves, a novel method of representation of nucleotide series especially suited for long DNA sequences, The Journal of biological chemistry, 258: 1318-1327, 1983.
[3] Nandy A, A new graphical representation and analysis of DNA sequence structure. I: Methodology and application to globin genes, Current science, 66: 309-314, 1994.
[4] Nandy A, Empirical Relationship between Intra-Purine and Intra-Pyrimidine Differences in Conserved Gene Sequences. PLoS ONE, 4(8): e6829, 2009.
[6] Randić M, Vracko M, Lers N, Plavsic D, Novel 2-D graphical representation of DNA sequences and their numerical characterization, Chemical Physics Letters, 368: 1-6, 2003.
[7] Randić M, Vracko M, Lers N, Plavsic D, Analysis of similarity/dissimilarity of DNA sequences based on novel 2-D graphical representation, Chemical Physics Letters, 371: 202-207, 2003.
[8] Randic M, Pisanski T, Novic M, Plavsic D, Novel graph distance matrix, J Comput. Chem., 31: 1832-1841, 2010.
[9] Randic M, Zupan J, Balaban AT, Vikic-Topic D, Plavsic D., Graphical representation of proteins. Chem Rev., 111(2): 790-862, 2011.
[10] Randic M, Novic M, Plavsic D, Milestones in graphical bioinformatics, Int. J. Quantum Chem., 113: 2413-2446 , 2013.
[11] Qi ZH, Li L, Qi XQ, Using Huffman coding method to visualize and analyze DNA sequences, J. Comput. Chem., 32: 3233-3240, 2011.
[12] Zhang YS, Liao B, Ding K, On 3DD-curves of DNA sequences, Molecular Simulation, 32(1): 29-34, 2006.
[13] Li C, Tang NN, Wang J, Directed graphs of DNA sequences and their numerical characterization. J. Theor. Biol. 241: 173-177, 2006.
[14] Yao YH, Dai Q, Nan X, He P, Nie ZM, Zhou SP, Zhang YZ, Analysis of similarity/dissimilarity of DNA sequences based on a class of 2D graphical representation, Journal of computational chemistry, 29: 1632-1639 , 2008.
[15] He P, Li D, Zhang Y, Wang X, Yao Y., A 3D graphical representation of protein sequences based on the Gray code. J Theor Biol., 304: 81-87, 2012.
[16] Randić M, Vracko M, Nandy A, Basak SC, On 3-D graphical representation of DNA primary sequences and their numerical characterization, Journal of chemical information and computer sciences, 40: 1235-1244, 2000.
[17] Li C, Ma H, Zhou Y, Wang X, Zheng X, Similarity analysis of DNA sequences based on the weighted pseudo-entropy, J. Comput. Chem., 32(4): 675-680, 2011.
[18] Kantorovitz MR, Robinson GE, Sinha S, A statistical method for alignment-free comparison of regulatory sequences, Bioinformatics, 23: i249-255, 2007.
[19] Van Helden J, Metrics for comparing regulatory sequences on the basis of pattern counts, Bioinformatics, 20: 399-406, 2004.
[20] Dai Q, Yang Y, Wang T, Markov model plus k-word distributions: a synergy that produces novel statistical measures for sequence comparison, Bioinformatics, 24(20): 2296-2302, 2008.
[21] Gao L, Qi J, Sun JD, Hao BL, Prokaryote phylogeny meets taxonomy: an exhaustive comparison of composition vector trees with systematic bacteriology, Science in China. Series C, Life sciences, 50(5): 587-599, 2007.
[22] Koohy H, Dyer NP, Reid JE, Koentges G, Ott S, An alignment-free model for comparison of regulatory sequences, Bioinformatics , 26(19): 2391-2397, 2010.
[23] Otu HH, Sayood K, A new sequence distance measure for phylogenetic tree construction, Bioinformatics, 19: 2122-2130, 2003.
[24] Mantaci S, Restivo A, Sciortino M., Burrows-Wheeler transform and Sturmian words, Information Processing Letters, 86: 241-246, 2003.
[25] Mantaci S, Restivo A, Rosone G, Sciortino M., An extension of the Burrows-Wheeler transform, Theoretical Computer Science, 387: 298-312, 2007.
[26] Mantaci S, Restivo A, Sciortino M., Distance measures for biological sequences: Some recent approaches, International Journal of Approximate Reasoning, 47: 109-124, 2008.
[27] Zheng X, Li C, Wang J., A complexity-based measure and its application to phylogenetic analysis, Journal of mathematical chemistry, 46: 1149-1157, 2009.
[28] Zheng X, Li C, Wang J., An information-theoretic approach to the prediction of protein structural class, Journal of computational chemistry, 31(6): 1201-1206, 2010.
[29] Burrows M, Wheeler DJ, A block-sorting lossless data compression algorithm. SRC Research Report 124, 1994.
[30] Mantaci S, Restivo A, Rosone G, Sciortino M, A new combinatorial approach to sequence comparison, Theory of Computing Systems, 42: 411-429, 2008.
[31] Restivo A, Rosone G, Balanced Words Having Simple Burrows-Wheeler Transform. Lecture Notes in Computer Science, 5583: 431-442, 2009.
[32] Konstantin ML, Arseny MS, Two Combinatorial Criteria for BWT Images, Computer Science-Theory and Applications, Lecture Notes in Computer Science, 6651: 385-396, 2011.
[33] Randić M, Guo XF, Basak SC, On the characterization of DNA primary sequences by triplet of nucleic acid bases, Journal of chemical information and computer sciences, 41: 619-626, 2001.
[34] He PA, Wang J, Characteristic sequences for DNA primary sequence, Journal of chemical information and computer sciences, 42: 1080-1085, 2002.
[35] Yang Y, Zhang YY, Jia MD, Li C, Meng LY, Non-degenerate graphical representation of DNA sequences and its applications to phylogenetic analysis, Comb. Chem. High Throughput Screen., 16: 585-589 , 2013.
[36] Zhang YZ, Dong X, Li X, Ma C, Xiong HP, Yan GJ, Gao N, Jiang D, Li LP, Zou Y, Plyusnin A, Seoul virus and hantavirus disease, Shenyang, People's Republic of China, Emerging infectious diseases, 15(2): 200-206, 2009.