Using position data to estimate effects of contextual
features on passing decisions in football
Silvan Steiner
1, *, Stephan Rauh
1, Martin Rumo
2, Karin Sonderegger
2& Roland Seiler
1 1 Institute of Sport Science, University of Bern, Bern, Switzerland2 Swiss Federal Institute of Sport, Magglingen (SFISM), Switzerland
* Corresponding author: Institute of Sport Science, University of Bern, Bremgartenstrasse 145, CH-3012 Bern, Switzerland Tel: +41 (0) 31-631 51 12
Email: [email protected]
COMMENTARY
Article History:
Submitted 22th January 2018 Accepted 14th June 2018 Published 03rd July 2018
Handling Editor:
Martin Kopp
University of Innsbruck, Austria
Editor-in-Chief:
Martin Kopp
University of Innsbruck, Austria
Reviewers:
Reviewer 1: Björn Krenn University of Vienna, Austria Reviewer 2: Itay Basevitch Anglia Ruskin University, United Kingdom
ABSTR AC T
Passes are a performance-relevant parameter in many team sports. They must be played in the highly dynamic and unpredictable contexts of interactive team competitions. The difficulty to plan passes in advance requires real-time decisions and highlights the importance of the information provided by current game contexts. This study estimates the relation between contextual informa-tion and passing decisions by analyzing posiinforma-tion data of 1379 passing situainforma-tions tracked during football competitions. In support of previous findings of a scenario-based investigation, open pass-ing lanes, spatial proximity to the ball carrier, team members’ positions in front of the ball carrier, and loose defense by opposing players all significantly increased team members’ odds for receiving passes. In the total sample, the four kinds of contextual information enabled the correct prediction of 41% of the passes played. The prediction rate compares to a base rate of 11% and is substantially higher than that reported for passing decisions made in static game scenarios. Separate analyses of passes categorized according to teams, playing positions, and playfield zones revealed that spatial proximity and open passing lanes were significantly related to passing decisions in all pass cat-egories, while effects of positions in front of the ball carrier and loose defense were found less constantly. Shedding light on the relationship between position-related information and passing decisions, the results indicate what contextual information may help in anticipating passing deci-sions and ways in which team members may affect these decideci-sions by actively taking correspond-ing positions.
Keywords:
sports data – decision making – contextual information – environment – pass – soccer
Citation:
Steiner, S., Rauh, S., Rumo, M., Sonderegger, K. & Seiler, R. (2018). Using position data to estimate effects of contextual features on passing decisions in footbal. Current Issues in Sport Science, 3:009. doi: 10.15203/CISS_2018.009
Introduction
Passes represent a performance-relevant element in many team sports (e.g., Evangelos, Aristotelis, Ioannis, Stergios, & Foteini, 2014; Reed, 2004). They must be played in the highly dynamic contexts characteristic of interactive and open skill-dominated sports (Nuri, Shadmehr, Ghotbi, & Moghadam, 2013). In these contexts, passing opportunities continuously change as the positions of team members, opponents, and the ball are
to choose those most beneficial for team performance. To cul-tivate a better understanding of how contextual information contributes to athletes’ decisions in real life-scenarios (Cañal-Bruland, & Mann, 2015), decisions could be analyzed by means of the behavior that emerges during real-time competition (Araújo, Davids, & Hristovski, 2006). If the decisions of football players are expressed by their actions (Turvey, & Shaw, 1995), then analyzing such actions in their environmental context is a grounded way to understand decision making (Araújo et al., 2006). Following the tradition of ecological psychology, the goal here is to understand how the environment contributes to the interactions that occur between an actor and his or her respective environment (Greeno, 1994). If recurring patterns between specific features of situational game environments and passes are found, then this would be indicative of the af-fording characteristics (Gibson, 1979) these features have for playing passes.
Assumedly, the game context’s relevance to passing decisions is derived from its functional relation to the game’s primary goal of scoring higher than opponents and its relation to the sub-ordinate goals (subgoals) preceding the primary goal’s at-tainment (Steiner, Macquet, & Seiler, 2017). For example, the situational game context provides the ball carrier information about team members’ proximity to the opponent goal relative to his own. On a very general level, this information indicates the goal-approximative consequences to be expected when a pass to corresponding team members is completed (Steiner et al., 2017; see also Oesterreich, 1981). Subgoals may refer to maintaining ball possession and taking the ball to shooting po-sitions near the opponent goal. Various studies provide clues to the contextual features that likely relate to these subgoals. For example, it has been found that the distances of defenders to shooting or passing paths relate to the frequency of ball inter-ceptions (e.g., Travassos, Araújo, Davids, Esteves, & Fernandes, 2012; Vilar, Araújo, Davids, Vanda, & Esteves, 2013). Other re-ports indicate that tightly defending opponents jeopardize completion of a pass to corresponding team members (Hjelm, 2011; Johnson, 2006; Macquet, & Kragba, 2015; Vilar et al., 2014). Further, reports of long passes being made less frequently and generally having a higher risk of being off-target than passes to nearby team members indicate the relevance of information about team members’ distances to the ball carrier (e.g., Bush, Barnes, Archer, Hogg, & Bradley, 2015; Hjelm, 2011; Rampinini, Impellizzeri, Castagna, Coutts, & Wisløff, 2009). To date, studies analyzing the effects of these various contextual features on real-world passing decisions simultaneously are yet missing. Recently, methods for examining relations between the men-tioned contextual features and passing decisions have been presented (Steiner, 2018). To illustrate the methods, a sample dataset of passing decisions made in static game scenarios was used. Open passing lanes, team members’ positions in front of the ball carrier, team members’ spatial proximity to the ball carrier, and loose defense by opposing players were found to be associated with increased odds for receiving passes. By tak-ing into consideration these four features, 22% of the passtak-ing
decisions could be correctly predicted, compared to a base rate of 11%.1 Team members’ spatial proximity to the ball
car-rier showed the strongest effects on the ball carcar-riers’ passing decisions. While the results indicate support for previous con-siderations of the relevance of these features to passing deci-sions, the unknown ecological validity of the scenario-based and time-unconstrained passing decisions currently prevents generalizability to real-world passing behavior. It is known that hypothetical behavioral responses are sometimes highly inac-curate (e.g., Baumeister, Vohs, & Funder, 2007). Further, it has been argued that contextual information is likely to become more important when the sport-task-related time constraints increase (Cañal-Bruland, & Mann, 2015). Obviously, the relation between contextual information and behavior decisions will remain unknown unless actual behavior is also measured (Bau-meister et al., 2007).
The aim of this study was thus to replicate Steiner’s (2018) analysis using data of passes played during real football com-petitions. We expected that the same four kinds of contextual information would be similarly related to passes played dur-ing football competitions. We hypothesized that open passdur-ing lanes (Hypothesis 1), positions in front of the ball carrier (Hy-pothesis 2), spatial proximity to the ball carrier (Hy(Hy-pothesis 3), and loose defense by opposing players (Hypothesis 4) are all contextual information that increase team members’ odds of being passed the ball.
Methods
Data collection and data preparation
Position data collected during the first half-times of five championship matches between some of Switzerland’s best U-18 football teams served as the data for this study. The Swiss Federal Institute of Sport Magglingen (SFISM) which had collected the data to analyze physiologic parameters during championship games provided the data.2 The data set includes
data from seven different teams with a total of 89 athletes. In three of the analyzed matches, one team was leading by one goal at the mid-break (1:0). One match was tied at zero and one match was tied at one. The study was approved by the independent Institutional Review Board of the SFISM.
Position data were collected by a local position measurement system (LPMS). An LPMS uses 10 base stations located around
1 The study only considered passes from field players to field play-ers. Randomly selecting one out of the nine passing options avail-able to the ball carrier would result in a probability of 1/9 = 0.11 of correct pass predictions.
leave situation-specific configurations of passing opportunities unconsidered. For each passing situation, the minima, maxima, and ranges of the mentioned predictor variables were defined. We subtracted the value of the team member with the lowest value in a variable and situation from the other team members’ values in the same variable and situation. The resulting values were then divided by the variable’s range in that game situation, resulting in numbers between zero and one. To adjust for model sensitivity (e.g., Pina, Paulo, & Araújo, 2017), the values were multiplied by a factor of nine to obtain values between zero and nine. These variables were z-standardized and screened for outliers. No standardized values larger than 3.29 indicated the absence of outliers (Tabachnick, & Fidell, 2014).
The data were arranged in a long data file (Heck, Thomas, & Tabata, 2014). Every passing situation was described by 11 cases, each representing one of the 11 players of the team in ball possession. A variable identified the ball carrier (-1), the pass receiver (1), and the non-receivers (0).
Statistical analyses
Binary logistic regressions were calculated to test the relations between the predictor variables (openness of passing lane, position relative to the ball carrier, spatial proximity, and defensive coverage) and the dependent variable (passing decision). The model is illustrated in Figure 1. The model was run for the total of 1379 passing situations and separately for 13 subsamples consisting of a) the passes played by each of the seven teams, b) the passes played by athletes of different playing positions (defenders, midfielders, forwards), and c) the passes played from different zones of the playfield (defensive third, middle third, attacking third). These separate analyses were conducted to account for the possibility of passing options being prioritized differently depending on, among other things, a team’s playing strategy, team members’ playing positions, or the zones from which passes are played. The size the playing field. The base stations communicate with
tran-sponders attached to the players and estimate their distances. From these data, player positions are calculated via triangula-tion (InmotioTec GmbH, Regau, Austria). LPMSs work at a rate of 1000 Hz (divided by the number of players, n = 22) and reli-ably track athletes’ positions (Frencken, Lemmink, & Delleman, 2010; see also Ogris et al., 2012; Siegle, Stevens, & Lames, 2013; Stevens et al., 2014). In addition to player positions, the system tracks the ball via 12 cameras placed around the playing field. In situations in which obstacles prevent clear sight on the ball (e.g., when the goalkeeper covers the ball with his body), the system may generate data artefacts (Memmert, & Raabe, 2017). We eliminated these artefacts by correcting the ball data with SFISM’s balltrackgenerator. This software application enables the manual correction of ball trajectories by dragging the ball to the appropriate spot. Time-synchronized match videos were considered to define these spots. We then used InmotioTec’s built-in pass detection algorithm to generate a pass list. Ran-dom samples indicated that the detection algorithm did not reliably detect passes in all cases and resulted in a faulty pass list. The entire pass list was re-checked and corrected by ref-erencing it to the match videos. A total of 1,778 completed passes were identified. Passes that resulted directly from free kicks, corners, goal-kicks, and throw-ins were all uniquely cod-ed. Furthermore, we coded passes that were completed (e.g., touched once by a team member) but could not be brought under control (Aquino, Puggina, Alves, & Garganta, 2017; Jones, James, & Mellalieu, 2004). Coded passes were excluded from the analyses, resulting in a final number of 1,379 passes. For every passing situation, the position data of all 22 players on the field were exported to a data file. To operationalize the openness of a passing lane, we defined the straight between the ball carrier and a team member (e.g., the direct passing lane) as well as the straights between the ball carrier and each opponent player located in the area to the left or right of the passing lane. We then defined the cones defined by the passing lane and each of the defined straights to opponent players. The angle of the cone with the smallest angle defined the openness of the passing lane to this team member. Team members located in front of the ball carrier (e.g., closer to the opponent’s goal than the ball carrier) were coded “1”, while those behind him were coded “0”. Euclidean distances were calculated for the team members’ spatial proximity to the ball carrier. Finally, each team member’s defensive coverage was calculated by the closest distance of any opposing player to that team member. The variables were computed with Matlab (Mathworks). To retain information about the situation-specific distributions of the predictor variables, we standardized the openness of passing lanes, team members’ spatial proximity to the ball carrier, and their defensive coverage within each situation. This situation-specific standardization is necessary because a team member located four meters away from his nearest opponent can be the best defended team member in one situation but the most loosely defended in another situation. Thus,
performing the regression models with absolute values would Figure 1: Visual illustration of the regression model
0.63, 1.94, 3.77, and 6.72). For all regression models specified, the link logit function was used.
Cox and Snell’s (CS) and Nagelkerke’s (NK) Pseudo R2 are
reported as measures for model performance. For the model run for the total sample, the mean reciprocal rank measure (MRR) and the percentages of top-one, top-two, and top-three pass predictions are also shown (Vercruyssen, De Raedt, & Davis, 2016). These measures relate the observed passes to the regression model’s rank-ordered pass predictions separately for each pass situation. We calculated the percentage of the lowest-three predictions to indicate the number of passes that were poorly predicted by the model.
Results
The regression models calculated for the datasets with and without goalkeepers yielded highly comparable results, with differences in odds ratios and significance levels only to the second decimal place. Furthermore, accounting for the cluster-ing of the data did not affect any of the effects’ level of signifi-cance more than to the third decimal place. Therefore, we only present the results of the standard binary logistic regression models run for the data with goalkeepers excluded.
Regarding the total sample of N = 1379 passes, the model in-cluding the four predictor variables fit the data significantly better than the null model including the intercept only (χ2 =
1663.21, df = 7, p < .001). The insignificant Hosmer-Lemeshow test also indicated the model’s fit to the data (χ2 = 10.85, df =
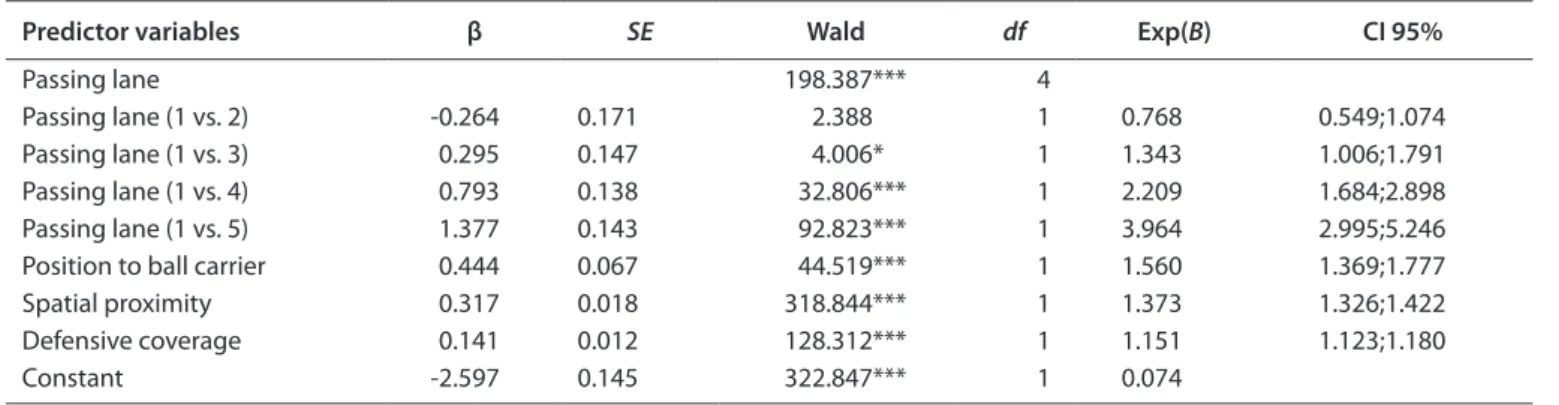
8, p = .21). The model yielded highly significant effects of all predictor variables on passing decisions (Table 1). Looking at the variable passing lane, the contrasts between categories 3–5 and the best-defended category, category 1, show that the odds for receiving passes are higher for team members with more open passing lanes than those in category 1. There was no significant difference between the odds for team mem-bers in category 1 (best-defended passing lanes) and 2 (sec-ond-best-defended passing lanes). Overall, we interpret these of the 13 subsamples ranged from nmin = 101 (passes played
by one of the teams) to nmax = 838 (passes played from the
middle third). In addition to specifying standard binary logistic regression models, we also specified our models using the Mplus (Muthen, & Muthen, Version 7.4) procedure for complex data. The procedure takes into account the clustering of data (e.g., the belongingness of 11 cases to the same game situation) when calculating levels of significance. A situation identification code was used as a cluster variable.
Due to the goal keepers’ usually distant position behind the ball carrier and limited involvement in their teams’ passing game, we expected that the inclusion of goalkeeper data in the analyses would favor the detection of significant effects for two predictor variables, spatial proximity, and position relative to the ball carrier, on passes played. To account for this potential effect, the regression models were run repeatedly for datasets with and without goalkeepers.
We used the Box-Tidwell approach (Hosmer, & Lemeshow, 2000) to test the linearity between the three continuous pre-dictor variables, openness of passing lane, spatial proximity, and defensive coverage, and the logit transform of the pass-ing decisions. The test was performed separately for the total sample and each of the 13 subsamples. Regarding the total sample, a significant interaction between the variable passing lane and its natural logarithm on passing decisions (Wald = 17.18, p < .001) indicated no linearity in the logit for this vari-able. A predictor with no linearity in the logit must not be in-cluded as continuous predictor variable in logistic regression models (Tabachnick, & Fidell, 2014). The predictor was area transformed to obtain five categories with an equal number of cases (Lienert, & Ratz, 1998) and treated as a categorical vari-able. The cut-offs were 0.29, 1.10, 2.52, and 5.67.
Testing the assumption of linearity in the logit in each of the 13 subsamples revealed that the assumption was partly violated for openness of passing lane and defensive coverage (7 and 2 violations at p < 0.05, respectively). For the analyses of the 13 subsamples, the defensive coverage variable, too, was quintile transformed and treated as a categorical variable (cutoffs were
Predictor variables β SE Wald df Exp(B) CI 95%
Passing lane 198.387*** 4
Passing lane (1 vs. 2) -0.264 0.171 2.388 1 0.768 0.549;1.074
Passing lane (1 vs. 3) 0.295 0.147 4.006* 1 1.343 1.006;1.791
Passing lane (1 vs. 4) 0.793 0.138 32.806*** 1 2.209 1.684;2.898
Passing lane (1 vs. 5) 1.377 0.143 92.823*** 1 3.964 2.995;5.246
Position to ball carrier 0.444 0.067 44.519*** 1 1.560 1.369;1.777
Spatial proximity 0.317 0.018 318.844*** 1 1.373 1.326;1.422
Defensive coverage 0.141 0.012 128.312*** 1 1.151 1.123;1.180
Constant -2.597 0.145 322.847*** 1 0.074
Exp(B) = odds ratio; CI 95% = lower and upper 95% confidence intervals for the odds ratio. * = p < .05
*** = p < .001
findings as being in support of the first hypothesis that team members with open passing lanes have higher odds of receiv-ing passes than team members with well-defended passreceiv-ing lanes.
Team members located closer to the opposing team’s goal than the ball carrier had 1.56 times higher odds of receiving passes than those located further away from the goal. The second hypothesis, which assumed that team members’ positions in front of the ball carrier would be associated with higher odds for receiving passes, can be maintained.
The significant effect of spatial proximity shows that passes were more often given to team members nearby than to those positioned further away from the ball carrier. The closer team members were, the higher their odds for receiving passes became. A decrease of team members’ distance to the ball carrier by one unit increased their odds of receiving passes by a factor of 1.37. These results support the third hypothesis, which assumed higher odds for team members in relative spatial proximity to the ball carrier.
The significant effect of defensive coverage indicates the relevance of this situational feature to passes played. An increase of the closest defender’s distance to a team member by one unit increased that team member’s odds for receiving passes by a factor of 1.15. The results support the fourth hypothesis, which assumed that loosely defended team members would receive passes more often than well-defended team members. Based on the odds ratios and taking into account the num-ber of units/categories of each variable, differences in spatial proximity are the situational feature with the strongest effects on passing decisions (OR (17.34) = exp(1.373*(9-0)); Cohen,
Cohen, West, & Aiken, 2003). Information about the openness of passing lanes to team members and team members’ defen-sive coverage were the second- (OR (3.96) = contrast 1 vs. 5) and third-most important (OR (3.55) = exp(1.151*(9-0)). The smallest effect was reported for the team members’ positions relative to that of the ball carrier and the opponent’s goal (OR = 1.56).
Pseudo R2 values were CS = 0.125 and NK = 0.250. Taking into
consideration the information from the four situational fea-tures enabled the correct prediction of 41% of the actual pass-es played. Rank scaling each situation’s passing options (team members) according to the regression model’s predicted val-ues revealed that the observed pass was among the regression model’s top-two ranked passing options in 63% of the cases. In 77% of the cases, it was among the top-three ranked passing options. Six percent of the observed passes were not predicted well as they were among the model’s three lowest-ranked pass-ing options (Table 2).
Table 2: Mean reciprocal rank (MRR) and percentages of recall in the top-1, top-2, top-3, and lowest-3 as indicators for the regression model’s performance in predicting real vs. scenario-based passing decisions. The lower row shows Steiner’s (2018) results as a reference.
Condition MRR top-1 top-2 top-3 lowest-3
Real games 0.61 41% 63% 77% 6%
Game scenarios 0.45 22% 40% 57% 7%
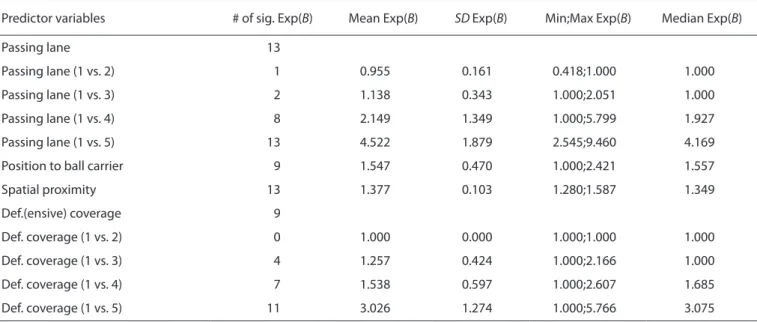
Subsamples refer to passes played by (7) different teams, from different zones (defensive third, middle third, attacking third), and by players with different playing positions (defenders, midfielders, forwards). # of sig. Exp(B) = number of subsamples, in which the odds ratio was significantly different from zero (p < 0.05); SD Exp(B) = standard deviation of the odds ratios across the 13 subsamples. Because insignificant estimates of Exp(B) do not differ from 1 in a meaningful way, they were included as values of 1 into calculations of Mean, SD, Min, Max, and Median Exp(B).
Table 3: Summary of the effect estimates derived from the 13 subsamples.
Predictor variables # of sig. Exp(B) Mean Exp(B) SD Exp(B) Min;Max Exp(B) Median Exp(B)
Passing lane 13
Passing lane (1 vs. 2) 1 0.955 0.161 0.418;1.000 1.000
Passing lane (1 vs. 3) 2 1.138 0.343 1.000;2.051 1.000
Passing lane (1 vs. 4) 8 2.149 1.349 1.000;5.799 1.927
Passing lane (1 vs. 5) 13 4.522 1.879 2.545;9.460 4.169
Position to ball carrier 9 1.547 0.470 1.000;2.421 1.557
Spatial proximity 13 1.377 0.103 1.280;1.587 1.349
Def.(ensive) coverage 9
Def. coverage (1 vs. 2) 0 1.000 0.000 1.000;1.000 1.000
Def. coverage (1 vs. 3) 4 1.257 0.424 1.000;2.166 1.000
Def. coverage (1 vs. 4) 7 1.538 0.597 1.000;2.607 1.685
compared to a statistical base rate of 11% correct predictions. The results corroborate previous findings about the significant effects of the same kinds of situational features on passing decisions made in static game scenarios (Steiner, 2018). Repeated analyses of subsamples consisting of passes catego-rized according to teams, playing positions, and playfield zones yielded consistently significant effects of spatial proximity and open passing lanes on passing decisions. Thus, besides show-ing the strongest effects in the total sample, positions in the vicinity of the ball carrier and open passing lanes also showed the most stable effects across the considered pass subsamples. The effects of positions in front of the ball carrier and defen-sive coverage on passing decisions were found less uniformly. Passes played by forwards and passes played in the attacking third showed no effect of defensive coverage. The interpreta-tion here is that these passes must be played despite increased constraints resulting from the usually tighter defense in areas near the goal, and that the potential benefit of a completed pass in the attacking third may justify taking the risk. The find-ing that forwards showed no tendency to play forward passes can be explained by the fact that they are often the foremost players with usually few options to pass the ball forward. A sim-ilar interpretation holds for passes played in the attacking third. Three teams did not show significant tendencies to pass the ball forward. The passes played by two other teams showed no effect of defensive coverage. These findings could be due to situational constraints (e.g., tight defense by the opposing team) and hence the necessity to play back-passes or passes to better defended team members. They could also be due to the different playing strategies the teams adhered to. For example, the number of passes played to team members positioned in front of the ball carrier will likely be different for teams with a very offensive game as compared to teams that follow more defense-oriented game plans. Finally, the results from the re-gression models ran for the 13 subsamples should be consid-ered in the light of the following two methodological aspects: 1) the decreased statistical power which is due to the smaller sample sizes and 2) the enhanced type 1 error rate which is due to the repeated calculation of the regression model for differ-ent subsamples. Consequdiffer-ently, we suggest focusing on the predictor’s overall effects reported for the subsamples rather than comparing the estimates for single contrasts across differ-ent subsamples. We argue that an interpretation of the overall effects found for the subsamples is justifiable even in the light of the enhanced type 1 error rate because all significant overall effects found for subsamples were also significant overall ef-fects in the total sample.
This study has some shortcomings that deserve attention. The first one relates to the relatively small dataset consisting of passes of five half-times played between semi-professional teams. While we would expect to find similar results in larger datasets and that the four types of contextual information relate similarly to passes played by professional teams, this remains to be tested. Second, we were unable to consider information about the height of passes played because the Running the regression model for the 13 subsamples showed
that the model fit the data significantly in each subsample (all p < .001). Pseudo R2 measures ranged from a Cox and Snell R2 of CS = 0.093 (Team 7) to CS = 0.179 (Team 5) and from a
Nagelkerke’s R2 ofNK = 0.185 (Team 7) to NK = 0.356 (Team 5).
The results of the regression models ran for the 13 subsamples are summarized in Table 3. The models yield consistently significant effects of open passing lanes and spatial proximity to the ball carrier in all 13 subsamples. Identical to what we found in the total sample, the pattern in all subsamples was that the odds of receiving passes were higher the closer the team members were positioned to the ball carrier. The overall pattern found for the openness of passing lane variable, too, mirrored the findings for the total sample: In all subsamples, the odds for passes increased the more open the passing lanes became. The only exception to this pattern was found for passes played in the attacking third. Here, the odds for receiving a pass were higher for team members with best defended passing lanes (category 1) than for those with second best defended passing lanes (category 2). However, for this category of passes, too, the overall highest odds for receiving passes were found for team members with the most open passing lanes. Both hypotheses 1 and 3 can be maintained.
In four out of the 13 subsamples, we found no significant effect of positions in front of the ball carrier as found in the total sample. These four subsamples consisted of the passes played by three teams (teams 4, 6, and 7 at p = 0.140, p = 0.101, and p = 0.054, respectively), and the passes played by forwards (p = 0.672). In four out of the 13 subsamples, there was no significant effect of defensive coverage. The passes played by two teams (teams 1, and 5 at p = 0.110, and p = 0.140, respectively), those played by the forwards (p = 0.097), and those played from within the attacking third (p = 0.100) did not significantly relate to how loosely team members were defended. Overall, these findings are only partially in support of hypotheses 2 and 4. They will be discussed in the next section.
Discussion
cisions (Baumeister et al., 2007). Complementing the variables used in this study with variables describing the athletes’ subjec-tive appraisals of the ecological environment would thus be a third option. Pass-specific efficacy beliefs (e.g., the subjective confidence in being able to play a specific pass; Bandura, 2006) or expectations of the outcomes of specific passes (e.g., Oes-terreich, 1981) are candidate variables. From a social-cognitive perspective, considering knowledge athletes use in construct-ing their subjective version of the situational game context would be a fourth option. In the context of passing decisions, taskwork knowledge, team strategies, or associative knowledge about their team are examples of internally stored information athletes may rely on for decision-making purposes (e.g., Eccles & Tenenbaum, 2007; Steiner, 2018; Steiner et al., 2017). With regard to applied practice, it is worth highlighting that the contextual features considered in this study are not un-controllable aspects of game situations. On the contrary, they can be shaped by the behavior of the team members involved. Understanding the kinds of information that guide athletes to respond to situational opportunities for passes could eventu-ally help athletes anticipate passes better and lead to new ways of influencing passing decisions by re-shaping the situational context for team members correspondingly.
To conclude, this study quantifies the relations between four situation-specific contextual features and passing decisions by using position data collected during team competitions. It provides estimates about the pass-affording characteristics of these contextual features and discusses variables that could be used in future pass prediction models.
Acknowledgements
We thank Nicolas Emery for his help in programming Matlab.
Funding
This work was supported by the Swiss Federal Office of Sport (BASPO) [grant number 16-06].
Competing Interests
The authors have declared that no competing interests exist.
Data Availability Statement
All relevant data are within the paper. data were 2D. With regard to the variables used, the inability to
detect passes played above defending players can potentially cause a downward bias in the effect estimates of the openness of passing lane variable. Third, it is impossible to objectively define the moment a pass decision is made. In this study, we considered contextual information as present at the time of a pass being played. Decision-making processes may involve an accumulation of information over time (Busemeyer, & Townsend, 1993). By focusing on the moment a pass is being played, information present prior to that moment is excluded from the analyses. Fourth, our models used the total number of team members to estimate the effects of the contextual information on passes played. While the contextual information considered in this study is (in theory) constantly available to athletes, it is known that athletes occasionally self-regulate based on more locally available information, without taking the whole team into consideration (e.g., Bourbousson, & Fortes- Bourbousson, 2016; Feigean, R’Kiouak, Seiler, & Bourbousson, submitted). Future studies could account for this by restricting the analyses to only the contextual information within visual range of the athletes. The use of portable eye-tracking systems could eventually help in defining such a range and reducing the amount of information included in a model to that perceived by athletes. It would be interesting to observe whether and how this affects the discriminative value of the contextual information considered here on passes played.
While this study provides estimates about the pass-affording character of four kinds of situation-specific contextual features, it also illustrates the need for further research. Our above inter-pretations of the different relations between the contextual fea-tures and passing decisions across pass subsamples are specu-lative and need further testing. Along those lines, the predic-tive performance of our model leaves room for improvement. In 59% of the cases, the four features did not sufficiently narrow the passing options to the one pass that was finally played. The implication here for future research is that additional sources of information that may affect passing decisions should be determined. The ecologic-oriented approach of this study is restricted to testing relationships between objectively defined contextual features and passing decisions. Sticking with such an approach, the inclusion of additional variables from the vast amount of contextual information available during games is one option (see Chawla, Estephan, Gudmundsson, & Horton, 2017 for additional examples of pass-related variables). Defin-ing the contextual information actually perceived by athletes is another option: Contextual features usually affording a pass may not result in a pass simply because the ball carrier does not perceive the given opportunity.
de-Gibson, J. J. (1979). The ecological approach to visual perception. Hillsdale, NJ: Lawrence Erlbaum Associates.
Greeno, J. G. (1994). Gibson’s affordances. Psychological Review, 101, 336–342.
Heck, R. H., Thomas, S. L., & Tabata, L. N. (2014). Multilevel and longitudinal modeling with IBM SPSS (2nd ed.). New York, NY: Routledge.
Hjelm, J. (2011). The bad female football player: Women’s football in Sweden. Soccer & Society, 12, 143-158. doi: 10.1080/14660970.2011.548352
Hosmer, D. W., & Lemeshow, S. (2000). Applied logistic regression (2nd ed.). New York: Wiley.
Johnson, J. G. (2006). Cognitive modeling of decision making in sports. Psychology of Sport and Exercise, 7, 631–652.
Jones, P. D., James, N., & Mellalieu, S. D. (2004). Possession as a performance indicator in soccer. International Journal of Performance Analysis in Sport, 4, 98–102.
Lienert, G. A., & Raatz, U. (1998) Testaufbau und Testanalyse [Testconstruction and testanalysis] (6th ed.). Weinheim: Beltz.
Macquet, A.-C., & Kragba, K. (2015).What makes basketball players continue with the planned play or change it? A case study of the relationships between sense-making and de-cision-making. Cognition, Technology & Work, 17, 345-353. doi: 10.1007/s10111-015-0332-4
Memmert, D., & Raabe, D. (2017). Revolution im Profifußball. Mit Big Data zur Spielanalyse 4.0. [Revolution in professional soc-cer. Using big data for game analysis 4.0]. Berlin: Springer. Nuri, L., Shadmehr, A., Ghotbi, N., & Moghadam, B. A. (2013).
Reaction time and anticipatory skill of athletes in open and closed skill-dominated sport. European Journal of Sport Sci-ence,13, 431–436. doi: 10.1080/17461391.2012.738712 Oesterreich, R. (1981). Handlungsregulation und Kontrolle
[Ac-tion regula[Ac-tion and control]. München: Urban & Schwar-zenberg.
Ogris, G., Leser, R., Horsak, B., Kornfeind, P., Heller, M., & Baca, A. (2012). Accuracy of the LPM tracking system considering dynamic position changes. Journal of Sports Sciences, 30, 1503–1511. doi: 10.1080/02640414.2012.712712
Pina, T. J., Paulo, A., & Araújo, D. (2017). Network characteristics of successful performance in association football. A study on the UEFA Champions League. Frontiers in Psychology, 8:1173. doi: 10.3389/fpsyg.2017.01173
Rampinini, E., Impellizzeri, F. M., Castagna, C., Coutts, A. J., & Wisløff, U. (2009). Technical performance during soccer matches of the Italian Serie A league: effect of fatigue and competitive level. Journal of Science and Medicine in Sport, 12, 227–233. doi: 10.1016/j.jsams.2007.10.002
Reed, L. (2004). The official FA guide to basic team coaching. Lon-don: Hodder & Stoughton.
Siegle, M., Stevens, T., & Lames, M. (2013). Design of an accuracy study for position detection in football. Journal of Sports Sci-ences, 31, 166–172. doi: 10.1080/02640414.2012.723131 Steiner, S. (2018). Passing decisions in football: Introducing an
empirical approach to estimating the effects of perceptual
References
Aquino, R., Puggina, E. F., Alves, I. S., & Garganta, J. (2017). Skill-related performance in soccer: A systematic review. Human Movement, 18(5), 3–24. doi: 10.1515/humo-2017-0042 Araújo, D., Davids, K., & Hristovski, R. (2006). The ecological
dy-namics of decision making in sport. Psychology of Sport and Exercise, 7, 653–676. doi: 10.1016/j.psychsport.2006.07.002 Bandura, A. (2006). Guide for creating self-efficacy scales. In F.
Pajares & T. Urdan (Eds.), Self-efficacy beliefs of adolescents (pp. 307-337). Greenwich, CT: Information Age.
Baumeister, R. F., Vohs, K. D., & Funder, D. C. (2007). Psychology as the science of self-reports and finger movements. Whatever happened to actual behavior? Perspectives on Psychological Science, 2, 396–403. doi: 10.1111/j.1745-6916.2007.00051.x Bourbousson, J., & Fortes-Bourbousson, M. (2016) How
do co-agents actively regulate their collective behav-ior states? Frontiers in Psychology, 7:1732. doi: 10.3389/ fpsyg.2016.01732
Busemeyer, J. R., & Townsend, J. T. (1993). Decision field theory: A dynamic cognition approach to decision making. Psycho-logical Review, 100, 432–459.
Bush, M., Barnes, C., Archer, D. T., Hogg, B., & Bradley, P. S. (2015). Evolution of match performance parameters for various playing positions in the English Premier League. Human Movement Science, 39, 1-11. doi: 10.1016/j.hu-mov.2014.10.003
Cañal-Bruland, R., & Mann, D. L. (2015). Time to broaden the scope of research on anticipatory behavior: a case for the role of probabilistic information. Frontiers in Psychology, 6:1518. doi: 10.3389/fpsyg.2015.01518
Chawla, S., Estephan, J., Gudmundsson, J., & Horton, M. (2017). Classification of passes in football using spatiotemporal data. ACM Transactions on Spatial Algorithms and Systems, 3(2), Article 6.
Cohen, J., Cohen, P., West, S. G., & Aiken, L. S. (2003). Applied multiple regression /Correlation analysis for the behavioral sciences (3rd ed.). Mahwah, NJ: Erlbaum.
Eccles, D. W., & Tenenbaum, G. (2007). A social-cognitive per-spective on team functioning in sport. In G. Tenenbaum, & R. C. Eklund (Eds.), Handbook of sport psychology (3rd ed., pp. 264-283). Hoboken, NJ: John Wiley.
Evangelos, B., Aristotelis, G., Ioannis, G., Stergios, K., & Foteini, A. (2014). Winners and losers in top level soccer. How do they differ? Journal of Physical Education and Sport, 14, 398–405. doi: 10.7752/jpes.2014.03061
Feigean, M., R’Kiouak, M., Seiler, R., & Bourbousson, J. (submit-ted). Achieving teamwork in naturalistic sport settings: an exploratory qualitative study of informational resources supporting football players’ activity when coordinating with others.
information and associative knowledge. Frontiers in Psy-chology, 9:361. doi: 10.3389/fpsyg.2018.00361
Steiner, S., Macquet, A.-C., & Seiler, R. (2017). An integrative perspective on interpersonal coordination in interactive team sports. Frontiers in Psychology, 8:1440. doi: 10.3389/ fpsyg.2017.01440
Stevens, T. G. A., Ruiter, C. J. de, Niel, C. van, Rhee, R. van de, Beek, P. J., & Savelsbergh, G. J. P. (2014). Measuring accelera-tion and deceleraaccelera-tion in soccer-specific movements using a Local Position Measurement (LPM) system. International Journal of Sports Physiology and Performance, 9, 446–456. doi: 10.1123/ijspp.2013-0340
Tabachnick, B. G., & Fidell, L. S. (2014). Using multivariate statis-tics (6th ed.). Harlow: Pearson.
Travassos, B., Araújo, D., Davids, K., Esteves, P. D., & Fernandes O. (2012). Improving passing actions in team sports by devel-oping interpersonal interactions between players. Interna-tional Journal of Sports Science & Coaching, 7, 677–688. Turvey, M. T., & Shaw, R. E. (1995). Toward an ecological
phys-ics and a physical psychology. In R. L. Solso & D. W. Massaro (Eds.), The science of the mind: 2001 and beyond (pp. 144– 169). New York: Oxford University Press.
Vercruyssen, V., De Raedt, L., & Davis, J. (2016). Qualitative spa-tial reasoning for soccer pass prediction. In J. Van Haaren (Ed.), Machine learning and data mining for sports analyt-ics, ECML/PKDD workshop, Riva del Garda, 19 Septem-ber 2016. Retrieved from https://lirias.kuleuven.be/bit-stream/123456789/551174/1/manuscript.pdf
Vilar, L., Araújo, D., Davids, K., & Button, C. (2012). The role of ecological dynamics in analyzing performance in team sports. Sports Medicine, 42, 1–10.
Vilar, L., Araújo, D., Davids, K., Travassos, B., Duarte, R., & Parreira, J. (2014). Interpersonal coordination tendencies supporting the creation/prevention of goal scoring opportunities in futsal. European Journal of Sport Science, 14, 28-35.