VOLUME 16 ISSUE 1 (2018), Page 334 – 347
HOUSE PRICE MOVEMENT FOR PRIMARY AND SECONDARY MARKETS: EVIDENCE FROM SELANGOR, MALAYSIA
Haszlila Jalil1, Norngainy Mohd Tawil2, Md Nasir Daud3, & Aina Edayu Ahmad4
1,2Faculty of Engineering and Built Environment,
UNIVERSITI KEBANGSAAN MALAYSIA
3
Faculty of Built Environment UNIVERSITI MALAYA, MALAYSIA
4
Valuation and Property Services Department
NATIONAL PROPERTY INFORMATION CENTRE
Abstract
The aim of this study is to determine the trend of escalation for both primary and secondary housing units. This research applies the desk study approach which uses secondary data from statistical format, which is the property market report (PMR) from the year of 2004 to 2014. Data from the PMR was analysed by using descriptive statistics method which provides a general overview of the house price movement. The observation only focuses the house price movement from the (9) districts in Selangor state. Results show that even though the volume of transactions decreases, the prices of residential properties are steadily increasing which also indirectly escalates the secondary market price.
property market is important to the national economy (BNM, 2013). The growth of population increases the demand for housing especially in the Klang Valley (C H Williams Talhar & Wong, 2014). This scenario creates urbanization and subsequently affect house prices (Hashim, 2000). The transportation routes and easy accessibility influence the prices of residential properties (Adair, McGreal, Smyth, Cooper, & Ryley, 2000). Additionally, neighbourhood facilities such as the recreational and shopping areas also affect the house price (Ding & Knaap, 2003; So, Tse, & Ganesan, 1997).
In this research, the movement of the residential property prices were analysed based on the primary market transactions set up by the developers and secondary market transactions which were recorded by the National Property Information Centre (NAPIC) from year 2004 to 2013. Primary market is the price which was set by the developers, which means that the transaction is between the developers and first house buyers. It represents the first transaction for the new development. On the other hand, the secondary market refers to sub sale, which indicates that the price is set by individuals based on the current market transaction. It can be the second, the third or later subsequent of transactions in the market (NAPIC, 2014).
The scope of the research only focuses Selangor as it is the state with the highest population in Malaysia. According to 2014 Property Report by Zaki and Partners, Selangor is one of the most attractive and developed states besides Kuala Lumpur and Johor. The researchers will observe the movement of prices and volume of transactions by district and type of residences for the year 2004 to 2013.
SELANGOR HOUSING MARKET
to the 2010 statistics from the Department of Statistics, 20 to 29 years group of ages constituted the largest group, which represents 23% of the total population in Selangor. This is most probably due the job opportunities, educational centres and other activities that attract such young group of people.
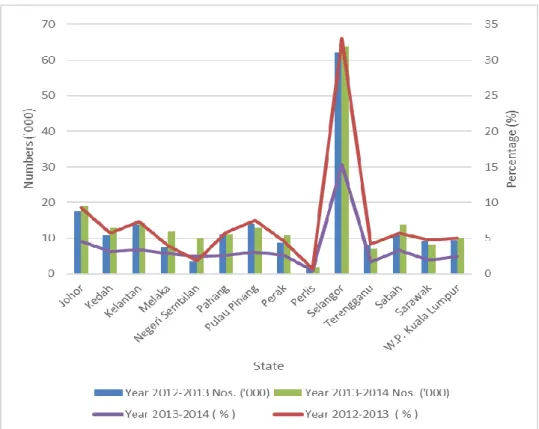
The attractions have led to the increased numbers of density in Selangor, along with the residential development. The increasing commercial activities such as shopping complexes, industrial and trading also influence the increased number of migration to Selangor. Thus, demand for residential is gradually increasing to fulfil the needs for dwelling. Figure 1 shows the state-by-state of-immigrant population for the 2012 to 2013 and the 2013 to 2014.
Figure 1: Immigrants by state, Malaysia, 2012-2013 & 2013-2014
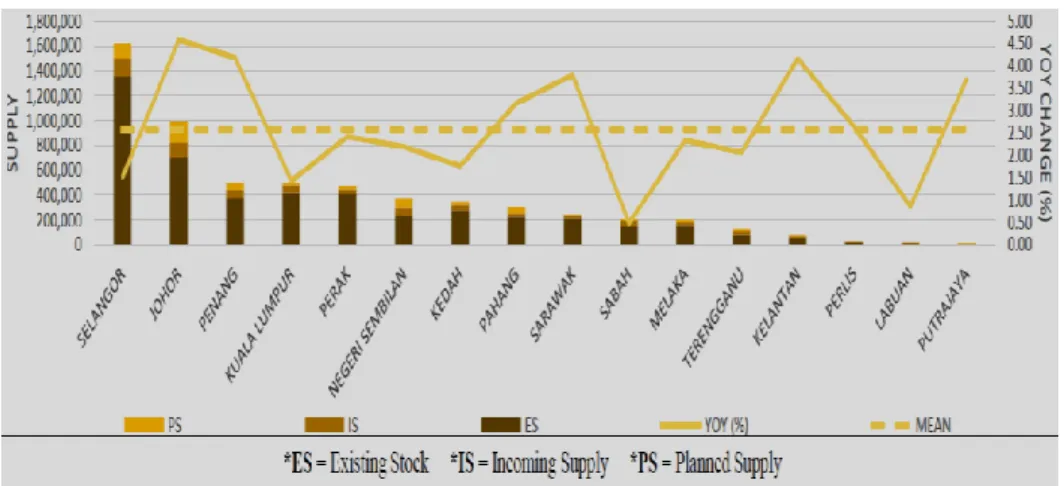
Figure 2: Supply compilation of residential properties in Malaysia, 2013
Source: NAPIC (2014)
Figure 2 shows that Selangor was the highest existing stock of residential properties (1,358,054:29%), also with the highest number of incoming supply (149,644:21%) and second highest number in planned supply (116,881:19%). In terms of the property market, the state of Selangor had recorded 64,269 units of transactions comprising of 26.1% of the residential sub-sector in Malaysia (NAPIC, 2014). Figure 3 shows the breakdown on property transactions by all states for 2013.
Figure 3: Breakdown on volume of transaction by state, 2013
According to NAPIC (2014), house prices generally remained unchanged for the year 2014, as new housing estates proliferated around neighbourhood amenities such as the KTM commuter stations, Rawang Bus Terminal, Rawang AEON and TESCO hypermarkets, and around highways such as Shah Alam Highway (KESAS), New Klang Valley Expressway (NKVE), New Pantai Expressway (NPE), Lebuhraya Damansara-Puchong (LDP) and the Federal Highway. However, house prices are expected to rise along with the increasing costs of raw materials and lands which then led in the increase of development costs. Moreover, primary market price will keep rising and this scenario will have certain impact to the secondary market price. Market analysts involved in the real estate industry anticipate that house prices in secondary market will continue to rise if the supply of affordable houses is decreasing as developers prefer to provide high-end products with high marginal return.
METHODOLOGY
Data Collection
This research applies the desk study approach which use secondary data from statistical format, which is the property market report (PMR). The word statistical refers to official statistics collected by NAPIC to provide information on market transacted house price. For this research, the researchers use reports of property market transaction from year 2004 to 2013. The researchers intended to observe the house price movement of (9) districts in Selangor state. The PMR presents two sets of data, i) primary residential houses transacted price and ii) secondary residential houses transacted price.
Data Analysis
Data from the PMR will be analysed by using descriptive statistics method which provides a general overview of the house price movement. The data is presented in the form of tabulation such as the bar charts, pie charts and graphs.
FINDINGS ON THE MARKET EVIDENCE
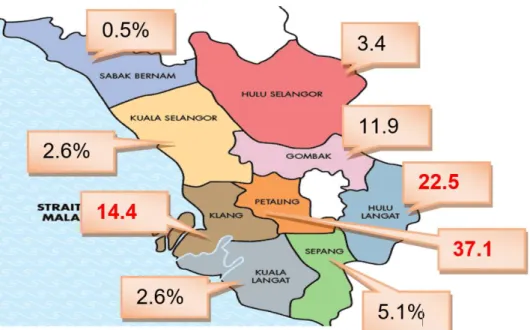
Selangor comprises nine (9) districts, namely Gombak, Hulu Langat, Hulu Selangor, Klang, Kuala Langat, Kuala Selangor, Petaling, Sabak Bernam dan Sepang. From the analysis, the districts of Petaling, Klang and Hulu Langat are active in buying and selling residential properties. Petaling is the prime area of the city centre and known to have high population density.
Figure 4: Breakdown of the percentage of transaction by district in Selangor
Source: NAPIC (2014)
Volume of Transactions by District
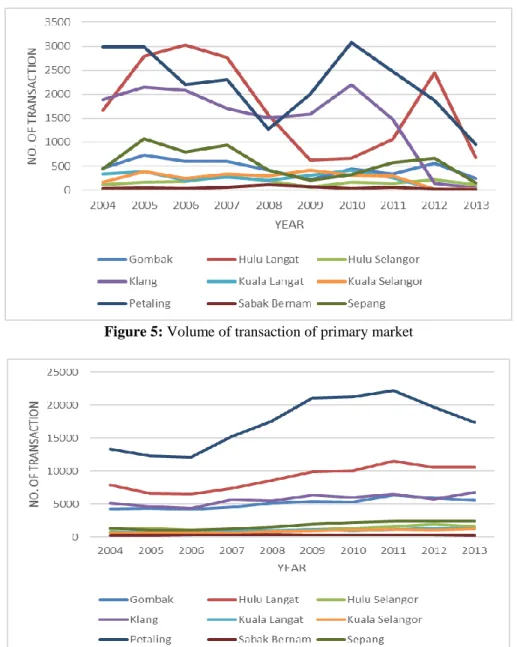
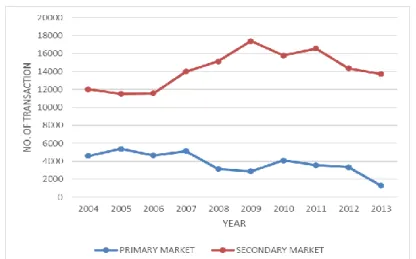
Figure 5: Volume of transaction of primary market
Figure 6: Volume of transaction of secondary market
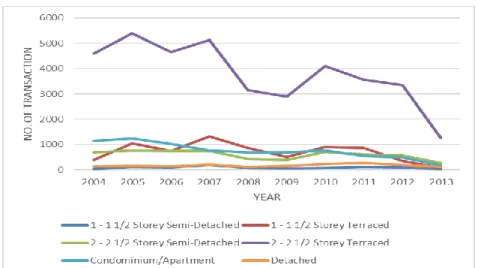
Figure 7: Movement of primary market transaction by type of residential property
Figure 8: Movement of secondary market transaction by type of residential property
Both graphs showed that the volume of transactions on the secondary market was not affected regardless of the uncertain flow for the primary market. As compared to the primary market, the secondary market in Selangor remained active with an upward movement observed in the transaction volume of the properties.
Volume of Transactions by Type of Residential Property
For the primary market, the residential terrace houses of 2-2 ½ storey represented the highest transaction in the year 2004 and year 2013 which also applicable for the secondary market. Although more attractive and relatively affordable condominiums were being launched in the market, landed residential properties remained the preferred choice of accommodation by the Selangor residents.
Despite of that, multi-storey dwellings such as condominium and apartment showed a significant rise in the year 2008-2011 for secondary market although the movement was expected to be static in the primary markets. Huge escalation in prices of landed property may serve as the main reason and lead buyers to purchase condominiums or apartments.
In relation with migration, most of whom were young and in a small number of families and categorised as a middle-income earner. The multi storey residential was the suitable type for them to reside. Economic crisis was also one of the factors which financial institution bit stringent in providing financial support to the youngsters. Percentage of migration which most of whom were middle-income earners become a primer to purchase multi-storey dwelling. Aside from that, incentive from financial institution and huge reduction in supply of landed properties may also be one of the reasons. Developers also took advantage by delaying the constructions of landed property and focusing on developing high rise residential property.
Volume of Transactions for Double Storey Terrace House
Figure 9: Movement of volume of transaction for double storey terrace house
Price Movement – Type of Property
Based on the analysis, three types of houses with active escalation in prices observed comprised of detached, 2-2½ storey semi-detached and 2-2½ storey terraced houses.
Figure 11: Trend of average price of the secondary market by type of residential property
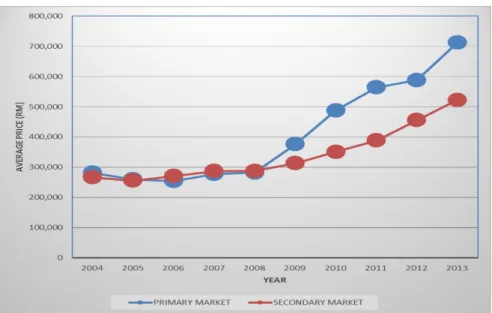
Figure 12: Trend of average price for double storey terrace
Figure 12 above represents the price trend for double storey terrace house in Selangor. It shows that both primary and secondary markets were stable, beyond RM300, 000 for the year 2004-2008. However, a slight movement was observed in the middle of 2008. The price in the primary market increased to RM700,000 in year 2013 while in the price in secondary market went up to RM500,000 in year 2013.
From the graph and analysis, it is safe to conclude that the price determined by the developer for the new development will bring a positive impact on the secondary market price.
CONCLUSION
From the analysis, it is evidenced that even though the volume of transactions decreased, prices of residential properties were steadily increasing. This escalation indirectly affects the secondary market price mostly for high-end and medium residential homes.
In the face of economic difficulties, prices for residential property tend to be fall-resistant and are more likely to remain unchanged compared to the commercial property as well as equity. In many cases, movement in residential housing market will contradict the volume of transactions compared to prices since property owners will not sell their properties at low price (Zhu, 2005).
Developers will slow down their activities to ensure that the completed residential schemes developed are fully sold. With the existing price of primary market, most future purchasers would move to secondary market to purchase their property. Small family may prefer the primary market for modern concept and design. As for aged family, they would divert their intention taking into consideration cost of living, hence settled with residential in the secondary market. Secondary market becomes an option due to the accessibility neighbourhood scheme, recreational and others.
As of the current scenario, most of immigrants in Selangor are categorized under the middle-income earners, thus, they prefer to invest in secondary market. The above facts show that secondary market is growing in line with the movement of price for primary market. It is then concluded that the price movement in secondary market is affected by price escalation in primary market, demand from middle-income earners as well as immigrants, high population area, and readiness of completed infrastructure to reach the housing area. Most of secondary market areas had been fully equipped with modern infrastructure, schools, complexes and even higher education institutions and market analysts opine that those infrastructures will boost the secondary market up.
Haron, N. A., & Liew, C. (2013). Factors influencing the rise of house price in Klang Valley. International Journal of Research in Engineering and Technology (IJRET), 2(10), 261-272.
Hashim, Z. (2000). Pembandaran dan kenaikan nilai harta tanah di Malaysia. Akademika, 5(1), 27-46.
Jabatan Perangkaan Malaysia (2015). Laporan penyiasatan migrasi, Malaysia 2014.
Putrajaya: Jabatan Perangkaan Malaysia.
National Property Information Centre [NAPIC] (2014). Laporan pasaran harta tahunan. So, H. M., Tse, R. Y. C., & Ganesan, S. (1997). Estimating the influence of transport on house prices: Evidence from Hong Kong. Journal of Property Valuation and Investment, 15(1), 40-47.