VOLUME 15 ISSUE 1 (2017), Page 289 - 294
MEASURING SOCIO-ECONOMIC INDICATORS FOR CLIMATIC ANALYSIS
Illyani Ibrahim1
1Kulliyyah of Architecture & Environmental Design
INTERNATIONAL ISLAMIC UNIVERSITY MALAYSIA
Abstract
Socio-economic indicators are important indexes to measure the effect of human activities towards climate. This paper aims to study on the two main socio-economic indicators for the urban area, namely population and GDP, to determine the relationship between these variables and climate condition. The State of Selangor, Malaysia was chosen as the study area as this state is among the highest GDP contributors to the country. Secondary data was used for this study by utilising datasets from Statistical Department and Department of Meteorology. The model derived shows that climate condition is moderately dependence of population and GDP. Further analysis can focus on more important socio-economic variables which may contributed to the climate condition in the urban area.
Keyword: Socio-economic indicators, GDP, urban area
Date Received: 30th April 2016
INTRODUCTION
The expansion of impervious surface by transforming green and natural areas is a part of human activities, and gives impact towards local and global environment. Globally, more people live in urban areas than in rural areas. Starting in 2007, the global urban population exceeded the global rural population and this pattern continues until now (United Nations, 2014). A study by United Nation Statistics Division (2012) shows that the urban population in Malaysia is 73.5% of the total population. Thus, the need to understand the relationship of human activities with the environment is crucial to ensure a good standard of quality of life of the urban population.
At local scale, urban heat island (UHI) is an example of the climatic problem as the temperature in the urban area rises higher than that of the area outside the city. The size of city and the number of residents are shown to have an inverse connection with regional wind speed and the logarithm of the population (Oke, 1973). Oke (1973), and Torok, Morris, Skinner and Plummer (2001) studied the relationship of UHI and population and found a relationship through logarithmic relationships. In addition, Oke (1973) concluded that even a city with a small population could be affected by UHI. However, another analysis had a correlated surface temperature and population density and found a quite linear pattern by removing the influence of the rural area (Streutker, 2003). Several other studies have correlated UHI or surface temperature to the economic and social indicators (Foroni et al., 2007; Murphy, 2009), which illustrated that the concern about how far temperature can impact people’s way of life and vice versa.
In a study carried out by Zhang, Wang, Shen and Da (2009), the socio-economic indicators used were population, electricity power consumption and gross domestic product. The found a high correlation between UHI intensity and these variables. In addition, Cheval and Dumitrescu (2009) calculated UHI using remote sensing imagery by comparing average temperatures of 5 km and 10 km buffers, which is due to the heterogeneity of the land cover causing larger differences between adjacent surfaces. These studies support the argument that UHI is a local environmental problem which is related to land cover changes.
Human activities are also modifying the chemical composition of the atmosphere through the urban build-up of greenhouse gasses which significantly increases the urban heat (Bhiwapurkar, 2007). The alteration of landscapes to urban impervious surfaces has also altered the energy balance of outgoing and incoming solar radiation. As a result, this contributes to the higher urban air temperature as compared to the surrounding areas, adding to the UHI effect.
METHOD
This study utilised secondary socio-economic and mean-monthly temperature data. Data on GDP were obtained from the World Bank datasets to represent economic indicator. These data were recorded in US dollar. GDP is one of the primary indicators of economic activity. Meanwhile, population data were sourced from the Department of Statistics Malaysia to represent social indicator. Temperature data were obtained from the Malaysian Meteorological Department. These were mean temperature recorded at the Petaling Jaya, Selangor weather station. Linear regression method was used to analyse these data. It was discussed in the literature that appropriate analysis should use datasets covering more than 30 years. For this current dataset, the mean annual temperature was used from 1971 until 2010 (39 years).
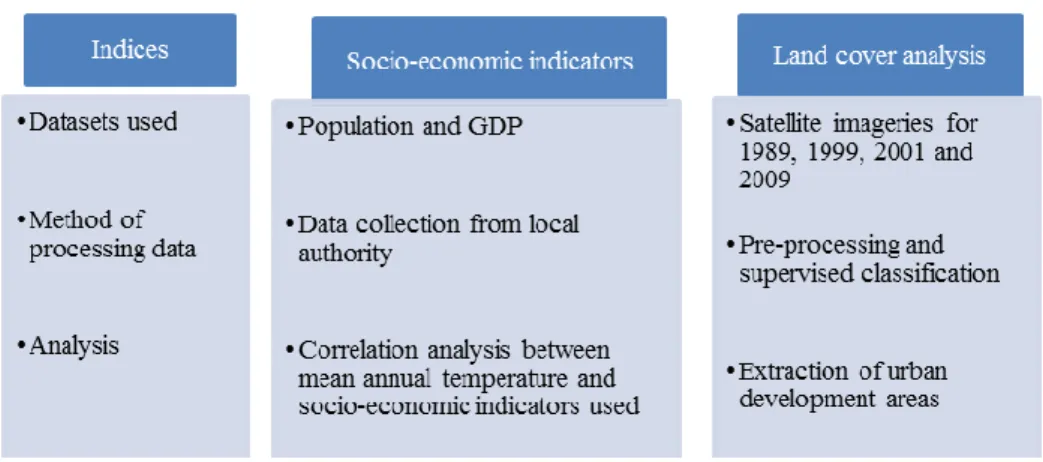
In the meantime, a supervised classification of four satellite imageries was also generated to identify the urban areas within the study area. The land cover map was produced by using the Supervised Classification by the iteration of the clustering algorithm. Series of classes are produced to determine the signature of each class so each of the pixel was compared to these signatures and labelled to the most similar values digitally. Figure 1 show the work flow of the research.
Figure 1 Framework of the work flow
RESULTS AND DISCUSSION
The analysis demonstrated the influence of socio-economic indicators towards urban growth and the increase of the air temperature in the study area. For instance, Figure 2 shows that a moderate significant linear relationship is evident between GDP and the mean annual temperature, which means that a moderate dependence of urbanization growth (R2 =0.6) has impacted the increase of mean
study suggested that the economic growth of Kuala Lumpur and mean annual temperature have consistently increased over the years.
Figure 2 Mean annual temperature and Malaysian GDP (billion)
Figure 3 shows the scatterplot of Malaysian GDP and urban development areas (in km2) where the time studied is according to available images. According
to the graph, a strong linear regression exists between GDP and urban development areas. This relationship indicates that the good positive linear relationship exist between these two variables. The underlying factor of this finding is that the Malaysian GDP is always related to the economic development, which in turn is closely related to the physical activities such as industrial and commercial development. These development often involve conversion of large greenfields into urban areas which has accelerated the impact of UHI intensity.
Figure 3 Malaysian GDP and urban development areas
y = 0.0087x + 26.825 R² = 0.6 26.0
26.5 27.0 27.5 28.0 28.5
0 20 40 60 80 100 120 140 160
M
ea
n
Annu
a
l
T
em
pera
ture
(º
C
)
Malaysian GDP (billion)
Mean annual temperature (urban) vs Malaysian GDP
(billion)
y = 0.0044x - 6.3285 R² = 0.9416
0 50 100 150 200 250
0 10000 20000 30000 40000 50000
G
DP
(US
'bi
ll
io
n
)
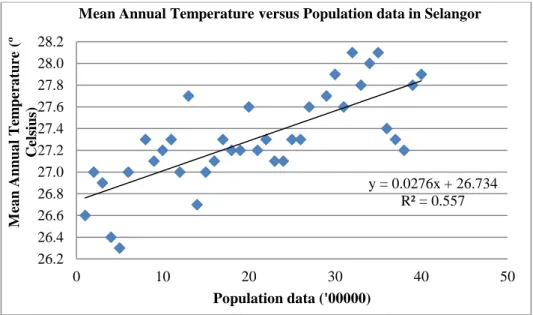
The scatterplot in Figure 4 shows the mean annual temperature versus population (‘000). The analysis shows that it has a moderately linear regression between mean annual temperature and population data at R2 = .557. A positive
correlation was also identified, which indicated that the mean annual temperature was increasing as the population number increased over the time period.
Figure 4 Mean annual temperature and population data
The analyses conducted show that there is a relationship between mean annual temperature and socio-economic indicators, where the temperature has increased in sync with the increased in GDP and population growth. The growth of urban areas is also closely interrelated to UHI intensity of the study area. These indicate that economic development do accelerate the temperature increase in the urban area. This result shows consistency with the findings by Zhang et al. (2009) that UHI has increased linearly with population, and a significant logarithmic relationship is evident between UHI intensity and GDP. Oke (1973) also found that population has a logarithmic relationship to UHI. However, Pindyck (2010) argues that the economic impact of warming should be modelled as a relationship between temperature change and the growth rate of GDP, and suggests that future research should not simply depend on temperature alone, but also the entire path of temperature.
CONCLUSION
This paper have shown that there is a significant increasing trend in mean annual temperature and the relationship of mean annual temperature is higher with GDP compared to its relationship to population. The increase of GDP and population
y = 0.0276x + 26.734 R² = 0.557
26.2 26.4 26.6 26.8 27.0 27.2 27.4 27.6 27.8 28.0 28.2
0 10 20 30 40 50
M
ea
n
Annu
a
l
T
em
pera
ture
(º
Celsiu
s)
Population data ('00000)
have brought about spatial growth in urban development as well as increased in motorised vehicles, and also the conversion of greenfields into built-up areas. This has changed the landscape of the study area and has contributed rising local temperature. Future analysis should focus on the density of housing, number of vehicle, household income and telephone lines which and seek their relationship to the climate condition, especially of the urban areas.
ACKNOWLEDGEMENTS
This study is funded by the Research Initiative Grant Scheme (RIGS) RIGS15-025-0025 from International Islamic University Malaysia (IIUM).
REFERENCES
Bhiwapurkar, P. (2007). Urban heat island phenomenon, urban morphology and building energy: the case of Chicago, USA (Doctoral dissertation). Illinois Institute of Technology, USA.
Cheval, S., & Dumitrescu, A. (2009). The July urban heat island of Bucharest as derived from MODIS images.Theoretical and Applied Climatology, 96, 145–153. Foroni, M., Salvioli, G., Rielli, R., Goldoni, C. A., Orlandi, G., Zauli Sajani, S., Guerzoni,
A., Maccaferri, C., Daya, G., & Mussi, C. (2007). A retrospective study on heat-related mortality in an elderly population during the 2003 heat wave in Modena, Italy: the Argento Project. J Gerontol A Biol Sci Med Sci, 62(6), 647–651. Murphy, R. (2009). Heat stress vulnerability as predicted by spatial analysis of remotely
sensed imagery and socioeconomic data for Philadelphia (Master’s thesis). University of Delaware, USA.
Oke, T. R. (1973). City size and the urban heat island.Atmospheric Environment, 7(8), 769–779. http://doi.org/10.1016/0004-6981(73)90140-6
Pindyck, R. S. (2010). Modeling the impact of warming in climate change economics. NBER Working PaperNo. 15692. http://doi.org/10.2139/ssrn.1539020
Streutker, D. R. (2003). A study of the urban heat island of Houston, Texas (Doctoral dissertation). Rice University, Houston, Texas, USA.
Torok, S. J., Morris, C. J., Skinner, C., & Plummer, N. (2001). Urban heat island features of southeast Australian towns.Australian Meteorological Magazine, 50, 1–13. United Nations. (2014). World Urbanization Prospects.
Zhang, K., Wang, R., Shen, C., & Da, L. (2009). Temporal and spatial characteristics of the urban heat island during rapid urbanization in Shanghai, China.