Analysis of Milk Supply and Trade Balance in the EU-27
Ion Pirvutoiu
1, Agatha Popescu
21
Hyperion University Bucharest, 030615 Bucharest, 169 Calarasilor, District 3, Romania
2
University of Agricultural Sciences and Veterinary Medicine Bucharest, 011464, 59 Marasti, District 1, Romania
Abstract
The purpose of the paper is the analysis of the EU-27 milk supply balance and milk trade balance in order to present the largest milk producers, exporters and importers and the coverage degree of milk supply by production, imports, exports and stock changes, using the data provided by FAO Stat, 2009-2010 for the reference period 2003-2005.The EU-27 milk supply balance accounted for 116,229 thou tons of which 54.5 % is assured by Germany, France, Italy, United Kingdom, Poland, Netherlands and Romania. A number of 22 EU countries registered a self sufficiency degree higher than 100 %, at the EU-27 level its performance being 132 %. About 67 % milk it achieved in Germany, France, United Kingdom, Poland, Italy and Netherlands, which are the EU largest milk producers. The EU-27 trade balance is a positive one, exports exceeding imports by 10,448 thou tons milk. The main EU milk exporters are France, Germany, Ireland, Netherlands, Denmark and Poland. The main EU milk importers are Germany, Italy, Netherlands, United Kingdom, Belgium, Spain and France. The EU production is enough for covering milk demand and export the surplus to other countries.
Key words: analysis, EU-27, milk supply, trade balance.
1. Introduction
Food Supply Balance is an economic tool whose purpose is to reflect food origin and evaluate the amounts available for domestic uses.
Milk Supply Balance Sheet presents the statement of production, Imports, Exports, Changes in stocks and domestic uses (animal feed, processing, lasses, human consumption and per capita in kg according to FAO procedure [ 1].
The amounts of milk exceeding domestic uses could be exported. But at international level, there are three state categories: exporters, importers and both exporters and importers depending on their milk production and correlation to milk consumption, advantages coming from milk selling on various external markets as discussed by Popescu Agatha [2].1
Milk foreign trade is reflected by Milk Trade Balance and various specific efficiency indicators
* Corresponding author: Agatha Popescu,
+40 21 318 2564/232, [email protected]
as discussed by Popescu Agatha [ 2], Ipache Lelio and all [ 3] and Verbecke N. [ 4].
In this context, the aim of the papers is to analyze milk supply balance and milk trade balance in the EU-27, taking into account that the EU member states play an important part in the world milk production and trade.
2. Materials and methods
The data concerning milk production, exports, imports, changes in stocks and domestic uses have been collected from FAO Stat 2009-2010 for all the 27 EU member states for the period 2003-2005.
According to FAO methodology, the formula of milk supply balance is:
Milk Supply Balance=Production+Imports-Exports±Changes in Stocks
Milk Imports includes commercial trade, milk aid granted on specific terms, donated amounts and estimated of unrecorded milk trade.
Milk Exports includes all movements of milk out of country during the reference period.
Changes in stocks comprises stock changes occurring during the reference period at all levels from production to the retail stage (government stocks, in stocks with milk processors, importers, exporters, either whole sale and retail merchants, transport and storage enterprises).
Supply for domestic utilization results from production + imports – exports and changes in stocks (increases or decreases).
The data have been processed and the following indicators have been calculated:
The share of each EU country’s milk production
into the EU-27 milk production according to the formula:
n 1 i
i i
X X % S
The share of Milk Exports by country in the EU-27
into the EU-27 Milk Exports, according to a similar formula;
The share of milk imports by country in the EU-27
into the EU-27 milk imports, using the formula mentioned above;
The shares of changes in milk stocks by country
into the EU-27 stock changes, using the some formula;
The share of milk supply balance by country into the EU-27 milk supply balance, based on the same formula;
The degree of milk supply coverage by production, exports, imports and stock changes, according to the following formulas:
MSCp= P/MS, where: MSCp= degree of milk supply coverage by production;
MSCE = E/MS, where: MSCE = degree of milk
supply coverage by exports
MSCI = I/MS, where: MSCI = degree of milk
supply coverage by imports
MSCSC = SC/MS, where: MSCSC = degree of milk
supply coverage by stock changes
Self-Sufficiency, SS, according to the formula:
SS = Usable production/Domestic uses
Milk Trade Balance (MTB) by country according to the formula:
MTB = E-I, where E = exports, I = imports
Milk Trade Efficiency reflected by important indicators:
-Degree of production coverage by exports (E-P Ratio), according to the formula:
E-P Ratio = Exports/Production
-Degree of import coverage by exports (E-I Ratio), according to the formula:
E-I Ratio = Exports/Imports
3. Results and discussion
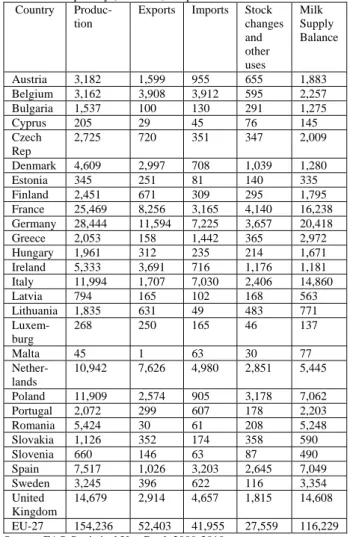
Milk Supply Balance. In the period 2003-2005,
EU-27 milk supply was 116,229 thousand tons determined by 154,236 thou tons milk production, 41,955 thou tons imports, 52,403 thou tons exports and 27,559 thou tons changes in milk stocks (Table 1).
Table 1. Milk Supply Balance Sheet in the EU 27 (butter excluded) quantity (‘000 tons) the period 2003-2005
Country Produc-tion
Exports Imports Stock changes and other uses
Milk Supply Balance
Austria 3,182 1,599 955 655 1,883 Belgium 3,162 3,908 3,912 595 2,257 Bulgaria 1,537 100 130 291 1,275 Cyprus 205 29 45 76 145 Czech
Rep
2,725 720 351 347 2,009
Denmark 4,609 2,997 708 1,039 1,280 Estonia 345 251 81 140 335 Finland 2,451 671 309 295 1,795 France 25,469 8,256 3,165 4,140 16,238 Germany 28,444 11,594 7,225 3,657 20,418 Greece 2,053 158 1,442 365 2,972 Hungary 1,961 312 235 214 1,671 Ireland 5,333 3,691 716 1,176 1,181 Italy 11,994 1,707 7,030 2,406 14,860 Latvia 794 165 102 168 563 Lithuania 1,835 631 49 483 771
Luxem-burg
268 250 165 46 137
Malta 45 1 63 30 77
Nether-lands
10,942 7,626 4,980 2,851 5,445
Poland 11,909 2,574 905 3,178 7,062 Portugal 2,072 299 607 178 2,203 Romania 5,424 30 61 208 5,248 Slovakia 1,126 352 174 358 590 Slovenia 660 146 63 87 490 Spain 7,517 1,026 3,203 2,645 7,049 Sweden 3,245 396 622 116 3,354 United
Kingdom
14,679 2,914 4,657 1,815 14,608
EU-27 154,236 52,403 41,955 27,559 116,229 Source: FAO Statistical YearBook 2009-2010
The weight of each EU country’s milk
production into the EU 27 milk production is
different from a country to another (Table 2).
Table 2. The weight of each EU country’s Milk Production into the total EU Milk Production in the period 2003-2005 (%) Country Milk
Production Share (%)
Country Milk Production Share (%)
Country Milk Production Share (%)
Austria 2.06 Germany 18.44 Netherlands 7.09
Belgium 2.05 Greece 1.33 Poland 7.72 Bulgaria 0.99 Hungary 1.27 Portugal 1.34 Cyprus 0.13 Ireland 3.45 Romania 3.51
Czech Republic
1.77 Italy 7.74 Slovakia 0.73
Denmark 2.98 Latvia 0.51 Slovenia 0.42 Estonia 0.41 Lithuania 1.18 Spain 4.87 Finland 1.58 Luxemburg 0.17 Sweden 2.10 France 16.51 Malta 0.02 U.nited
Kingdom 9.51
The countries with the largest share into the EU 27 milk production are, in order: Germany 18.44 %, France 16.51 %, United Kingdom 9.51 %, Poland 7.72 %, Italy 7.74 %, Netherlands 7.09 %, which together contribute to the EU production by 67.01 % and could be considered the main milk producers.
There are also countries of less importance for the EU milk production such as: Cyprus, Luxemburg, Estonia, Slovenia, Slovakia.
Romania’s contribution to the EU Milk production is 3.51 % reflecting a middle production performance .
The weight of each EU country’s milk export
into the EU 27 milk exports also varied from a
state to another. The main milk exporters with the largest share into the EU-27 milk exports are: Germany 22.12 %, France 15.75 %, Netherlands 14.55 %, Belgium 7.45 %, Ireland 7.04 %, Denmark 5.71 % and U. Kingdom 5.56 %. All these 7 countries are responsible for 78.18 % of the EU milk exports and are considered the largest milk exporters (Table 3).
Table 3. Exports Weight by country in the EU-27 Milk Exports in the period 2003-2005 (%)
Country Milk Export
Share (%)
Country Milk Export
Share (%)
Country Milk Export
Share (%)
Austria 3.05 Germany 22.12 Netherlands 14.55
Belgium 7.45 Greece 0.30 Poland 4.91 Bulgaria 0.19 Hungary 0.59 Portugal 0.57 Cyprus 0.05 Ireland 7.04 Romania 0.05 Czech
Republic
1.37 Italy 3.25 Slovakia 0.67
Denmark 5.71 Latvia 0.31 Slovenia 0.27 Estonia 0.47 Lithuania 1.20 Spain 1.95 Finland 1.28 Luxemburg 0.47 Sweden 0.76 France 15.75 Malta 0.00 United
Kingdom 5.56
The weight of each EU country’s milk import
into the EU-27 milk imports is also different
from a state to another, according to its consumption needs, but also trade interest. The main EU milk importers are: Germany 17.22 %, Italy 16.75 %, Netherlands 11.86 %, United Kingdom 11.09 %, Belgium 9.32 %, Spain 7.63 % and France 7.54 %. All these 7 European countries imported 81.41 % of the EU-27 milk imports. There are also countries such as Cyprus 0,10 %, Lithuania 0.11 %, Romania 0.14 %, Slovenia 0.15 %, Malta 0.15 %, Estonia 0.19 %, Latvia 0.24 %, Bulgaria 0.30 %, Slovakia 0.41, Hungary 0.56 % and Finland 0.73 % whose imports represent 3.08 % of the EU milk imports (Table 4).
The weight of Stock Changes by country in the
EU-27 changes of milk stock is different from a
country to another. The largest milk stocks changes in the EU are registered by France 15.02 %, Germany 13.26 %, Poland 11.53 %, Netherlands 10.34 %, Spain 9.59 %, Italy 8.73 % and U. Kingdom 6.58 %. All these 7 countries keep 75.05 % of the EU milk stock changes.
Table 4. Import Weight by country in the EU-27 Milk Imports in the period 2003-2005 (%)
Country Milk Imports
Share (%)
Country Milk Imports
Share (%)
Country Milk Imports Share (%)
Austria 2.27 Germany 17.22 Nether-lands
11.86
Belgium 9.32 Greece 3.43 Poland 2.15 Bulgaria 0.30 Hungary 0.56 Portugal 1.44 Cyprus 0.10 Ireland 1.70 Romania 0.14 Czech
Republic
0.83 Italy 16.75 Slovakia 0.41
Denmark 1.68 Latvia 0.24 Slovenia 0.15 Estonia 0.19 Lithuania 0.11 Spain 7.63 Finland 0.73 Luxem-burg 0.39 Sweden 1.48 France 7.54 Malta 0.15 U.
Kingdom 11.09
Table 5. Share Milk Stock Changes and other uses by country in the EU-27 Milk Stock Changes in the period 2003-2005 (%) Country Share
of Milk Stock change
(%)
Country Share of Milk Stock change
(%)
Country Share of Milk Stock change(%)
Austria 2.37 Germany 13.26 Netherlands 10.34
Belgium 2.15 Greece 1.32 Poland 11.53
Bulgaria 1.05 Hungary 0.77 Portugal 0.64 Cyprus 0.27 Ireland 4.26 Romania 0.75 Czech
Republic
1.25 Italy 8.73 Slovakia 1.29
Denmark 3.77 Latvia 0.60 Slovenia 0.31 Estonia 0.50 Lithuania 1.75 Spain7,517 9.59 Finland 1.07 Luxemburg 0.16 Sweden 0.42 France 15.02 Malta 0.10 United
Kingdom
6.58
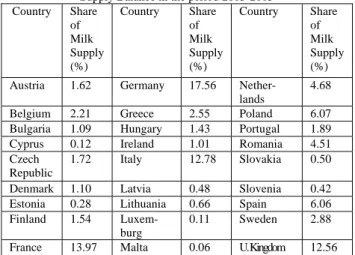
The Weight Milk Supply Balance by country. The distribution of milk supply balance in the EU territory varies according to each country’s production, imports, exports and stock changes. The most important countries in the EU milk supply balance are: Germany 17.56 %, France 13.97 %, Italy 12.78 %, United Kingdom 12.56 %, Poland 6.07 %, Netherlands 4.68 % and Romania 4.51 %. All these 7 states contribute by 54.57 % to the EU milk supply balance.
The countries with less importance in the EU milk supply balance are: Malta 0.06 %, Luxemburg 0.11 %, Cyprus 0.12 %, Estonia 0.28 %, Slovenia 0.42 %, Slovakia 0.50 % (Table 6).
Table 6. Share of Milk Supply Balance by country in the EU Milk Supply Balance in the period 2003-2005
Country Share of Milk Supply (%)
Country Share of Milk Supply (%)
Country Share of Milk Supply (%)
Austria 1.62 Germany 17.56 Nether-lands
4.68
Belgium 2.21 Greece 2.55 Poland 6.07 Bulgaria 1.09 Hungary 1.43 Portugal 1.89 Cyprus 0.12 Ireland 1.01 Romania 4.51 Czech
Republic
1.72 Italy 12.78 Slovakia 0.50
Denmark 1.10 Latvia 0.48 Slovenia 0.42 Estonia 0.28 Lithuania 0.66 Spain 6.06 Finland 1.54
Luxem-burg
0.11 Sweden 2.88
France 13.97 Malta 0.06 U. Kingdom 12.56
The Degree of Milk Supply Coverage by
production, exports, imports and stock changers is presented in table 7. At the EU-27 level, it is obviously. That production is the most important source for milk supply with 1,32 production/milk supply ratio. On the second position comes milk imports with an import/milk supply ratio 0.36 and
then on the 3rd position are situated changes in tocks with a 0.23 stock changes milk supply ratio (Table 7).
Table 7. Degree of Milk Supply Coverage by Production, Exports, Imports and Stock Changes and other uses in the period 2003-2005
Country Production Exports Imports Stock changes
and other
uses
Austria 1.69 0.85 0.51 0.35 Belgium 1.23 1.52 1.52 0.23 Bulgaria 1.21 0.08 0.10 0.23 Cyprus 1.42 0.20 0.31 0.53 Czech
Republic
1.36 0.36 0.18 0.17
Denmark 3.72 2.41 0.57 0.81 Estonia 1.93 0.75 0.24 0.42 Finland 1.37 0.38 0.17 0.16 France 1.57 0.51 0.19 0.25 Germany 1.39 0.57 0.35 0.18 Greece 0.69 0.05 0.49 0.12 Hungary 1.18 0.19 0.14 0.13 Ireland 4.55 3.16 0.61 1.00 Italy 0.80 0.11 0.47 0.16 Latvia 1.43 0.30 0.19 0.30 Lithuania 2.38 0.82 0.06 0.63 Luxemburg 1.96 1.83 1.20 0.34 Malta 0.58 0.01 0.82 0.39 Netherlands 2.01 1.40 0.92 0.52 Poland 1.69 0.37 0.13 0.45 Portugal 0.94 0.14 0.28 0.08 Romania 1.03 0.01 0.01 0.04 Slovakia 1.93 0.60 0.29 0.61 Slovenia 1.35 0.30 0.13 0.18 Spain 1.07 0.15 0.45 0.38 Sweden 0.97 0.12 0.19 0.03 U.
Kingdom
1.01 0.20 0.32 0.12
EU-27 1.32 0.45 0.36 0.23
The coverage degree is different from a country to another but it is very important to mention EU that milk production achieved in 22 EU countries exceeds their milk supply, reflected their production potential and that milk consumption is not influenced by imports .
Self-Sufficiency is present in 22 European
Table 8. Milk Self-sufficiency in the EU-27 member states in the period 2003-2005 (%)
Country
Self-sufficiency Country
Self-
sufficiency Country Self-sufficiency
Austria 168.9 Germany 139.30 Netherlan ds
200.95
Belgium 123.0 Greece 69.07 Poland 168.63 Bulgaria 120.5 Hungary 117.35 Portugal 94.05 Cyprus 141.3 Ireland 451.56 Romania 103.35 Czech
Republic
135.6 Italy 80.37 Slovakia 190.84
Denmark 360.0 Latvia 141.03 Slovenia 134.69 Estonia 192.5 Lithuania 238.00 Spain7,51
7
106.63
Finland 136.5 Luxembu rg
195.62 Sweden 96.75
France 156.8 Malta 58.44 United Kingdom
100.48
EU-27 132.70
Milk Trade Balance at the EU-27 is a positive
one, +10,448 thousand tons, as the EU exports exceed its milk imports. This aspect reflects that the EU is an important milk exporter at world level.
Among the EU countries there are states whose milk trade balance is a positive one, but also states with a negative balance.
In the period 2003-2005, the main milk exporters of the EU have been: France, Germany, Ireland, Netherland, Denmark and Poland, whose milk trade balance represent 13,948 thousand tons and exceeds milk trade balance at the EU level. There are also EU countries registering a negative milk trade balance, being considered milk importers: Italy, Spain, U. Kingdom and Greece (Table 9).
Milk Trade Balance Efficiency has been
analyzed by means of export/production and export/import ratios.
Table 9. Milk Trade Balance by country in the EU-27 in the period 2003-2005 (‘000 tons)
Country Trade Balanc
Country Trade Balance
Country Trade Balance
Austria +644 Germany +4,369 Netherlands +2,646 Belgiu
m
-4 Greece -1,284 Poland +1,669
Bulgari a
-30 Hungary +77 Portugal -308
Cyprus -16 Ireland +2,975 Romania -31 Czech
Republ ic
+369 Italy -5,323 Slovakia +178
Denma rk
+2,2 89
Latvia +63 Slovenia +83
Estonia +170 Lithuania +582 Spain7,517 -2,177 Finlan
d
+369 Luxembu rg
+85 Sweden -226
France +5,091 Malta -62 U.
Kingdom
-1,743
EU-27 +10,448
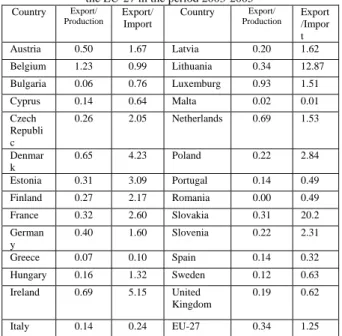
At the EU-27 level, 34 % of milk production is exported and export/import ratio is 1.25 reflecting a high efficiency milk trade at the international level.
Concerning Export/Production ratio, in the
period 2003-2005, there are European countries whose milk export represents an important part of milk production. It is about: Luxemburg 0.93, Netherlands 0.69, Ireland 0.69, Denmark 0.65, Germany 0.40, Estonia 0.38, Lithuania 0.34, France 0.32, Slovenia 0.31.
There are also countries whose milk exports are weakly represented in milk production. It is about Romania, Bulgaria, Greece, Sweden, Cyprus, Italy, Portugal, Spain, Hungary.
Belgium has a completely different situation, the export/production ratio is 1.23, because it used to import milk in higher amounts that its own production and then to make milk exports, taking the advantages of these commercial operations.
The Export/Import ratio, there are EU countries
whose ratio is over 1, reflecting that they are milk exporters. The EU countries with the largest milk foreign trade efficiency are: Lithuania (12.84), Ireland (5.15), Denmark (4.23), Estonia (3.09), Poland (2.84), France (2.60), Slovenia (2.31), Finland (2.17), Czech Republic (2.05), Slovakia (2.02), where milk exports are twice times higher than milk imports.
The countries with the lowest milk foreign trade efficiency concerning this aspect are: Malta (0,01) and Greece (0.10).
Table 10. Milk Export/Production Ratio and Export/Import Ratio – as measure of Efficiency in Milk Foreign Trade by country of
the EU-27 in the period 2003-2005
Country Export/ Production
Export/ Import
Country Export/ Production
Export /Impor t Austria 0.50 1.67 Latvia 0.20 1.62 Belgium 1.23 0.99 Lithuania 0.34 12.87 Bulgaria 0.06 0.76 Luxemburg 0.93 1.51 Cyprus 0.14 0.64 Malta 0.02 0.01 Czech
Republi c
0.26 2.05 Netherlands 0.69 1.53
Denmar k
0.65 4.23 Poland 0.22 2.84 Estonia 0.31 3.09 Portugal 0.14 0.49 Finland 0.27 2.17 Romania 0.00 0.49 France 0.32 2.60 Slovakia 0.31 20.2 German
y
0.40 1.60 Slovenia 0.22 2.31 Greece 0.07 0.10 Spain 0.14 0.32 Hungary 0.16 1.32 Sweden 0.12 0.63 Ireland 0.69 5.15 United
Kingdom
0.19 0.62
Italy 0.14 0.24 EU-27 0.34 1.25
The EU 27 Self-sufficiency is 132 %, reflecting that milk production exceeds milk supply at community level. A number of 22 EU countries, important milk producers, have a self sufficiency higher than 100 %.
The main milk producers are Germany (18.4 %), France (16.5 %), U. Kingdom (9.5 %), Poland (7.7 %), Italy (7.7 %), Netherlands (7.09 %), contributing by 67 % to the EU milk production. Concerning milk trade balance, the EU-27 has a surplus of 10,448 thou tons, as its exports exceeds imports.
The main EU milk exporters are France, Germany, Ireland, Netherlands, Denmark and Poland.
A negative trade balance is registered by Italy, Spain, United Kingdom and Greece.
Export/production and export/import ratios are advantaging the main milk producers.
About 34 % of EU milk production is exported an export/import ratio of 1.25, meaning a high efficient milk foreign trade of the EU-27.
Acknowledgements
The author addresses his sincere thanks to FAO for all its support given to all over world researches to have access to its statistical data base.
References
1. www.fao.org. FAOStat, 2009-2010
2. Popescu, A., 2010, Home and Foreign Trade, Dominor Rawex Coms Publishing House, Bucharest. 3. Lelio Ipache, Alessia Proietti, OECD Trade Indicators – Statistical Analysis of International Trade and Production: towards a scoreboard of indicators, www.oecd.org.