Original Research Article
P wave axis and its correlation with severity of chronic obstructive
pulmonary disease
Prasuna K. R.
1, Praveena Korani Ratnam
2*, Pramod Kumar K. R.
3, Krishna Kumar T. V. K.
4INTRODUCTION
Chronic obstructive pulmonary disease is rather very common disease. GOLD defined it as a disease which is preventable as well as treatable, but it can also lead to adverse effects beyond the pulmonary system.1 World
Bank has estimated that COPD can acquire the fifth position in terms of morbidities and third place in terms of mortality by 2020.2
COPD is associated with significant extra pulmonary effects out of which the cardiac manifestations are most common.3 COPD affects the pulmonary vessels; the right 1Department of General Medicine, Melmaruvathur Adhiparasakthi Institute of Medical Sciences and Research,
Melmaruvathur, Tamil Nadu, India
2Department of General Medicine, Sir Ronald Ross Institute of Tropical and Communicable Diseases, Nallakunta,
Hyderabad, Telangana, India
3Department of General Medicine, Deccan College of Medical Sciences, Hyderabad, Telangana, India 4Department of General Medicine, Government Medical College, Nizamabad, Telangana, India
Received: 22 December 2019
Accepted: 24 January 2020
*Correspondence:
Dr. Praveena Korani Ratnam, E-mail: [email protected]
Copyright: © the author(s), publisher and licensee Medip Academy. This is an open-access article distributed under the terms of the Creative Commons Attribution Non-Commercial License, which permits unrestricted non-commercial use, distribution, and reproduction in any medium, provided the original work is properly cited.
DOI: http://dx.doi.org/10.18203/2349-3933.ijam20200667
ABSTRACT
Background: COPD can affect the heart as secondary effects of the disease. The electrocardiography has been seen as a very best tool for early diagnosis of any cardiac changes that may occur as a result of secondary effects of the chronic obstructive pulmonary disease. Objective of the study was to study the P wave axis and its correlation with severity of COPD.
Methods: Here, 30 Patients of COPD confirmed by clinical history, examination and Pulmonary function tests were included in the study. These patients were clinically examined, and they underwent routine investigations like hemogram, urine examination, blood urea, serum creatinine, chest x-ray, random blood sugar, sputum examination and ABG analysis. These patients underwent pulmonary function test, ECG and ECHO.
Results: In this study 36.66% of patients had RVH. Incomplete RBBB was seen in 20%. 13.33% had normal ECG. Most common finding in patients with less than one year of exposure was RVH. Low voltage complexes and R/S ratio in V1>1 were the only ECG changes with significant correlation with severity of the disease (p<0.05). Maximum no. of patients had a P wave axis of 71-800. the correlation between P wave axis and the duration of the disease was found to be statistically significant. the correlation between P wave axis and the severity of the disease was found to be statistically significant, 8/27 patients (29.63%) with less than one year of disease had features of corpulmonale.
Conclusions: P-axis verticalization can serve as a very effective electrocardiographic screening tool for emphysema in the general population.
ventricle leading to the development of pulmonary hypertension, cor Pulmonale, and right ventricular dysfunction and in some cases left ventricular dysfunction as well.3
Vertical P wave axis is commonly seen in patients with COPD. This may be due to the fact that side of the right atrium has tight connection with diaphragm near the site where inferior vena cava is seen.4 In COPD, there is
increased flattening of the diaphragm. This leads to the inferior displacement of the right atrium.5
Thus, it can be said that COPD can affect the heart as secondary effects of the disease. The electrocardiography has been seen as a very best tool for early diagnosis of any cardiac changes that may occur as a result of secondary effects of the chronic obstructive pulmonary disease. The various electrocardiographic manifestation of emphysema is as below.6,7 In leads I, II, III there is
tenting of P waves. Inversion of P wave is seen in VLP axis. In leads II, III, aVF there is increase in the amplitude of the T wave. QRS complex tends to deviate to right axis. The pre-cordial leads rotate clockwise. In lead I QRS is of low voltage. In lead III, the P wave has increased tenting. In leads V1 and V2, QRS amplitude indicates respiratory variation. In lead III, the respiratory variation of the QRS complex is not much more marked. Certain ECG changes that strongly indicate the presence of emphysema are more than 110° deviation of the right axis, there is also marked deviation of the left axis when it is expected that there will be right axis deviation, in leads I, II, III, V5, V6, the S wave is very wide.
This study was undertaken to study the P wave axis in electrocardiographs and its changes in COPD patients with different grades of severity of the disease (according to GOLD guidelines), as assessed through pulmonary function testing.
METHODS
Here, 30 Patients of COPD confirmed by clinical history, examination and Pulmonary function tests were included in the study done at Mediciti Institute of Medical Sciences from Nov 2012 to June 2014.
Inclusion criteria
• Clinically suspected cases of COPD as per the guidelines laid down by GOLD and confirmed by spirometry.
• FEV1/FVC ratio less than 0.7 after giving the bronchodilator.
Exclusion criteria
• Patients having chronic lung disease which is other than COPD.
• Known cases of congenital or acquired heart disease.
• Not willing to participate in the present study.
Institutional Ethics Committee permission was taken before the actual data collection was started. Informed written consent was taken from all study participates who were willing to participate in the present study. A predesigned, pretested, semi structured study questionnaire was prepared for the present study.
Data was collected from patients both IP and OP with signs and symptoms of COPD as mentioned above. These patients were clinically examined, and they underwent routine investigations like hemogram, urine examination, blood urea, serum creatinine, chest x-ray, random blood sugar, sputum examination and ABG analysis.
These patients underwent pulmonary function test, ECG and ECHO.
Statistical analysis
The data thus obtained was statistically analyzed using SPSS version 12.0.
RESULTS
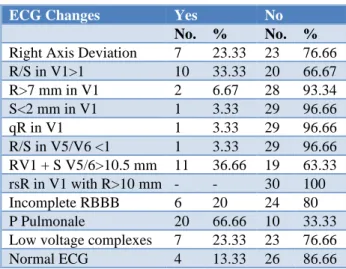
Table 1 shows ECG changes among the study subjects. 36.66% of patients had RVH. Incomplete RBBB was seen in 20%. 13.33% had normal ECG. Right axis deviation was seen in seven patients. R/S in V1>1 was seen in ten patients. R>7 mm in V1 was seen in two patients. S<2 mm in V1 was seen in one patient. qR in V1 was also seen in one patient. R/S in V5/V6 <1 was seen in one patient. RV1 + S V5/6>10.5 mm was seen in 11 patients. rsR in V1 with R>10 mm was not seen in any patients. Incomplete RBBB was seen in six patients. P Pulmonale was seen in twenty patients. Low voltage complexes were seen in seven patients. Normal ECG was seen in only four patients.
Table 1: ECG changes among the study subjects.
ECG Changes Yes No
No. % No. %
Table 2 shows correlation of ECG with duration of disease. Most common finding in patients with less than one year of exposure was RVH. Low voltage complex was seen in six patients. Incomplete RBBB was seen in six patients. RAD was seen in six patients. R/S V1>1 was seen in ten patients. R V1>7 was seen in two patients. S V1<2 was seen in one patient. qR V1 was seen in one patient. R/S V6<1 was seen in one patient. RV1+SV5/V6>10.5 was seen in eleven patients. rsR V1 WITH R>10 was not seen in any patients.
Table 3 shows correlation of ECG with severity of the Disease. Low voltage complexes and R/S ratio in V1>1
were the only ECG changes with significant correlation with severity of the disease. (p<0.05), 2 patients with mild, 4 patients with moderate and 1 patient with sever disease have shown Low voltage complex. 1 patient with mild, two patients with moderate and three patients with severe disease have shown incomplete RBBB. RAD was seen in four patients with moderate and two patients with severe disease. R/S V1>1 was seen in one patient with moderate, seven patients with severe and two patients with very severe disease. RV1+SV5/V6>10.5 was seen in two patients with mild, two patients with moderate, five patients with severe and two patients with very severe disease.
Table 2: Correlation of ECG with duration of disease.
ECG Findings < 1 Year (n=27) 1-5 Years (n=2) >5 years (n=1) R p
No. % No. % No. %
Low voltage complex 6 22.2 1 50 0 0 0.012 >0.05 Incomplete RBBB 6 22.22 0 0 0 0 -0.156 >0.05
RAD 6 25.92 0 0 0 0 -0.156 >0.05
R/S V1>1 10 37.03 0 0 0 0 -0.221 >0.05
R V1>7 2 7.41 0 0 0 0 -0.83 >0.05
S V1<2 1 3.71 0 0 0 0 -0.058 >0.05
qR V1 1 3.71 0 0 0 0 -0.058 >0.05
R/S V6<1 1 3.71 0 0 0 0 -0.058 >0.05
RV1+SV5/V6>10.5 11 40.74 0 0 0 0 -0.238 >0.05
rsR V1 WITH R>10 0 0 0 0 0 0
Table 3: Correlation of ECG with severity of the disease.
ECG findings Mild Moderate Severe Very severe R p
No. % No. % No. % No. %
Low voltage complex 2 50 4 33.33 1 8.34 0 0 -0.374 <0.05 Incomplete RBBB 1 25 2 16.66 3 25 0 0 -0.42 >0.05
RAD 0 0 4 33.33 2 16.67 0 0 -0.42 >0.05
R/S V1>1 0 0 1 8.34 7 58.34 2 100 0.619 <0.05 R V1>7 0 0 1 8.34 1 8.34 0 0 0.033 >0.05 S V1<2 0 0 1 8.34 0 0 0.139 >0.05
qR V1 0 0 1 8.34 0 0 0 0 -0.093 >0.05
R/S V6<1 0 0 0 0 1 8.34 0 0 0.139 >0.05 RV1+SV5/V6>10.5 2 50 2 16.66 5 41.67 2 100 0.225 >0.05
rsR V1 WITH R>10 0 0 0 0 0 0 0 0
Table 4: P wave axis pattern in patients with COPD.
P wave axis No. of cases Percentage (%)
<60º 8 26.7
61-70º 6 20.0
71-80º 9 30.0
81-90º 7 23.3
Total 30 100
Table 4 shows P wave axis pattern in patients with COPD. Maximum no. of patients had a P wave axis of 71- 800. Eight patients had P wave axis of less than sixty degrees. Six patients had P wave axis of 61-70 degrees. Nine patients had P wave axis of 71-80 degrees. Seven patients had P wave axis of 81-90 degrees.
duration of the disease was found to be statistically significant. Of the eight patients with P wave axis of less than sixty degrees all eight had duration of the disease for less than one year. Of the six patients with P wave axis of 61-70 degrees all six had duration of the disease for <1
year. Of the nine patients with P wave axis of 71-80 degrees all had duration of the disease for <1 year. Of the 7 patients with P wave axis of 81-90 degrees, 4 had duration of the disease for <1 year, 2 had 1-5 years and one had >5 years.
Table 5: Correlation of P Wave axis with duration of disease.
P wave axis <1 Year (n=27) 1-5 Years (n=2) >5 Years (n=1) Total
No. % No. % No. % No. %
<60 8 29.6 - - - - 8 26.7
61-70 6 22.22 - -- - -- 6 20.0
71-80 9 33.3 - - - - 9 30.0
81-90 4 14.8 2 100 1 100 7 23.3
R=0.419, p=0.021, statistically significant correlation
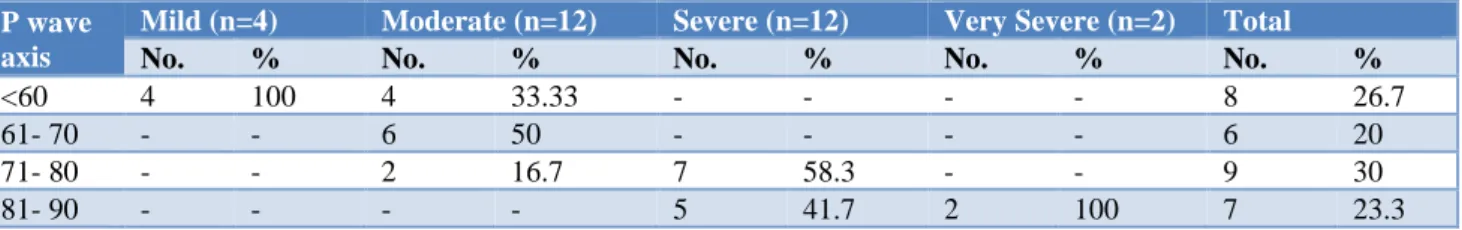
Table 6: Correlation of p wave axis with severity of the disease.
P wave axis
Mild (n=4) Moderate (n=12) Severe (n=12) Very Severe (n=2) Total
No. % No. % No. % No. % No. %
<60 4 100 4 33.33 - - - - 8 26.7
61- 70 - - 6 50 - - - - 6 20
71- 80 - - 2 16.7 7 58.3 - - 9 30
81- 90 - - - - 5 41.7 2 100 7 23.3
R = 0.875, p<0.001, statistically significant correlation
Table 7: Correlation of ECHO changes with duration of disease.
Echo Findings < 1 Year (n=27) 1-5 Years (n=2) >5 Years (n=1) r p
No. % No. % No. %
RA dilatation 8 29.63 0 0 0 0 -0.188 >0.05
RV dilatation 7 25.9 0 0 0 0 -0.172 >0.05
RV hypertrophy 11 7.41 0 0 0 0 -0.238 >0.05
RV failure 2 7.4 0 0 0 0 -0.083 >0.05
PAH 10 37 0 0 0 0 -0.221 >0.05
Table 8: Correlation of ECHO with severity of disease.
Echo Findings Mild (n=4) Moderate (n=12) Severe (n=12) Very Severe (n=2) r p
No. % No. % No. % No. %
RA dilatation 1 25 3 25 4 33.3 0 0 -0.019 >0.05 RV dilatation 1 25 2 16.7 4 33.3 0 0 0.02 >0.05 RV hypertrophy 0 0 2 16.7 7 58.3 2 100 0.571 <0.05
RV failure 0 0 0 0 1 8.3 1 50 0.367 <0.05
PAH 1 25 3 25 4 33.3 2 100 0.265 >0.05
Table 6 shows correlation of p wave axis with severity of the Disease. the correlation between P wave axis and the severity of the disease was found to be statistically significant. Out of 8 patients with P wave axis of <60 degrees, four had mild disease, four had moderate disease. Out of 6 patients with P wave axis of 61-70 degrees all six had moderate disease. out of nine patients with P wave axis of 71-80 degrees two had moderate
disease, seven had severe disease. out of 7 patients with P wave axis of 81-90 digress, five had severe disease and two had very severe disease.
duration of the disease of <1 year, RV hypertrophy was seen in eleven patients with duration of the disease of <1 year, RV failure was seen in two patients with duration of the disease of <1 year. ECHO charges of any kind were not seen in any patient with duration of the disease of 1-5 years and more than five years.
Table 8 shows correlation of ECHO with severity of disease. out of 8 patients with RA dilatation 1 had mild disease, three had moderate disease, and four had severe disease. out of 7 patients with RV dilatation, one had mild, two had moderate and four had sever disease. out of 11 patients with RV hypertrophy, 2 had moderate, 7 had severe and one had very severe disease. out of two patients with RV failure, one had severe and one had very severe disease.
DISCUSSION
Authors found that 16.66% if the cases had deviation of the right axis. Incomplete RBBB was seen in 20% of the cases and 56.66% of the cases shown the P pulmonale. Rachaiah NM et al, have shown the similar results. It was found by the author that 42% of the cases had deviation of the right axis, 4% had RBBB and 42% had P pulmonale.8
Authors observed that 56.66% of the cases had peaked P wave >2.5 mm. Agarwal RL et al, found that same in less proportion of the cases i.e. 35.7%.9 Spodicks DH et al,
reported still less proportion i.e. 13.9% of the cases.10
Authors noted that 23.33% of the cases had QRS complex of low voltage. Agarwal RL et al, found that no cases had such finding in their study.9 Authors found that
8.33% of the cases having severe disease recorded the low voltage complex which was very low when compared to 29% as reported by Holtzman D et al.11 In
this study, 13.33% of the cases had normal ECG which is lower than 35% as reported by Agarwal RL et al.9
In this study, P wave axis has demonstrated statistically significant negative correlations with forced expiratory volume 1, forced expiratory flow, FEV1/FVC ratio. P wave axis has also had significant positive correlations with stages of COPD, which means that the P wave axis increases with increasing stages of COPD. Authors observed that mean P wave axis was 72.43 degrees which was comparable to 69.7 degrees as reported by Chhabra L et al.12
Authors noted that a greater number of emphysema patients had severe form of COPD and the P axis was more than 70 degrees. Chhabra L et al, also reported similar findings.12
In COPD there is hyperinflation of lungs which leads to P wave axis frontal deviation. Authors noted that this criterion is useful as a screening tool. It has been noted that more the FEV1 less the P wave verticalization
degree. Changes in the lungs due to emphysema are correlated with the degree of P-wave verticalization. Echocardiography may not be readily used in the day to day clinical practice. Severity of COPD may be underestimated by cardiologist due to tricuspid regurgitation absence and hypertrophy of the right ventricle. Transthoracic echocardiography may also not be of much use. Air trapping may lead to inappropriate findings of the echocardiography. Thus, ECG has been considered as a good screening tool for the severity of the COPD.13-15
Authors observed that 26.67% of the cases had RA dilatation, RV dilatation was seen in 23.34% of the cases. Gupta NK et al, found that 17.5% of their cases had cor pulmonale.3 Himelmann RB et al, found that 75% of their
cases had cor pulmonale.16
Authors noted that half of cases had normal 2D ECHO and this finding has been found to be similar to the finding by Gupta NK et al.3
CONCLUSION
P-axis verticalization can serve as a very effective electrocardiographic screening tool for emphysema in the general population. In fact, this quick bedside screening modality is inexpensive, and at the same time highly sensitive and specific. However, verticalization of P wave axis in ECG is a simple bedside test, hence it must be routinely included in the workup for evaluation of COPD patients.
Funding: No funding sources Conflict of interest: None declared
Ethical approval: The study was approved by the Institutional Ethics Committee
REFERENCES
1. Global Initiative for Chronic Obstructive Lung Disease - Global Strategy for Diagnosis, Management, and Prevention of Chronic Obstructive Pulmonary disease. Available at: http.//www.goldcopd.com. Accessed 27 November 2013.
2. Murray CJ, Lopez AD. Evidence based health policy-lessons from global burden of disease study. Sci. 1996;274:740-3.
3. Gupta NK, Agarwal RK, Srivastav AB, Ved ML. Echocardiographic evaluation of heart in chronic obstructive pulmonary disease patient and its correlation with severity of disease. Lung Ind. 2011:105-9.
5. Thomas AJ, Aplyasawat S, Spodick DH. Electrocardiographic detection of emphysema. Am J Cardiol. 2011;107:1090-2.
6. Weitzenblum E. Chronic Cor Pulmonale. Heart. 2003;89:225-30.
7. Phillips JH, Burch GE. Problems in the diagnosis of cor pulmonale. Am Heart J. 1963;6(6):818-32. 8. Rachaiah NM, Rachaiah JM, Krishnaswamy RB. A
correlative study of spirometric parameters and ECG changes in patients with chronic obstructive pulmonary disease. Int J Biol Med Res. 2012;3(1):1322-6.
9. Agarwal RL, Kumar D, Gurpreet, Agarwal DK, Chabra GS. Diagnostic values of electrocardiogram in chronic obstructive pulmonary disease. Lung Ind. 2008:78-81.
10. Spodick DH, Hauger - Kelvene JH, Tyler JM, Muesch H, Dorr CA. The electrocardiogram in pulmonary emphysema. Relationship of characteristic electrocardiographic findings to severity of disease as measured by degree of airway obstruction. Am Rev Resp Dis. 1963;88:14.
11. Holtzman D, Aronow WS, Mellana WM, Sharma M, Mehta N, Lim J, et al. Electrocardiographic abnormalities in patients with severe versus mild or moderate chronic obstructive pulmonary disease followed in an academic outpatient pulmonary clinic. Annal Non-invasi Electr Cardiol. 2011;16(1):30-2.
12. Chhabra L, Sareen P, Perli D, Srinivasan I, Spodick DH. Vertical P-wave axis: the electrocardiographic synonym for pulmonary emphysema and its severity. Ind Heart J. 2012 Jan-Feb;64(1):40-2. 13. Boussuges A, Pinet C, Molenat F, Burnet H,
Ambrosi P, Badier M, et al. Left atrial and ventricular filling in chronic obstructive pulmonary disease. An echocardiographic and Doppler study. Am J Respir Crit Care Med. 2000;162:670-5. 14. Hawkins NM, Petrie MC, Jhund PS, Chalmers GW,
Dunn FG, McMurray JJV. Heart failure and chronic obstructive pulmonary disease: diagnostic pitfalls and epidemiology. Eur J Heart Fail. 2009;11:130-9. 15. Ikeda K, Kubota I, Takahashi K, Yasui S. P wave
changes in obstructive and restrictive lung diseases. J. Electrocardiol. 1985;18:233-8.
16. Himelmann RB, Struve SN, Brown JK, Namnum P, Schiller NB. Improved recognition of cor pulmonale in patients with severe chronic obstructive pulmonary disease. Am J Med. 1988;84:891-8.