Sairung Nuanin, B.Sc. (Med Tech)*, Panutsaya Tientadakul, M.D.*, Kanit Reesukumal, M.D.*, Sudarat Piyophirapong, M.D.*, Gerald J. Kost, M.D., Ph.D.**, Busadee Pratumvinit, M.D.*
*Department of Clinical Pathology, Faculty of Medicine Siriraj Hospital, Mahidol University, Bangkok, Thailand, **Point-of-Care Testing Center for Teaching and Research (POCT.CTR™), School of Medicine, University of California - Davis, Sacramento, California, USA.
Autoverification Improved Process Efficiency,
Reduced Staff Workload, and Enhanced Staff
Satisfaction Using a Critical Path for Result Validation
ABSTRACT
Objective: Continuous process improvements enhance accuracy and productivity in a clinical laboratory setting.
This study aimed to investigate the accuracy and efficiency of a new autoverification (AV) system designed to improve the consistency and uniformity of reported laboratory test results.
Methods: Limit checks, delta checks, and consistency checks were established, and then retrospective data from
500 requested tests were used to evaluate the accuracy of AV rules compared to manual verification, which was performed by five experienced medical technologists. Efficiency was evaluated by comparing turnaround time (TAT), error rates, workload, and staff satisfaction between before and after AV implementation.
Results: AV had 100% sensitivity, 77.6% specificity, and a 22% false-positive rate. The AV passing rate was 95%,
85%, 42%, and 39% for chemistry, coagulation, microscopy, and hematology, respectively. The overall passing rate was 65%. After implementation, the mean overall TAT decreased from 54.2±26.6 to 52.4±24.2 min (p<0.001). However, TAT during peak hours increased (p<0.05). Incident reports decreased 8-fold (p<0.05), net workload decreased by 0.76 full-time equivalent, and overall staff satisfaction increased (p<0.001).
Conclusion: Our laboratory’s new AV system demonstrated an overall passing rate of 65% with decreases in TAT,
incident reports, and workload, and an increase in staff satisfaction.
Keywords: Autoverification; critical path; delta check; full-time equivalent; laboratory information system; turnaround
time (Siriraj Med J 2020; 72: 296-306)
Corresponding author: Busadee Pratumvinit E-mail: [email protected]
Received 23 March 2020 Revised 26 May 2020 Accepted 28 May 2020 ORCID ID: http://orcid.org/0000-0002-5220-0552
http://dx.doi.org/10.33192/Smj.2020.40 INTRODUCTION
Autoverification (AV) uses predetermined rules to direct the release of laboratory results, and verifies results by computer without staff review.1,2 Previous
studies reported that AV improved turnaround time (TAT)3-7, reduced manpower requirements4, 5, decreased
error rates7, and enhanced physician satisfaction.3 AV
algorithms usually include instrument status flag, quality control (QC) checks, interference indices (hemolysis,
icterus, lipemia), critical values, limit checks, delta checks, and consistency checks to filter unusual data.8-10
According to Clinical and Laboratory Standards Institute (CLSI) guideline1, the criteria included in AV
or manual steps, including manual review of the results.1
Previous studies described the use of AV in some sections or specific test groups of laboratories, including clinical chemistry2,7,8,11-13, arterial blood gas14, thyroid function4,6, sex
hormones4, hepatitis B serological markers15, urinalysis7,16,
hematology17-20, and coagulation.18, 21-24
Our laboratory experiences a 3-9% annual increase in testing volume each year; however, the number of personnel that perform manual result verification has not increased. In response and in order to improve operational efficiency, we designed and implemented the AV system profiled in this report to improve TAT, improve the consistency of result verification, and to reduce the workload of staff in our laboratory. Here, we present a detailed description of the implementation of AV in clinical chemistry, microscopy, hematology, and coagulation. This study is the first to describe the implementation of an AV system that simultaneously incorporates multiple disciplines using a critical path concept.25,26 This study aimed to investigate the accuracy
of the AV rules, and the efficiency of a new AV system designed to improve the consistency and uniformity of reported laboratory test results. We evaluated the AV passing rate, and determined the impact of the AV system on laboratory personnel. We also compared TAT, requisition sheets per hour, laboratory staff survey, and error rates between before and after the implementation of the AV system.
MATERIALS AND METHODS
Setting and ethics
This study was conducted at the central laboratory of Siriraj Hospital, which is a 2,300-bed national tertiary referral center located in Bangkok, Thailand. This laboratory provides clinical chemistry, microscopy, hematology, and coagulation testing for both outpatient and inpatient services. Our laboratory performs approximately 6 million tests per year using a cobas 8000 (Roche Diagnostics, Mannheim, Germany) for clinical chemistry, a UX-2000 (Sysmex Corporation, Kobe, Japan) for urinalysis, an XN-3000 (Sysmex Corporation) for hematology, and the CA-1500 & CS-2100i systems (Sysmex Corporation) for coagulation analysis. The HCLAB system (Sysmex Corporation) is the laboratory information system (LIS) used in our laboratory. The protocol for this study was approved by the Siriraj Institutional Review Board of the Faculty of Medicine Siriraj Hospital, Mahidol University (Si 331/2015 EC2).
Study design
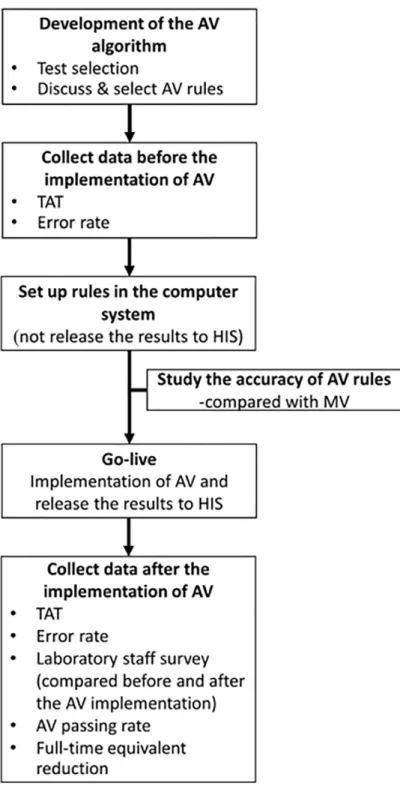
Fig 1 shows the study protocol for the design and
implementation of our AV system. First, we defined the scope of the AV system, including selection of team members, tests, and tools. The tool used in this study was our laboratory information system (LIS). We then collected the information needed to set the AV rules, after which the rules were decided by consensus among the study team members. Next, we collected efficiency data before implementation of AV, and set up rules in the computer system. The accuracy of the AV rules was assessed before implementation into clinical service. After implementation, we collected efficiency data, surveyed laboratory staff, and calculated AV passing rate and full-time equivalent reduction (FTE).
Test selection
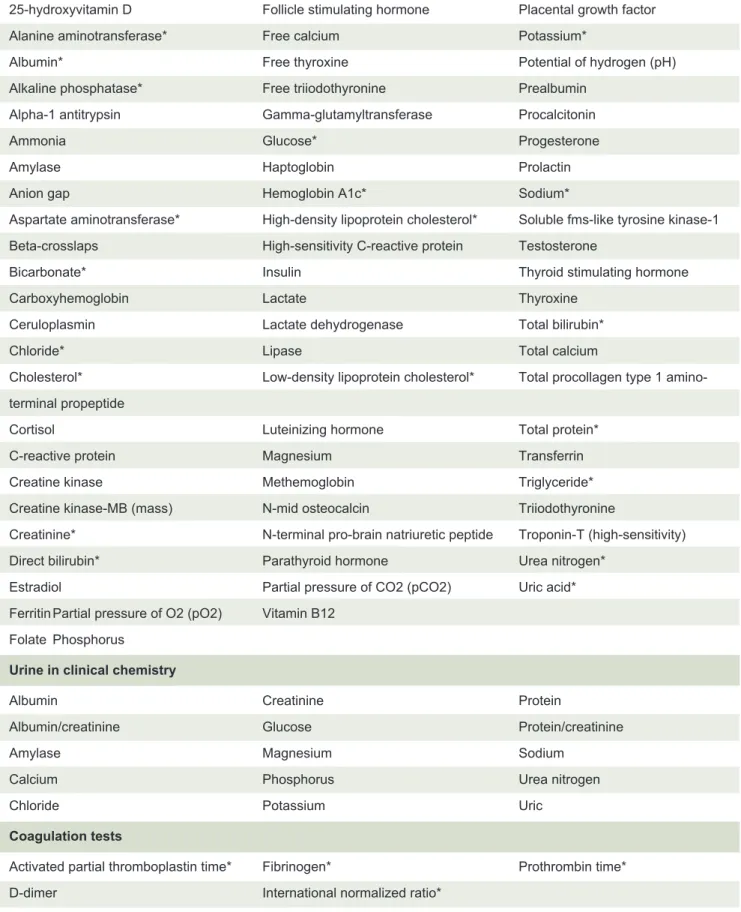
We selected tests that are performed on automated analytical systems and that are released automatically via the LIS, including 86 parameters in clinical chemistry (71 plasma/serum/blood parameters, and 15 urine parameters, 1 test in microscopy (urinalysis), 2 tests in hematology (complete blood count [CBC], and automated hematocrit [Hct]), and 5 tests in coagulation (Table 1).
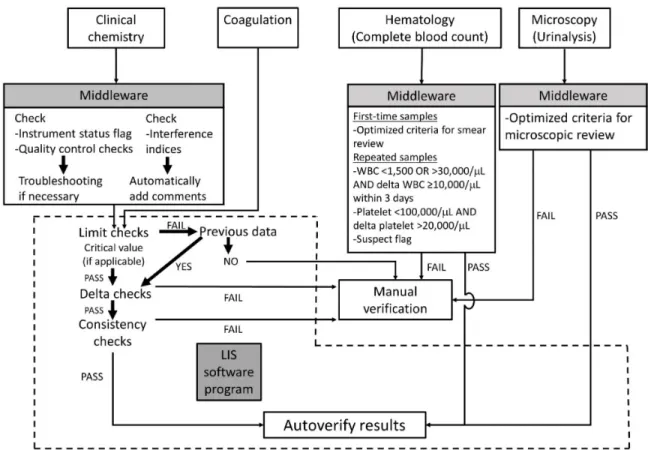
Development of the autoverification algorithm Fig 2 shows the multicomponent critical path for autoverification. The algorithm for the clinical chemistry and coagulation tests was developed according to the CLSI AUTO10-A guideline.1 For clinical chemistry, the
cobas® 8000 Data Manager was used to check instrument status flags, quality control (QC) results, and interference indices. If there were instrument flags or tests that failed QC, the test results would not be released. If interference indices exceeded the threshold for respective tests, the results would be released with comments to the LIS. For coagulation, the results would be released directly to the LIS.
After entering the AV system, the order of verification was limit checks, delta checks, and consistency checks. If the analytes had critical values, the critical values were used as their limit checks. If the results failed the limit checks, the delta checks were used. Delta checks compared the current data with previous data from the same patient to determine the differences. If the differences were within the range of delta check acceptability, consistency checks were followed. If the test results passed all of the above checks, they were reported by the AV system. If the test results failed any of the above checks, they were reported by manual verification (MV).
Fig 1. Flow diagram describing the study protocol for the design and implementation of the autoverification system (AV). Abbreviations: AV, autoverification; HIS, hospital information system; MV, manual verification; TAT, turnaround time
Development of AV rules
Hematology tests
For complete blood count analysis, the first time test results were held in the presence of hemoglobin <7 or >19 g/dL, mean corpuscular volume <70 or >110 fL, red cell distribution width >22%, white blood cell (WBC) <1,500 or >30,000/μL, platelet <100,000/μL or >600,000/μL, no differential of WBC, absolute neutrophil counts <500/μL or >25,000/μL, absolute lymphocyte counts >7,000/μL,
absolute monocyte counts >3,000/μL, absolute eosinophil counts >2,000/μL, absolute basophil counts >500/μL, absolute reticulocyte count >250/μL, or suspect flags.27
Plasma/serum/blood in clinical chemistry
25-hydroxyvitamin D Follicle stimulating hormone Placental growth factor Alanine aminotransferase* Free calcium Potassium*
Albumin* Free thyroxine Potential of hydrogen (pH)
Alkaline phosphatase* Free triiodothyronine Prealbumin Alpha-1 antitrypsin Gamma-glutamyltransferase Procalcitonin Ammonia Glucose* Progesterone
Amylase Haptoglobin Prolactin
Anion gap Hemoglobin A1c* Sodium*
Aspartate aminotransferase* High-density lipoprotein cholesterol* Soluble fms-like tyrosine kinase-1 Beta-crosslaps High-sensitivity C-reactive protein Testosterone
Bicarbonate* Insulin Thyroid stimulating hormone
Carboxyhemoglobin Lactate Thyroxine
Ceruloplasmin Lactate dehydrogenase Total bilirubin*
Chloride* Lipase Total calcium
Cholesterol* Low-density lipoprotein cholesterol* Total procollagen type 1 amino-terminal propeptide
Cortisol Luteinizing hormone Total protein*
C-reactive protein Magnesium Transferrin
Creatine kinase Methemoglobin Triglyceride*
Creatine kinase-MB (mass) N-mid osteocalcin Triiodothyronine
Creatinine* N-terminal pro-brain natriuretic peptide Troponin-T (high-sensitivity) Direct bilirubin* Parathyroid hormone Urea nitrogen*
Estradiol Partial pressure of CO2 (pCO2) Uric acid* Ferritin Partial pressure of O2 (pO2) Vitamin B12
Folate Phosphorus
Urine in clinical chemistry
Albumin Creatinine Protein
Albumin/creatinine Glucose Protein/creatinine
Amylase Magnesium Sodium
Calcium Phosphorus Urea nitrogen
Chloride Potassium Uric
Coagulation tests
Activated partial thromboplastin time* Fibrinogen* Prothrombin time* D-dimer International normalized ratio*
TABLE 1. List of tests in the autoverification system for clinical chemistry and coagulation.
Microscopy tests
For urinalysis, the results were held in the presence of red blood cells (RBC) >28.1/μL with negative blood tests from chemical strip, RBC 17-59/μL with positive blood tests, RBC >300/μL regardless the blood test results, WBC 50-120/μL, epithelial cells 56-120/μL, small round cells >10/μL, hyaline casts >3/μL, pathological casts >1.5/ μL, crystals >10/μL, yeast like cells, sperms >3/μL, or flags.
Clinical chemistry and coagulation tests
The AV rules used in clinical chemistry and coagulation tests included limit checks, delta checks, and consistency checks. All D-dimer results were released by autoverification. The methods for developing the AV rules were, as follows:
1. Limit checks
Limit checks were developed using different methods, as follows:
1.1 Critical values
Critical values are potentially life-threatening laboratory results that require immediate medical attention. The critical values were derived from the
literature29,30 and discussed with clinicians. The analytes
for which critical values were used as a limit check were free calcium, glucose, pCO2, pO2, potassium, pH, sodium, and troponin-T (high-sensitivity).
1.2 Other sources
We used different sources to employ limit checks. Limit checks were derived from a distribution interval of patient data between the 2.5th and 97.5th percentiles (modified from a previous study)12, a near-midpoint
between the median reference range value and the analyzer’s linear analytical measurement limits7, and the analytical
measurement limits. 2. Delta checks
Delta check can be used to identify cases of patient specimen misidentification, specimen integrity issues, and analytical issues.31 Our laboratory used this formula
to calculate delta check:
Delta check (%) = [(current result-previous result)/ previous result] *100
The acceptability limit of delta checks in this study was obtained from:
2.1 Reference change value (RCV)
indicate a significant difference between two sequential results. The simplified formula for RCV calculation includes variations associated with analytical variation and intra-individual biological variation, as follows:
Reference change value (RCV) = 21/2*Z*(CV
A2+CVI2)1/2 (Z = Z score, CVA = analytical variation, CVI = intra-individual biological variation). In this study, a bidirectional Z-score was used (1.96 for a 95% probability), CVA was derived from analytical variation during a 1-month period in our laboratory, and CVI was obtained from the literature.32
2.2 Other sources
We applied delta checks from previous autoverification study2, textbook30, and delta check rules
from another institute (Swedish Covenant Hospital, courtesy of Susan Dawson). The duration of delta checks was 120 days.
3. Consistency checks
The consistency checks were, as follows: (a) If triglyceride was above 800 mg/dL (9 mmol/L) and sodium was simultaneously requested, results would be held. Sodium would be analyzed by direct ISE method instead of indirect ISE method; (b) Direct bilirubin was more than total bilirubin; (c) Albumin was more than total protein; (d) T3 or FT3 or T4 or FT4 was more than the upper limit check for each test, but TSH was not less than the lower limit of the reference interval; and, (e) T3 or FT3 or T4 or FT4 was less than the lower limit check for each test, but TSH was not more than the upper limit of the reference interval.
Implementation
Initially, limit checks, delta checks, and consistency checks were applied to 24 candidate tests to test the system and detect errors in AV settings (Table 1). We then applied them to clinical chemistry and coagulation tests without releasing the results to physicians. Results that passed all AV rules would be labelled as auto-released, and then they were subjected to MV before delivery to clinicians. Results were checked retrospectively to detect discrepancies and errors using simulation program. When no errors occurred, we started to release the results to clinicians without MV.
Accuracy of the AV rules
Before implementing AV into clinical service, we validated the accuracy of AV rules and algorithms by comparing 500 patient reports between AV using simulation and MV by 5 experienced medical technologists (MT). If the verification results were not in agreement with at least 4 of the 5 MT, the decision would be made by
consensus among 4 clinical pathologists. If AV rules were triggered and the results were held by MV, the report was graded as true-positive [TP]. If the report was released by both AV rules and MV, it was graded as true-negative [TN]. False-positive [FP] was defined as a report unvalidated by AV, but that was released by MV, and false-negative [FN] was graded as a report validated by AV, but that was held by MV.33 Accuracy
was defined as [TP + TN]*100/[all results].
Efficiency of the AV system
AV passing rates were obtained from each discipline and per requisition sheet using data from 24 h of 5 working days. Laboratory turnaround time (TAT) was defined as the time from specimen receipt to result reporting. We obtained laboratory TAT per hour for 20 days before and 20 days after implementation of the AV system. Error rates were gathered from non-conformities (NC), occurrence reports, and customer complaints during 1 month of each period.
A decrease in full-time equivalent (FTE) was calculated using the following formula: Decrease in FTE = (productive minutes/total work minutes) * the overall AV passing proportion per requisition sheet.
Productive minutes = MV time per day (minutes)* number of requisition sheets per day * 365 days.
MV time was obtained from the average time for MV in triplicate among 13 experienced MT. The total work minutes in our laboratory was calculated to be 96,600 minutes per year.
The questionnaire that we used in this study to determine laboratory staff satisfaction comprised 5 questions that were scored 1 to 10, as follows: (a) How would you describe your workload? (b) How much confidence do you have when reporting laboratory test results? (c) How many incident reports do you think the laboratory receives, either verbal communication or written document? (d) Describe your level of satisfaction with the speed with which laboratory results are reported. (e) What is your overall level of satisfaction with the laboratory reporting system?
Statistical analysis
verified results after the implementation of AV. Error rates were compared using Fisher’s exact test. Data from the survey of laboratory staff were compared using paired
t-test. Statistical analyses were performed using PASW Statistics version 18.0 (SPSS, Inc., Chicago, IL, USA). A
p-value of <0.05 was considered statistically significant.
RESULTS
Accuracy of autoverification rules
Using the data from a collection of 500 retrospective laboratory test requests, the TP rate was 76.4% (382/500), the TN rate was 1.6% (8/500), the FP rate was 22% (110/500), and the FN rate was 0% (0/500). The accuracy of AV rules was 78% (390/500), the diagnostic sensitivity was 100% (8/8), and the specificity was 77.6% (382/492).
Efficiency of the AV system 1. AV passing rate
To study the AV passing rate, 123,957 test results derived from 13,342 requisition sheets were collected from 5 working days. The highest AV passing rate was found in clinical chemistry at 95% (95% confidence interval [CI]: 94.9-95.1%), whereas the lowest AV passing rate was found in hematology at 39% (95% CI: 37.8-40.0, p<0.001). The AV passing rates in microscopy and coagulation were 42% (95% CI: 40.3-43.7) and 85% (95% CI: 83.7-86.2), respectively. The overall AV passing proportion per requisition sheet was 65% (95% CI: 64.2-65.8) (Fig 3).
2. Turnaround time (TAT)
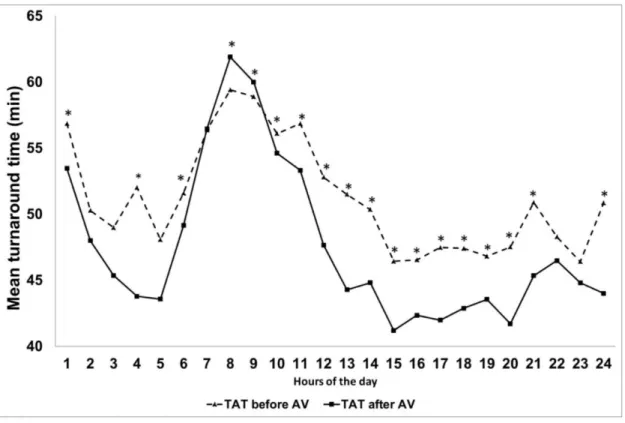
Mean ± standard deviation (SD) laboratory TAT was reduced by 1.8 minutes (54.2±26.6 vs. 52.4±24.2 minutes, p<0.001) between 20 days before (n=63,813) and 20 days after (n=68,947) implementation of the AV system. The mean TAT after implementation of AV was significantly lower than the mean TAT before AV implementation at the 1st (p=0.03), 4th (p=0.002), 6th (p<0.001), 10th (p=0.001), 11th-21st (p<0.001), and 24th (p=0.004) hours. In contrast, the mean TAT before implementation was significantly lower than the mean TAT after implementation of AV at the 8th (59.4 vs. 61.9 minutes, p<0.001) and 9th (58.9 vs. 60.0 minutes, p=0.004) hours (Fig 4). The total number of requisition sheets per hour from 20 days was not different between before and after implementation of the AV process (n=24 hours, median = 2,014 vs. 2,151 sheets, p=0.789).
3. Error rates
Before implementation of the AV system, errors were found in 7 test results of 848,377 tests per month (0.0008%). After the implementation of AV, errors were
detected in 1 of 870,511 tests per month (0.0001%) (p=0.037).
4. Impact of AV on laboratory staff
The average time for MV in triplicate by 13 MT was 6.98 seconds per 1 requisition sheet. The average number of requisition sheets per day (n=5 days, the same period we used to determine the AV passing rate) was 2,669 sheets/day. Therefore, the mean total time for MV was 310 minutes per day. The productive time (minutes) = 310 mins * 365 days. After the implementation of AV, the AV passing rate was 65%, which translates to a reduction of 0.76 FTE medical technician personnel needed for result verification.
5. Laboratory staff survey
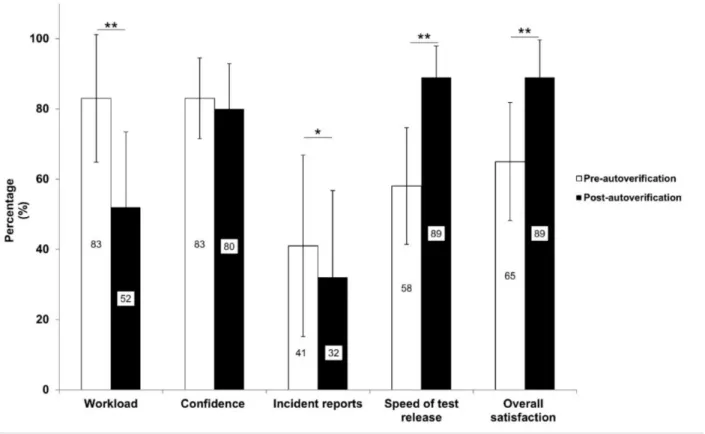
From the perspective of laboratory staff (n=43), mean±SD score for workload was reduced from 83±18% to 52±21% (p<0.001). The confidence to report laboratory results was not different between before and after AV implementation (p=0.234). From a staff point of view, incident reports decreased about 9% (p=0.045), and the speed of the reporting of results improved by 31% (p<0.001). Overall staff satisfaction increased from 65±17% to 89±11% after the implementation of AV (p<0.001) (Fig 5).
DISCUSSION
The accuracy of AV rules and algorithms was 78% when compared to MV. The FP rate was 22%, and the FN rate was 0%. The sensitivity and specificity were 100% and 77.6%, respectively. Fuentes-Arderiu, et al. compared the Validation Assistée aux Laboratoires d'Analyses Biologiques (VALAB) Expert System to MV by nine clinical biochemists among 500 clinical laboratory reports. They found the diagnostic sensitivity of the VALAB Expert System to be 100%, and the diagnostic specificity was 95.7%.11 Our study had lower specificity
because we used thresholds of limit checks at 2.5th and 97.5th percentile of cumulative patient data so about 5% of results would be held by AV. We plan to decrease false-positive alerts through adjusting thresholds, and by modifying non-specific rules.
Our overall passing rate, which included several disciplines in the critical path, was 65%. For clinical chemistry, the AV passing rate was 95% compared to 84.8% in the study by Fuentes-Arderiu, et al.11 Krasowski,
et al. reported an increase in the passing rate for clinical chemistry from 40% in 2000 using the rudimentary rules set in the LIS to 99% in 2010 after the implementation of sophisticated rules in middleware2. For microscopy, the
Fig 3. Autoverification (AV) passing rates (95% confidence interval). AV passing rates for chemistry, coagulation, microscopy, and hematology obtained from 5 working days (*p<0.05, **p<0.001).
Fig 5. Laboratory staff survey. Mean ± standard deviation percentage of survey items (n=43) compared between before and after the implementation of the autoverification system (*p<0.05, **p<0.001).
47.6% rate reported by Palmieri, et al.16 For hematology,
the passing rate in this study was 39%. Martinez-Niteo,
et al.17 found a passing rate of 53.4% in pilot study, with
a subsequent increase to 60% 18 months later – both of which were very high compared to our result. For coagulation, our passing rate was 85%, which is similar to the 82% result reported by Zhao, et al.21
Our study found that the overall TAT decreased from 54.2 to 52.4 minutes (3.3%) after the implementation of AV. However, the TAT during the peak hours (8th and 9th hours) was significantly increased. A possible explanation for this increase may be insufficient capacity of the computer server to manage the increased number of processing requests during the peak period. A previous study from a large, urban, tertiary acute care public hospital and trauma center showed that the TAT, calculated from time of specimen received to result released, was reduced by 22% (142 min vs. 112 min) after the implementation of AV.7 However, the baseline TAT in our laboratory was
about half of the baseline TAT in that study; therefore, the percent reduction might not be comparable.
The error rate in our study decreased from 0.0008% to 0.0001%. Previous study from John H. Stroger, Jr. Hospital of Cook County (JHSHCC) showed that error rates decreased from 0.06% to 0.009%.7 We found that
after implementation of AV, the number of laboratory staff needed for MV was reduced by 0.76 FTE. The study from JHSHCC found a much more dramatic reduction from 14 FTEs to 8.5 FTEs (a reduction of 40%) after implementation of AV.7 Our laboratory had a lower
reduction of FTE because criteria for manual review of complete blood count and urinalysis were already in place before the implementation of AV in all disciplines. After implementation of the AV system in our central laboratory, laboratory staff found the amount of workload and defects to be decreased, and the speed of test result reporting and overall satisfaction to be increased.
Although the AV system implemented at our center has many advantages, it also has some limitations. The software that our laboratory used to design our system was not specifically designed to build the rules and algorithms for the AV system. Software used to build AV rules and algorithms according to CLSI guideline should have the ability to use multiple data, to make changes to algorithms, and to provide an easy to use and flexible user interface that provides laboratory defined information in real time.1 In some contrast, we were limited in our
in the reporting of results. Lastly, our software does not currently have a feature that facilitates comparison of result verification time between AV and MV.
CONCLUSION
Our new AV system demonstrated high sensitivity for error detection. The overall AV passing proportion per requisition sheet was 65%. This passing rate is similar to previous studies in clinical chemistry, microscopy, and coagulation tests. TAT time improved after implementation of the AV system, except during peak hours (8th and 9th hours), and this was likely due to a high traffic-related CPU slowdown. Overall staff satisfaction increased, and incident reports and workload decreased after the implementation of AV.
AV has many advantages relative to the reporting of test results; however, MV is still necessary to verify results after they fail AV. The improved efficiency of AV allows staff to spend more time on result verification. We will continue to evaluate rules to decrease false-positive alerts by modifying non-specific rules, and by addressing rules that triggered alerts that had no further action. If implemented broadly, this approach could enhance laboratory understanding and performance via successive critical path improvements.
ACKNOWLEDGMENTS
The authors gratefully acknowledge Sysmex (Thailand) Co., Ltd (especially Thitiyaporn Wanpiyarat), MED-ONE Co., Ltd. (especially Surasit Techakasiwattana), Roche Diagnostics (Thailand) Co., Ltd., and Chatri Lerdmanee of the Siriraj Information Technology Department for providing data and/or establishing rules and algorithms for our laboratory information system. We would also like to thank Sorawit Kinko and Tanita Thaweethamcharoen for assistance with the full-time equivalent analysis, and Miss Julaporn Pooliam for assistance with statistical analysis.
Authors’ contributions
All authors contributed sufficiently to this study to be included as an author. All authors have read and approved the final version of this manuscript, and all authors are in agreement with the decision to submit this manuscript for journal publication.
Funding disclosure
PT, KR, SP, and BP each received a Chalermprakiat Grant from the Faculty of Medicine Siriraj Hospital, Mahidol University, Bangkok, Thailand. The funding organization played no role in the study design; in the
collection, analysis, and interpretation of data; in the writing of the report; or, in the decision to submit this report for publication.
Conflict of interest declaration
All authors declare no personal or professional conflicts of interest, and no financial support from the companies that produce and/or distribute the drugs, devices, or materials described in this report.
REFERENCES
1. CLSI. Autoverification of Clinical Laboratory Test Results: Approved Guideline.AUTO10-A. Wayne: Pennsylvania, USA, 2006.
2. Krasowski MD, Davis SR, Drees D, Morris C, Kulhavy J, Crone C, et al. Autoverification in a core clinical chemistry laboratory at an academic medical center. J Pathol Inform 2014;5:13.
3. Fernandez-Grande E, Valera-Rodriguez C, Saenz-Mateos L, Sastre-Gomez A, Garcia-Chico P, Palomino-Munoz TJ. Impact of reference change value (RCV) based autoverification on turnaround time and physician satisfaction. Biochem Medica 2017;27:342-9.
4. Li J, Cheng B, Ouyang H, Xiao T, Hu J, Cai Y. Designing and evaluating autoverification rules for thyroid function profiles and sex hormone tests. Ann Clin Biochem 2018;55:254-63.
5. Xia LY, Cheng XQ, Liu Q, Liu L, Qin XZ, Zhang L, et al. Developing and application of an autoverification system for clinical chemistry and immunology test results. Zhonghua Yi Xue Za Zhi 2017;97:616-21.
6. Sediq AM-E, Abdel-Azeez AGH. Designing an autoverification system in Zagazig University Hospitals Laboratories: preliminary evaluation on thyroid function profile. Ann Saudi Med 2014; 34:427-32.
7. Torke N, Boral L, Nguyen T, Perri A, Chakrin A. Process improvement and operational efficiency through test result autoverification. Clin Chem 2005;51:2406-8.
8. Randell EW, Short G, Lee N, Beresford A, Spencer M, Kennell M, et al. Autoverification process improvement by Six Sigma approach: Clinical chemistry & mmunoassay. Clin Biochem 2018;55:42-48.
9. Jones JB. A strategic informatics approach to autoverification. Clin Lab Med 2013;33:161-81.
10. Randell EW, Yenice S, Khine Wamono AA, Orth M. Autoverification of test results in the core clinical laboratory. Clin Biochem 2019;73:11-25.
11. Fuentes-Arderiu X, Castineiras-Lacambra MJ, Panadero-Garcia MT. Evaluation of the VALAB expert system. Eur J Clin Chem Clin Biochem 1997;35:711-4.
12. Shih MC, Chang HM, Tien N, Hsiao CT, Peng CT. Building and validating an autoverification system in the clinical chemistry laboratory. Lab Med 2011;42:668-73.
13. Yan C, Zhang Y, Li J, Gao J, Cui C, Zhang C, et al. Establishing and validating of an laboratory information system-based auto- verification system for biochemical test results in cancer patients. J Clin Lab Anal 2019;33:e22877.
Technol 2018;23:631-40.
15. Li J, Cheng B, Yang L, Zhao Y, Pan M, Zheng G, et al. Development and implementation of autoverification rules for ELISA results of HBV serological markers. J Lab Autom 2016;21:642-51.
16. Palmieri R, Falbo R, Cappellini F, Soldi C, Limonta G, Brambilla P. The development of autoverification rules applied to urinalysis performed on the AutionMAX-SediMAX platform. Clin Chim Acta 2018;485:275-81.
17. Martinez-Nieto O, Lozano-Gaitán A, Beltrán-Diaz P, Mojica- Figueroa IL, Morales-Reyes OL, Isaza-Ruget MA. Autoverification of the automated blood cell counter(CBC) in a reference laboratory in Bogota, Colombia. J Bras Patol Med Lab 2015;51: 369-75.
18. Mlinaric A, Milos M, Coen Herak D, Fucek M, Rimac V, Zadro R, et al. Autovalidation and automation of the postanalytical phase of routine hematology and coagulation analyses in a university hospital laboratory. Clin Chem Lab Med 2018;56: 454-62.
19. Zhao X, Wang XF, Wang JB, Lu XJ, Zhao YW, Li CB, et al. Multicenter study of autoverification methods of hematology analysis. J Biol Regul Homeost Agents 2016;30:571-7.
20. Fu Q, Ye C, Han B, Zhan X, Chen K, Huang F, et al. Designing and Validating Autoverification Rules for Hematology Analysis in Sysmex XN-9000 Hematology System. Clin Lab 2020;66(4). doi: 10.7754/Clin.Lab.2019.190726.
21. Zhao Y, Yang L, Zheng G, Cai Y. Building and evaluating the autoverification of coagulation items in the laboratory information system. Clin Lab 2014;60:143-50.
22. Onelov L, Gustafsson E, Gronlund E, Andersson H, Hellberg G, Jarnberg I, et al. Autoverification of routine coagulation assays in a multi-center laboratory. Scand J Clin Lab Invest 2016;76: 500-2.
23. Riley P, Valcour A, Gallea B. Development and implementation of a coagulation factor testing method utilizing autoverification in a high volume clinical reference laboratory environment.
Res Pract Thromb Haemost 2017;1:543-4.
24. Wang Z, Peng C, Kang H, Fan X, Mu R, Zhou L, et al. Design and evaluation of a LIS-based autoverification system for coagulation assays in a core clinical laboratory. BMC Med Inform Decis Mak 2019;19:123.
25. Kost GJ. Application of Program Evaluation and Review Technic (PERT) to laboratory research and development planning. Am J Clin Pathol 1986;86:186-92.
26. Kost GJ. Theory of network planning for laboratory research and development. Am J Clin Pathol 1983;79:353-9.
27. Pratumvinit B, Wongkrajang P, Reesukumal K, Klinbua C, Niamjoy P. Validation and optimization of criteria for manual smear review following automated blood cell analysis in a large university hospital. Arch Pathol Lab Med 2013;137:408-14.
28. Khejonnit V, Pratumvinit B, Reesukumal K, Meepanya S, Pattanavin C, Wongkrajang P. Optimal criteria for microscopic review of urinalysis following use of automated urine analyzer. Clin Chim Acta 2015;439:1-4.
29. Kost GJ. Critical limits for urgent clinician notification at US medical centers. JAMA 1990;263:704-7.
30. Roberts WL, McMillin GA, Burtis CA. Reference information for the clinical laboratory. In: Burtis CA, Ashwood ER, Bruns DE, editors. Tietz textbook of clinical chemistry and molecular diagnostics. 5th ed. Missouri: Elsevier Saunders; 2012. p. 2131-
88.
31. CLSI. Use of Delta Checks in the Medical Laboratory.1st ed.
CLSI guideline EP33. 2016.
32. Ricos C, Alvarez V, Cava F, Garcia-Lario JV, Hernandez A, Jimenez CV, et al. Current databases on biological variation: pros, cons and progress. Scand J Clin Lab Invest 1999;59:491- 500.