Kennedy K. Ronoh
1, and George Kamucha
2, Thomas O. Olwal
3and
Tonny K Omwansa
11School of Computing and Informatics, University of Nairobi, Nairobi, Kenya
2Department of Electrical and Information Engineering, University of Nairobi, Nairobi, Kenya 3Department of Electrical Engineering, Tshwane University of Technology, Pretoria, South Africa
Improved Resource Allocation for
TV White Space Network Based on
Modified Firefly Algorithm
There is continued increased demand for dynamic spectrum access of TV White Spaces (TVWS) due to growing need for wireless broadband. Some of the use cases such as cellular (2G/3G/4G/5G) access to TVWS may have a high density of users that want to make use of TVWS. When there is a high density of secondary users (SUs) in a TVWS network, there is possibility of high interference among SUs that exceeds the de-sired threshold and also harmful interference to pri-mary users (PUs). Optimization of resource allocation (power and spectrum allocation) is therefore necessary so as to protect PUs against harmful interference and to reduce the level of interference among SUs. Exist-ing resource allocation optimization algorithms for a TVWS network ignore adjacent channel interference, interference among SUs or apply greedy algorithms which result in sub-optimal resource allocation. In this paper we propose an improved resource allocation al-gorithm based on continuous-binary firefly alal-gorithm. Simulation is done using Matlab. Simulation results show that the proposed algorithm improves the SU sum throughput and SU signal to interference noise (SINR) ratio in the secondary network.
ACM CCS (2012) Classification: Networks → Net-work components → Wireless access points, base sta-tions and infrastructure → Cognitive radios
Keywords: dymamic spectrum access, cognitive radio, spectrum allocation, power control
1. Introduction
Spectrum occupancy assessments done in USA, Spain, Singapore, New Zeland and Germany [1] and UK [2], indicate that a large portion of spectrum assigned to primary users (PUs) is un-derutilized. Spectrum is considered a scarce
which has a cognitive radio system (CRS), que-ries a central database. The WSD provides the database with parameters such as its location, device type and antenna height. The GLDB will then use this information along with the param-eters of all surrounding TV transmitters such as antenna height, transmit power and frequency of operation in order to come up with the list of available TVWS channels that can be used by the WSD on secondary basis without caus-ing harmful interference to the PUs. The GLDB will also give the WSD limits on the transmit power and also the time period in which each channel can be used.
It is expected that there will be continued de-mand for dynamic spectrum access (DSA). There is increased demand for DSA to TVWS from internet of things (IoT) [5], machine to machine communications, vehicle to vehi-cle (V2V) communications [6], [7], cellular networks (3G ,4G,5G) [8], [9], [10]. This in-creased demand for DSA will result in second-ary networks with a high density of users. The problem of interference will arise in a TVWS network with a high density of users. Some SUs also may not be admitted into the second-ary network due to interference constraints at PUs and SUs. TVWS can be used as long as the interference to the PU does not fall below a certain threshold. This threshold is commonly referred to as protection ratio or desired to un-desired (D/U) ratio.
In a network where there is a high number of de-vices seeking access to a secondary network al-location of two resources, power and spectrum, has to be optimized to ensure that as many SUs as possible access the secondary network while ensuring that interference constraints for PUs and QoS requirements for SUs are met. In this paper, resource allocation refers to joint alloca-tion of power and spectrum to SUs.
Existing algorithms allocate spectrum and pow-er in a one by one, greedy mannpow-er as SUs make request to the GLDB. This will result in sub-op-timal resource allocation. Existing algorithms also ignore adjacent channel interference (ACI). When there is a high density of devices in a net-work, ACI cannot be ignored even if the SUs are using low power since aggregate interfer-ence from multiple SUs using the same channel is as harmful as co-channel interference [11],
[12], [13]. SUs also have minimum QoS/inter-ference constraints measured by SINR. There is, therefore, a need for an algorithm that can be used to optimize resource allocation for all existing users in the secondary network so as to maximize the number of users (both SUs and PUs) in the network that meet the required QoS/interference constraints.
Firefly algorithm (FA) will be used for opti-mization of resource allocation. FA is chosen because it has been found out that it performs better than other metaheuristic algorithms such as particle swarm optimization and genetic al-gorithm [14]. The aim of this paper, therefore, is to design an improved algorithm for resource allocation based on modified FA for a TVWS network. We propose a hybrid continuous-bina-ry FA since the optimization involves both con-tinuous values (power allocation) and binary values (spectrum allocation). A TVWS network with a base station is considered.
The contribution of this paper is the design of an improved algorithm based on modified FA for joint spectrum allocation and transmit pow-er control in a GLDB based wireless TVWS network where devices communicate via a base station. To the best of our knowledge, continu-ous-binary FA has not been used for joint spec-trum allocation and power control in a TVWS network that makes use of a GLDB. Simulation results show that the use of the algorithm results in improvement sum throughput and SU SINR. The rest of the paper is organized as follows. In Section 2, related work is discussed. System model has been presented in Section 3. Simula-tion set up and simulaSimula-tion parameters have been presented in Section 4. Performance analysis of the proposed algorithm is discussed in Section 5. The paper is concluded in Section 6.
2. Related Work
A resource allocation method has been proposed in IEEE 802.11af [15]. In an IEEE 802.11af network, a device sends a channel availabil-ity query (CAQ) to registered location secure server (RLSS). RLSS operates as a GLDB. Once a CAQ is received by the RLSS, it will respond with a white space map (WSM). The WSM contains the list of available channels and their respective effective isotropic radiated
by Xue et al. [19]. Only co-channel interfer-ence has been considered. Spectrum allocation is done in greedy manner using a game theory algorithm called spatial adaptive play (SAP). The algorithm has the following disadvantag-es. Firstly, being a greedy algorithm, it may get trapped in a local optimum. Being trapped in local optimum will result in sub-optimal re-source allocation. Secondly, the algorithm ig-nores ACI.
3. System Model
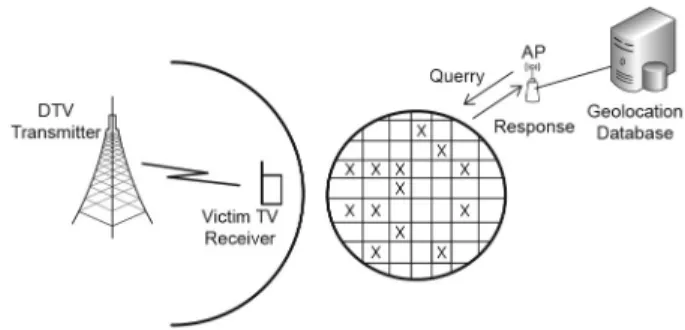
We proposed a power control algorithm in [14]. We extend the model and algorithm to incor-porate both power and spectrum allocation. A network illustrated by Figure 1 is considered. In the figure there is a single TV receiver placed at the edge of the protection region. Among all the TV receivers in the protection region, a TV receiver at this location is the one which is most vulnerable to interference since it is very close to the secondary network and receives the weakest signal from the TV tower. GLDB regulations require that the D/U ratio or protec-tion ratio be measured at the edge of protecprotec-tion region [20]. Aggregate interference at the TV receiver, both co-channel and adjacent channels should not make the protection ratio fall below the required protection ratio threshold.
Let the number SUs be N and the number of channels be M. Let the potential channel allo-cation matrix be represented as A = {an,m||an,m ∈ {0,1}}. A is of dimension N × M. an,m = 1 if
channel m assigned to user n. an,m = 0 if channel
m is not assigned to user n. Let the potential power (EIRP). IEEE 802.11af allows for both
closed loop power control and open loop pow-er control. With open loop powpow-er limitation the WSD has rigid power limitation similar to those provided by FCC regulations [3], [16] where-by fixed power values are assigned to SUs. In closed loop power control, the WSD has more flexible power limits that depend on location, time of use and the channel. The technique pro-posed in IEEE 802.11af is not designed to op-timize resource allocation as it seeks to ensure that specific users that request a channel are al-located one with an associated power level. In our proposed algorithm, resource allocation is done for all users that already exist in the net-work.
IEEE 802.22 makes use of a spectrum manager (SM) to allocate spectrum [17]. IEEE 802.22 al-lows the use of both GLDB and spectrum sens-ing for incumbent protection. The SM makes use of spectrum sensing function and GLDB to find out the channels available for secondary use and their respective effective isotropic radiated power (EIRP) limits. Just like IEEE 802.11af, the technique proposed in IEEE 802.22 is not designed to optimize resource allocation as it seeks to ensure that specific users that request channel are allocated one with an associated power level. Power and spectrum allocation is done in an arbitrary manner with no use of an objective function. It will not be applicable in a high density network where there is a need to optimize resource allocation so as to admit as many users as possible into the network.
GLDB based spectrum allocation with power control, co-channel interference and adjacent channel interference considerations has been proposed by Xue et al. [18]. Co-existence (mu-tual interference) among SUs is also consid-ered. Channel allocation and power control is then done in such a manner that the TV receiver and SUs SINR constraints are met. A greedy al-gorithm is used for power control and spectrum allocation. Each SU is allocated a channel and a power level when it makes a channel request to the GLDB. The major disadvantage of the proposed algorithm is that, being a greedy al-gorithm, it may get trapped in a local optimum. Being trapped in local optimum will result in sub-optimal resource allocation.
GLDB based spectrum allocation with power control and admission control for TVWS mul-tiple device-to-device links has been proposed
which has a cognitive radio system (CRS), que-ries a central database. The WSD provides the database with parameters such as its location, device type and antenna height. The GLDB will then use this information along with the param-eters of all surrounding TV transmitters such as antenna height, transmit power and frequency of operation in order to come up with the list of available TVWS channels that can be used by the WSD on secondary basis without caus-ing harmful interference to the PUs. The GLDB will also give the WSD limits on the transmit power and also the time period in which each channel can be used.
It is expected that there will be continued de-mand for dynamic spectrum access (DSA). There is increased demand for DSA to TVWS from internet of things (IoT) [5], machine to machine communications, vehicle to vehi-cle (V2V) communications [6], [7], cellular networks (3G ,4G,5G) [8], [9], [10]. This in-creased demand for DSA will result in second-ary networks with a high density of users. The problem of interference will arise in a TVWS network with a high density of users. Some SUs also may not be admitted into the second-ary network due to interference constraints at PUs and SUs. TVWS can be used as long as the interference to the PU does not fall below a certain threshold. This threshold is commonly referred to as protection ratio or desired to un-desired (D/U) ratio.
In a network where there is a high number of de-vices seeking access to a secondary network al-location of two resources, power and spectrum, has to be optimized to ensure that as many SUs as possible access the secondary network while ensuring that interference constraints for PUs and QoS requirements for SUs are met. In this paper, resource allocation refers to joint alloca-tion of power and spectrum to SUs.
Existing algorithms allocate spectrum and pow-er in a one by one, greedy mannpow-er as SUs make request to the GLDB. This will result in sub-op-timal resource allocation. Existing algorithms also ignore adjacent channel interference (ACI). When there is a high density of devices in a net-work, ACI cannot be ignored even if the SUs are using low power since aggregate interfer-ence from multiple SUs using the same channel is as harmful as co-channel interference [11],
[12], [13]. SUs also have minimum QoS/inter-ference constraints measured by SINR. There is, therefore, a need for an algorithm that can be used to optimize resource allocation for all existing users in the secondary network so as to maximize the number of users (both SUs and PUs) in the network that meet the required QoS/interference constraints.
Firefly algorithm (FA) will be used for opti-mization of resource allocation. FA is chosen because it has been found out that it performs better than other metaheuristic algorithms such as particle swarm optimization and genetic al-gorithm [14]. The aim of this paper, therefore, is to design an improved algorithm for resource allocation based on modified FA for a TVWS network. We propose a hybrid continuous-bina-ry FA since the optimization involves both con-tinuous values (power allocation) and binary values (spectrum allocation). A TVWS network with a base station is considered.
The contribution of this paper is the design of an improved algorithm based on modified FA for joint spectrum allocation and transmit pow-er control in a GLDB based wireless TVWS network where devices communicate via a base station. To the best of our knowledge, continu-ous-binary FA has not been used for joint spec-trum allocation and power control in a TVWS network that makes use of a GLDB. Simulation results show that the use of the algorithm results in improvement sum throughput and SU SINR. The rest of the paper is organized as follows. In Section 2, related work is discussed. System model has been presented in Section 3. Simula-tion set up and simulaSimula-tion parameters have been presented in Section 4. Performance analysis of the proposed algorithm is discussed in Section 5. The paper is concluded in Section 6.
2. Related Work
A resource allocation method has been proposed in IEEE 802.11af [15]. In an IEEE 802.11af network, a device sends a channel availabil-ity query (CAQ) to registered location secure server (RLSS). RLSS operates as a GLDB. Once a CAQ is received by the RLSS, it will respond with a white space map (WSM). The WSM contains the list of available channels and their respective effective isotropic radiated
by Xue et al. [19]. Only co-channel interfer-ence has been considered. Spectrum allocation is done in greedy manner using a game theory algorithm called spatial adaptive play (SAP). The algorithm has the following disadvantag-es. Firstly, being a greedy algorithm, it may get trapped in a local optimum. Being trapped in local optimum will result in sub-optimal re-source allocation. Secondly, the algorithm ig-nores ACI.
3. System Model
We proposed a power control algorithm in [14]. We extend the model and algorithm to incor-porate both power and spectrum allocation. A network illustrated by Figure 1 is considered. In the figure there is a single TV receiver placed at the edge of the protection region. Among all the TV receivers in the protection region, a TV receiver at this location is the one which is most vulnerable to interference since it is very close to the secondary network and receives the weakest signal from the TV tower. GLDB regulations require that the D/U ratio or protec-tion ratio be measured at the edge of protecprotec-tion region [20]. Aggregate interference at the TV receiver, both co-channel and adjacent channels should not make the protection ratio fall below the required protection ratio threshold.
Let the number SUs be N and the number of channels be M. Let the potential channel allo-cation matrix be represented as A = {an,m||an,m ∈ {0,1}}. A is of dimension N × M. an,m = 1 if
channel m assigned to user n. an,m = 0 if channel
m is not assigned to user n. Let the potential power (EIRP). IEEE 802.11af allows for both
closed loop power control and open loop pow-er control. With open loop powpow-er limitation the WSD has rigid power limitation similar to those provided by FCC regulations [3], [16] where-by fixed power values are assigned to SUs. In closed loop power control, the WSD has more flexible power limits that depend on location, time of use and the channel. The technique pro-posed in IEEE 802.11af is not designed to op-timize resource allocation as it seeks to ensure that specific users that request a channel are al-located one with an associated power level. In our proposed algorithm, resource allocation is done for all users that already exist in the net-work.
IEEE 802.22 makes use of a spectrum manager (SM) to allocate spectrum [17]. IEEE 802.22 al-lows the use of both GLDB and spectrum sens-ing for incumbent protection. The SM makes use of spectrum sensing function and GLDB to find out the channels available for secondary use and their respective effective isotropic radiated power (EIRP) limits. Just like IEEE 802.11af, the technique proposed in IEEE 802.22 is not designed to optimize resource allocation as it seeks to ensure that specific users that request channel are allocated one with an associated power level. Power and spectrum allocation is done in an arbitrary manner with no use of an objective function. It will not be applicable in a high density network where there is a need to optimize resource allocation so as to admit as many users as possible into the network.
GLDB based spectrum allocation with power control, co-channel interference and adjacent channel interference considerations has been proposed by Xue et al. [18]. Co-existence (mu-tual interference) among SUs is also consid-ered. Channel allocation and power control is then done in such a manner that the TV receiver and SUs SINR constraints are met. A greedy al-gorithm is used for power control and spectrum allocation. Each SU is allocated a channel and a power level when it makes a channel request to the GLDB. The major disadvantage of the proposed algorithm is that, being a greedy al-gorithm, it may get trapped in a local optimum. Being trapped in local optimum will result in sub-optimal resource allocation.
GLDB based spectrum allocation with power control and admission control for TVWS mul-tiple device-to-device links has been proposed
power allocation vector be P = {Pm1,Pm2,...,
Pmn,...,PmN} where Pmn is the power of SU n on
channel m. Assuming that the TV receiver op-erates using channel cTV at frequency (fcTV), the
interference by a single SU n to the TV receiver can be written as [21] ,[18]:
ITV n, =µ
(
C C P GTV, n)
nCn nSU PU→ G GSU PUI (1)where cn
n
P is the transmit power of SU n is op-erating on channel cn, GnSU PU→ is the path loss
from SU n to the victim TV receiver, GSU is the
antenna gain of SU and GPU is the antenna gain
of the PU (TV receiver). The term μ(cTV, cn)
refers to adjacent channel interference co-ef-ficient defined in [14], [18], [21]. If adjacent channel interference is modeled as equivalent co-channel interference, the total interference to the PU can then be expressed as:
1 , .
N TV TV n n I I = =
∑
(2)Equation (3) represents the SINR at the TV re-ceiver. In equation (3), the term ωo is the min-imum required SINR at the TV receiver, PTV is the received power from the TV transmitter at the TV receiver and δn2 is noise power. 2 .
TV o TV n P I +δ ≥ω (3)
Every single SU will receive interference from other SUs. The interference at SU n using chan-nel cn from all other SUs in the network using channel cj is denoted as: , 1, 1, , j n N N c n SU n j j j SU j j j n j n I I P G G = = ≠ ≠ =
∑
=∑
(4) where In,j is the interference caused by SU j to SU n, Gjn is the distance based path loss from SU j to SU n . SINR at each SU can then be written as: 2 , n BS SU BS n o SU n P G G I ρ ρ δ ≥ + (5)where PBS is the transmit power of the access point (base station) and GBS is the antenna gain of the base station. The term ρo is the minimum required SINR at SUs. The downlink through-put rn,m of SU transmitter n on channel m can be expressed as: , , 2
(
)
1 log 1 . 2 n m n m m n r = a b +ρ (6)
The sum throughput of all SUs will then be giv-en by: 1 1 , . N M n m n m U r = = =
∑ ∑
(7)In order to minimize interference to the PU and among SUs, there is a need for joint spectrum and a power allocation algorithm. The opti-mization goal is to find a power vector P* and channel allocation matrix A* that maximizes sum downlink throughput while ensuring that interference constraints at the PU and all SUs are met. The power of each SU is adjusted be-tween the range [Pmin,Pmax]. Optimal power vector and spectrum allocation matrix can be found by solving optimization Problem 1 below. Problem 1. P A∗, ∗=arg max
( )
U , (8)subject to: C1:ω ω> o, (9)
C2:ρn >ρo, n=1,2,..., ,N (10)
C p3: min ≤ pn ≤ pmax, (11)
C a4: n m, ∈
{ }
0,1 , (12)C a5: n m, =1, cn =m, (13)
C a6: n m, =0, cn ≠m, (14)
where ω is SINR at the TV receiver. Constraints C5 and C6 imply that one channel (cn = m) only in SUn channel allocation row will have the value 1, the rest will be 0. Pseudocode for the FA is presented in [14], [22], [23]. Flash flies produce short and rhythmic light to attract a female partner and potential prey. Each firefly's attractiveness is proportion-al to the light intensity and decreases as distance increases [22], [23]. Variation of attractiveness with distance is given by: 2 . r oe γ β β= − (15)
For any two flashing fireflies, the less bright one will move towards the brighter one accord-ing to followaccord-ing equation:
(
)
2 1 rij . t t t t i i i o j i t t x+ =x +β e−γ x −x +α ε (16)The terms xi and xj are the locations of firefly i and firefly j, respectively. The symbol α is a randomization parameter and the term εti is a vector of random numbers with uniform dis-tribution. The first term rij2
(
t t)
oe γ xj xi β − − represents attractiveness while the second term (αtεti ) represents randomization. Symbol t is the iteration number. The distance between fire-flies, rij, is computed as follows:(
)
2 , , 1 , D ij d i d j d r x x = =∑
− (17)where D is the dimension of the solution. D = N for the problem under consideration. Since optimization problem is about joint op-timization of power and spectrum allocation, each firefly, xi, will be made up of a power vec-tor (xP,i) and a spectrum allocation matrix (xC,i). Equation (17) applies when the values being considered are continuous. It will, therefore, apply only to the power vector. It will not apply to the spectrum allocation matrix because the values in the matrix are binary (0 or 1). The fol-lowing equation will be used for computing the distance (rij,C) between two channel allocation matrices: , 1 1 , , , , , D M ij C Cm d i Cm d j d m r x x = = =
∑ ∑
⊗ (18)where xCm,d,i and xCm,d,j are the channel alloca-tion values in fireflies i and j, respectively at position m,d in the channel allocation matrix. The following equation will be used for com-puting distance between two power vectors:
(
)
2 , , , 1 , D ij P Pd i Pd j d r x x = =∑
− (19) where xPd,i and xPd,j are the power vectors infireflies i and j, respectively.
New power vector and channel matrix for each firefly, xi, will be computed according to
equa-tion (20) and (21), respectively.
(
)
2 ,
1
, , rij P , , .
t t t t i
Pd i Pd i o Pd j Pd i t t
x+ =x +β e−γ x −x +α ε
(20)
(
)
2 ,
, , , , , , , ,
1 ij C .
m d i m d i m d j m d i
r
t t t t i
C C o C C t t
x+ =x +β e−γ x −x +α ε
(21) Since the channel allocation matrix is made up of binary values, equation (21) will not apply for the channel allocation matrix since firefly movement results in values that are not binary.
Algorithm 1. Joint power and spectrum allocation using firefly algorithm.
Step 1:
Specify M, N
Set the dimension of fireflies D Step 2:
Initialize the control parameters of the algorithm α, β, γ, number of fireflies NP and maximum number of iterations tmax.
Generate initial position of each firefly (xi)
randomly with each firefly consisting of power vector and channel vector:
Set of power vectors in the fireflies:
xP = [xP1,xP2,…,xPi,...,xP,NP] and i∈ (1,...,NP)
Set of channel vectors in the fireflies:
xC = [xC1,xC2,…,xCi,...,xC,NP] and i∈(1,...,NP)
Step 3:
Check firefly xi to see if the power values in the
power vector are within range. If any values are out of range then create random values that are within range to replace them.
Randomly select a single channel for each SU, if there is assignment of more than one channel to a SU. Step 4:
Calculate the brightness/fitness value of each firefly using equation (6) and rank the fireflies according to their fitness values.
Find the current best solution. Step 5:
For every firefly, move it to the better solution according to equation (16) through application of equations (20) for power mobility and (21), (22) and (23) for channel matrix mobility.
Step 6:
In order to determine whether xCm,d,i will be 0 or
1, Sigmoid function is first used to change the value after the firefly mobility by the channel matrices into a probability value between [0,1]:
(
, ,)
, ,1 .
1
m d i
m d i
C
C
sig x = +x
(22)
The value for each position in the channel allo-cation matrix is then computed as follows:
( )
( )
, , 1 1 0 m d i t C rand sig f x else + = < (23)where tm d i, , C f x= . The power and channel allocation problem de-fined in Problem 1 is a constrained optimiza-tion problem. The most common way to deal with constraints when using evolutionary al-gorithms to solve optimization problems is to use an exterior penalty function [24]. Exterior penalty functions are preferred over interior penalty functions because they do not require an initial feasible solution. Penalty functions change a constrained optimization problem into an unconstrained optimization problem. This is achieved by adding to the objective function a penalty term that prescribes a high cost for vio-lation of constraints. The objective function of optimization Problem 1 will change to: 2 2 1max 0, max 0, , N s p s i p i i U c g c g φ = = −
∑
− (24) where cp and cs are co-efficients for the two penalty terms, gis = ρo – ρi and gip = ωo – ωi. The optimization Problem 1 can then be re-written as that in Problem 2. Problem 2. ,P A∗ ∗ =arg max ,φ (25)subject to C p1: min ≤ pn ≤ pmax, (26)
C a2: n m, ∈
{ }
0,1 , (27)C a3: n m, =1, cn =m, (28)
C a4: n m, =0, cn ≠m. (29)
Problem 2 is then solved using algorithm 1.
4. Simulation Set Up
Parameters used in the simulation are outlined in Table 1. Simulation was done using Matlab R2016a. Matlab is chosen because it is rich in in-built functions. SUs (N = 1000 and N = 500) are distributed over an area of 1 km2. Figure 2
shows the network diagram generated in Mat-lab. Initially SUs are distributed across 10 chan-nels i.e. M = 10. Initial power assignment is also done randomly.
The free space path loss model was used to model path loss:
( )
20log( )
20log( )
147.55,PL d = d + f −
(30) where d is the distance in meters and f is the frequency of operation. The proposed resource allocation algorithm is then used to assign pow-er and spectrum to SUs.
5. Performance Analysis
In order to evaluate the performance of FA, its performance is compared with those of two other joint power and spectrum allocation al-gorithms: SAP (spatial adaptive play, proposed in [19]) and HA (heuristic algorithm, proposed in [18]). Performance of FA algorithm is also compared with those of two other metaheuristic
algorithms: genetic algorithm (GA) and particle swarm optimization (PSO). Results are gener-ated for 10 simulation runs and then an average is computed for each performance metric under consideration.
Parameters used for FA are as follows: βo = 1,
α = 30, γ = 10, number of fireflies NP = 50. Parameters used for PSO are as follows: num-ber of particles = 50, inertia weights: wmax = 4,
wmin = 2, social parameter c1 = 2 and cognitive
parameter c2 = 2. Parameters used for GA are as
follows: number of chromosomes = 50, muta-tion rate = 0.8 and selecmuta-tion rate = 0.5.
5.1. Sum Throughput Analysis
Table 2 shows comparison of the five algo-rithms in terms of sum throughput. For M = 500, the sum throughput of FA is 2.5%, 2.5%, 190% and 10.7% higher than that of GA, PSO, HA and SAP, respectively. For M = 1000, the sum throughput of FA is 13.9%, 11.25%, 24.8%
and 5.7% higher than that of GA, PSO, HA and SAP, respectively. These results show that FA achieves better throughput compared to all the rest of the algorithms. This is because FA
re-Table 1. Simulation parameters.
Parameter Value Description
bm 6 MHz Bandwidth of TV channel
fa 650 MHz Centre frequency of DTV signal
PTV –70.6 dBm Power of DTV signal at victim TV receiver
δn2 –102dBm Noise power
ωo 23 dB TV receiver SINR threshold
ρo 7 dB SU SINR threshold
PBS 36 dBm (4 W) Transmit power of base station
pmax 30 dBm Maximum SU transmit power
μ(cTV, cn) 0, –28 dB Adjacent channel interference co-efficient
GSU 10 dB SU antenna gain
GPU 10 dB PU antenna gain
GBS 10 dB Access point antenna gain
βo 1 FA parameter
α 30 FA parameter
γ 10 FA parameter
NP 20 Number of fireflies
cs 1000 Penalty term for SU interference
cp 1000 Penalty term for PU interference
Figure 2. Network diagram. Table 2. Comparison of sum throughput for different
algorithms.
Number
of SUS Algorithm
Sum thoughput
(Mb/s)
Percentage improvement
500
FA 5120
GA 4994 2.5%
PSO 4994 2.5%
HA 1757 190%
SAP 4624 10.7%
1000
FA 5535
GA 4859 13.9%
PSO 4975 11.25%
HA 4435 24.8%
sults in more optimal power and spectrum al-location that minimizes interference and hence maximizes throughput.
5.2. SU SINR Analysis
Table 3 shows comparison of performance of FA and the rest of algorithms under consider-ation in terms of percentage of SUs below the required SU SINR threshold of ρo = 7 dB. For
M = 500, number of SUs below SINR threshold for GA, PSO, HA and SAP is higher by 1.2%, 1.2%, 13.2% and 1.2% respectively. For M = 1000, number of SUs below SINR threshold for GA, PSO, HA and SAP is higher by 5.4%, 5.3%, 13.2% and 5.4%, respectively. Results, therefore, for both M = 500 and M = 1000 show that FA has lower percentage of SUs that fall below the 7 dB minimum SINR threshold com-pared to the rest of the algorithms.
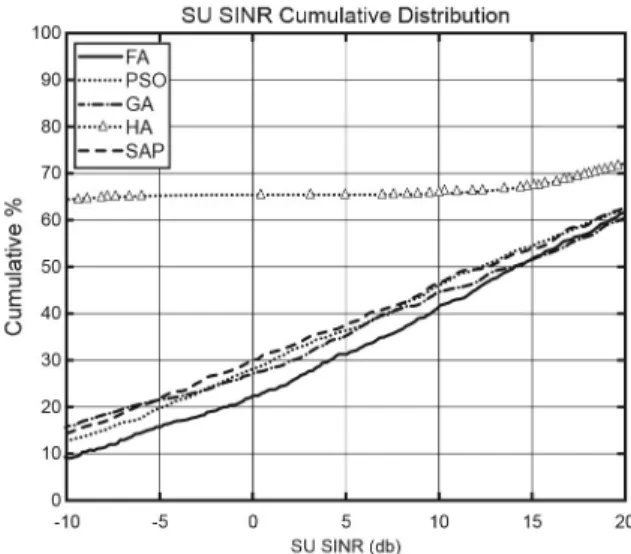
Comparison of performance of the algorithms in terms of cumulative distribution SU SINR is shown Figure 3 and Figure 4. Figure 3 shows cumulative distribution of SU SINR for M = 500. Figure 4 shows cumulative distribution of SU SINR for M = 1000. The two figures also show that FA always has a higher percentage of SUs above most of the SINR values. This is because FA has a more optimal resource alloca-tion compared to the rest of the algorithms.
5.3. PU SINR Analysis
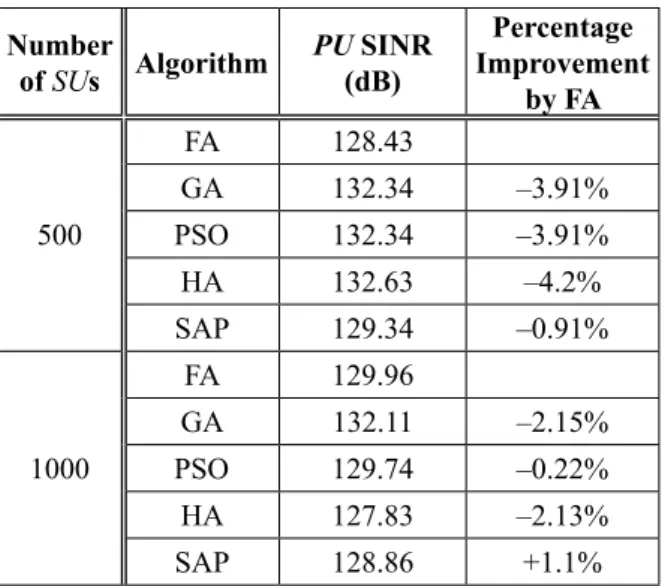
Table 4 shows performance comparison of the proposed algorithm with other algorithms in terms of PU SINR.
For M = 500 and M = 1000, the PU at the edge of protection region if fully protected since PU SINR is greater than the 23 dB minimum threshold. Results show no significant differ-ence in performance in terms of PU SINR be-tween FA and the rest of the algorithms. This is mainly because the PU penalty term is very low compared to other terms in equation (24)
5.4. Running Time Comparison
In order to compare the run time of algorithms, Matlab timeit() function is used. Each of the five algorithm's function handles was passed to the function. The specifications for the comput-er used to run the simulations are as follows: 64 bit Windows 7 operating system, 4GB RAM and 2.5 GHz dual-core processor. The function timeit() calls a measured function several times and then returns a median of the computed run-ning time for a measured function.
Results of running time comparison are shown in Table 5. Results show that, in terms of re-sponse time, FA is better that GA (requires 219% more time) and SAP (requires 80% more time). HA has the lowest response time (requires 68% less time compared to FA). Al-though HA has lower running time, results of throughput and SU SINR show that HA results
in very poor resource allocation. FA and PSO have no difference in terms of running time, but FA has better resource allocation since it achieves higher throughput and results in better SU SINR performance compared to PSO.
6. Conclusion
In this paper we have proposed a continuous-bi-nary firefly algorithm for resource allocation in a GLDB based TVWS network. Results show that the proposed algorithm results in improved sum throughput and SU SINR. Compared to other algorithms, the running time of the pro-posed algorithm is better, except to that of PSO. The proposed algorithm also shows that the FA and other metaheuristic algorithms, such as GA and PSO, can be applied whenever the optimi-zation variables consist of both binary and con-tinuous variables.
Future work will be to analyze the effect of changing FA parameters, how to choose the best channel when firefly movement result in allocation of more than one channel and testing the proposed algorithm in a real world TVWS network in order to validate its performance.
References
[1] K. Patil et al., ''A Survey of Worldwide Spectrum Occupancy Measurement Campaigns for Cogni-tive Radio'', in International Conference on De-vices and Communications (ICDeCom), 2011, pp. 1–5.
http://dx.doi.org/10.1109/ICDECOM.2011.5738472 [2] M. Mehdawi et al., ''Spectrum Occupancy Survey
in HULL-UK for Cognitive Radio Applications: Measurement and Analysis'', Int. J. Sci. Technol. Res., vol. 2, no. 4, pp. 231–236, 2013.
[3] M. Nekovee et al., ''Worldwide Trends in Regula-tion of Secondary Access to White Spaces Using Cognitive Radio'', Wirel. Commun. IEEE, vol. 19, no. 4, pp. 32–40, 2012.
http://dx.doi.org/10.1109/MWC.2012.6272421 [4] J. Heo et al., ''Mobile TV White Space with
Multi-Region Based Mobility Procedure'', IEEE Wirel. Commun. Lett., vol. 1, no. 6, pp. 569–572, 2012.
http://dx.doi.org/10.1109/WCL.2012.081312.120314 [5] A. Aijaz and A. H. Aghvami, ''Cognitive Ma-chine-to-Machine Communications for Inter-Table 3. Comparison of percentage of SUs below SU
SINR threshold for different algorithms.
Number
of SUs Algorithm
Percentage of SUs below
7dB SINR threshold
Percentage improvement
by FA
500
FA 27.4
GA 28.6 1.2%
PSO 28.6 1.2%
HA 84.8 57.4%
SAP 28.6 1.2%
1000
FA 52.4
GA 57.8 5.4%
PSO 57.1 5.3%
HA 65.6 13.2%
SAP 57.8 5.4%
Figure 3. SU SINR distribution for N = 500.
Figure 4. SU SINR distribution for N = 1000.
Table 4. Comparison of PU SINR for different algorithms.
Number
of SUs Algorithm PU(dB) SINR
Percentage Improvement
by FA
500
FA 128.43
GA 132.34 –3.91%
PSO 132.34 –3.91%
HA 132.63 –4.2%
SAP 129.34 –0.91%
1000
FA 129.96
GA 132.11 –2.15%
PSO 129.74 –0.22%
HA 127.83 –2.13%
SAP 128.86 +1.1%
Table 5. Comparison of running for different algorithms.
Algorithm Run time (seconds) Difference (seconds) Percentage difference with FA
FA 303
GA 969 +666 +68%
PSO 303 0 0
HA 119 –184 –154%
sults in more optimal power and spectrum al-location that minimizes interference and hence maximizes throughput.
5.2. SU SINR Analysis
Table 3 shows comparison of performance of FA and the rest of algorithms under consider-ation in terms of percentage of SUs below the required SU SINR threshold of ρo = 7 dB. For
M = 500, number of SUs below SINR threshold for GA, PSO, HA and SAP is higher by 1.2%, 1.2%, 13.2% and 1.2% respectively. For M = 1000, number of SUs below SINR threshold for GA, PSO, HA and SAP is higher by 5.4%, 5.3%, 13.2% and 5.4%, respectively. Results, therefore, for both M = 500 and M = 1000 show that FA has lower percentage of SUs that fall below the 7 dB minimum SINR threshold com-pared to the rest of the algorithms.
Comparison of performance of the algorithms in terms of cumulative distribution SU SINR is shown Figure 3 and Figure 4. Figure 3 shows cumulative distribution of SU SINR for M = 500. Figure 4 shows cumulative distribution of SU SINR for M = 1000. The two figures also show that FA always has a higher percentage of SUs above most of the SINR values. This is because FA has a more optimal resource alloca-tion compared to the rest of the algorithms.
5.3. PU SINR Analysis
Table 4 shows performance comparison of the proposed algorithm with other algorithms in terms of PU SINR.
For M = 500 and M = 1000, the PU at the edge of protection region if fully protected since PU SINR is greater than the 23 dB minimum threshold. Results show no significant differ-ence in performance in terms of PU SINR be-tween FA and the rest of the algorithms. This is mainly because the PU penalty term is very low compared to other terms in equation (24)
5.4. Running Time Comparison
In order to compare the run time of algorithms, Matlab timeit() function is used. Each of the five algorithm's function handles was passed to the function. The specifications for the comput-er used to run the simulations are as follows: 64 bit Windows 7 operating system, 4GB RAM and 2.5 GHz dual-core processor. The function timeit() calls a measured function several times and then returns a median of the computed run-ning time for a measured function.
Results of running time comparison are shown in Table 5. Results show that, in terms of re-sponse time, FA is better that GA (requires 219% more time) and SAP (requires 80% more time). HA has the lowest response time (requires 68% less time compared to FA). Al-though HA has lower running time, results of throughput and SU SINR show that HA results
in very poor resource allocation. FA and PSO have no difference in terms of running time, but FA has better resource allocation since it achieves higher throughput and results in better SU SINR performance compared to PSO.
6. Conclusion
In this paper we have proposed a continuous-bi-nary firefly algorithm for resource allocation in a GLDB based TVWS network. Results show that the proposed algorithm results in improved sum throughput and SU SINR. Compared to other algorithms, the running time of the pro-posed algorithm is better, except to that of PSO. The proposed algorithm also shows that the FA and other metaheuristic algorithms, such as GA and PSO, can be applied whenever the optimi-zation variables consist of both binary and con-tinuous variables.
Future work will be to analyze the effect of changing FA parameters, how to choose the best channel when firefly movement result in allocation of more than one channel and testing the proposed algorithm in a real world TVWS network in order to validate its performance.
References
[1] K. Patil et al., ''A Survey of Worldwide Spectrum Occupancy Measurement Campaigns for Cogni-tive Radio'', in International Conference on De-vices and Communications (ICDeCom), 2011, pp. 1–5.
http://dx.doi.org/10.1109/ICDECOM.2011.5738472 [2] M. Mehdawi et al., ''Spectrum Occupancy Survey
in HULL-UK for Cognitive Radio Applications: Measurement and Analysis'', Int. J. Sci. Technol. Res., vol. 2, no. 4, pp. 231–236, 2013.
[3] M. Nekovee et al., ''Worldwide Trends in Regula-tion of Secondary Access to White Spaces Using Cognitive Radio'', Wirel. Commun. IEEE, vol. 19, no. 4, pp. 32–40, 2012.
http://dx.doi.org/10.1109/MWC.2012.6272421 [4] J. Heo et al., ''Mobile TV White Space with
Multi-Region Based Mobility Procedure'', IEEE Wirel. Commun. Lett., vol. 1, no. 6, pp. 569–572, 2012.
http://dx.doi.org/10.1109/WCL.2012.081312.120314 [5] A. Aijaz and A. H. Aghvami, ''Cognitive Ma-chine-to-Machine Communications for Inter-Table 3. Comparison of percentage of SUs below SU
SINR threshold for different algorithms.
Number
of SUs Algorithm
Percentage of SUs below
7dB SINR threshold
Percentage improvement
by FA
500
FA 27.4
GA 28.6 1.2%
PSO 28.6 1.2%
HA 84.8 57.4%
SAP 28.6 1.2%
1000
FA 52.4
GA 57.8 5.4%
PSO 57.1 5.3%
HA 65.6 13.2%
SAP 57.8 5.4%
Figure 3. SU SINR distribution for N = 500.
Figure 4. SU SINR distribution for N = 1000.
Table 4. Comparison of PU SINR for different algorithms.
Number
of SUs Algorithm PU(dB) SINR
Percentage Improvement
by FA
500
FA 128.43
GA 132.34 –3.91%
PSO 132.34 –3.91%
HA 132.63 –4.2%
SAP 129.34 –0.91%
1000
FA 129.96
GA 132.11 –2.15%
PSO 129.74 –0.22%
HA 127.83 –2.13%
SAP 128.86 +1.1%
Table 5. Comparison of running for different algorithms.
Algorithm Run time (seconds) Difference (seconds) Percentage difference with FA
FA 303
GA 969 +666 +68%
PSO 303 0 0
HA 119 –184 –154%
net-of-Things: A Protocol Stack Perspective'', IEEE Internet Things J., vol. 2, no. 2, pp. 103–112, 2015.
http://dx.doi.org/10.1109/JIOT.2015.2390775 [6] O. Altintas et al., ''Demonstration of Vehicle to
Vehicle Communications Over TV White Space'', in Vehicular Technology Conference (VTC Fall), 2011, pp. 1–3.
http://dx.doi.org/10.1109/VETECF.2011.6093306 [7] S. Chen et al., ''On Optimizing Vehicular Dynam-ic Spectrum Access Networks: Automation and Learning in Mobile Wireless Environments'', pre-sented at the Vehicular Networking Conference, 2011.
http://dx.doi.org/10.1109/VNC.2011.6117122 [8] P. Demestichas et al., ''5G on the Horizon: Key
Challenges for the Radio-Access Network'', IEEE Veh. Technol. Mag., vol. 8, no. 3, pp. 47–53, 2013. http://dx.doi.org/10.1109/MVT.2013.2269187 [9] C. F. Silva et al., ''Extension of LTE
Operation-al Mode Over TV White Spaces'', Future Netw. Mob. Summit, pp. 1–13, 2011.
[10] M. Khalil et al. ''Feasibility, Architecture and Cost Considerations of Using TVWS for Rural Internet Access in 5G'', in 20th Conference on Innovations in Clouds, Internet and Networks (ICIN), 2017, pp. 23–30.
http://dx.doi.org/10.1109/ICIN.2017.7899245 [11] E. Obregon et al., ''A Model for Aggregate
Adja-cent Channel Interference in TV White Space'', in Vehicular Technology Conference (VTC Spring), 2011 IEEE 73rd, 2011, pp. 1–5.
http://dx.doi.org/10.1109/VETECS.2011.5956237 [12] L. Shi et al., ''Controlling Aggregate Interference
under Adjacent Channel Interference Constraint in TV White Space'', 2012.
[13] S. Kusaladharma and C. Tellambura, ''Aggregate Interference Analysis for Underlay Cognitive Ra-dio Networks'', IEEE Wirel. Commun. Lett., vol. 1, no. 6, pp. 641–644, 2012.
http://dx.doi.org/10.1109/WCL.2012.091312.120600 [14] R. Kennedy et al., ''Firefly Algorithm based Pow-er Control in Wireless TV White Space Network'', in AFRICON, 2017 IEEE, 2017, pp. 155–160. http://dx.doi.org/10.1109/AFRCON.2017.8095473 [15] A. B. Flores et al., ''IEEE 802.11 af: A Standard
for TV White Space Spectrum Sharing'', IEEE Commun. Mag., vol. 51, no. 10, pp. 92–100, 2013. http://dx.doi.org/10.1109/MCOM.2013.6619571 [16] Technical and Operational Requirements for the
possible operation of Cognitive Radio Systems in the 470-790 MHz, Eoropean Communications Commission, Cardiff, 2011.
[17] C. Cordeiro et al., ''IEEE 802.22: the First World-wide Wireless Standard based on Cognitive Ra-dios'', in First IEEE International Symposium on
New Frontiers in Dynamic Spectrum Access Net-works, DySPAN 2005, 2005, pp. 328–337. [18] Z. Xue et al., ''Coexistence among
Device-to-de-vice Communications in TV White Space based on Geolocation Database'', in International Work-shop on High Mobility Wireless Communications (HMWC), 2014, pp. 17–22.
http://dx.doi.org/10.1109/HMWC.2014.7000206 [19] Z. Xue and L. Wang, ''Geolocation Database based
Resource Sharing Among Multiple Device-to-de-vice Links in TV White Space'', presented at the International Conference on Wireless Communi-cations and Signal Processing (WCSP), 2015, pp. 1–6.
http://dx.doi.org/10.1109/WCSP.2015.7341116 [20] D. Gurney et al., ''Geo-location Database
Tech-niques for Incumbent Protection in the TV White Space'', in 3rd IEEE Symposium on New Frontiers in Dynamic Spectrum Access Networks, DySPAN 2008, 2008, pp. 1–9.
http://dx.doi.org/10.1109/DYSPAN.2008.31 [21] Z. Xue, ''Geolocation Spectrum Database
Assist-ed Coexistence of Multiple Device-to-device in TV White Space'', J. Inf. Comput. Sci., vol. 12, no. 11, pp. 4443–4456, 2015.
[22] K. K. Anumandla et al., ''Spectrum Allocation in Cognitive Radio Networks using Firefly Algo-rithm'', in International Conference on Swarm, Evolutionary and Memetic Computing, 2013, pp. 366–376.
https://doi.org/10.1007/978-3-319-03753-0_33 [23] Q. Liu et al., ''Spectrum Allocation Optimization
for Cognitive Radio Networks Using Binary Fire-fly Algorithm'', in Proceedings of the 2014 Inter-national Conference on Innovative Design and Manufacturing, Quebec, Canada, 2014.
http://dx.doi.org/10.1109/IDAM.2014.6912704 [24] L. A. Vardhan and A. Vasan, ''Evaluation of
Pen-alty Function Methods for Constrained Optimiza-tion using Particle Swarm OptimizaOptimiza-tion'', in IEEE Second International Conference on Image Infor-mation Processing (ICIIP), 2013, pp. 487–492. http://dx.doi.org/10.1109/ICIIP.2013.6707639
Received: April 2018
Revised: July 2018
Accepted: July 2018
Contact addresses: Kennedy K. Ronoh School of Computing and Informatics University of Nairobi Nairobi, Kenya e-mail: [email protected]
George Kamucha Department of Electrical and Information Engineering University of Nairobi Nairobi, Kenya e-mail: [email protected]
Thomas O. Olwal Department of Electrical Engineering Tshwane University of Technology Pretoria, South Africa e-mail: [email protected]
Tonny K. Omwansa School of Computing and Informatics
University of Nairobi Nairobi, Kenya e-mail: [email protected]
Kennedy K. Ronohis currently pursuing PhD in Computer Science at the University of Nairobi, Kenya. He is also a Lecturer at Technical University of Kenya (Department of Computer Science and Technolo-gy), and a member of IEEE. Ronoh received his Masters in Electrical Engineering (Wireless Networks and Electronics) from Linkoping Uni-versity, Sweden in 2012. His current research interests are TV white spaces, cognitive radio and wireless community networks.
GeoRGe Kamuchareceived his PhD degree in Electrical Engineering from Kassel University, Germany in 2003. He is currently a Senior Lecturer and Chair of Department, Department of Electrical and Infor-mation Engineering, University of Nairobi, Kenya. His current research interests include communication systems and biomedical systems.
Thomas o. olwala senior member IEEE, received his PhD in Com-puter Science from the University of Paris-EST, France, in 2010, and the title Doctor in Technology: Electrical Engineering from Tshwane University of Technology (TUT), South Africa, in 2011. He is a reg-istered professional engineer and currently works at TUT as an Asso-ciate Professor. His research interests include analysis and design of the spectrum, energy-efficient radio resource management, Internet of Things, advanced wireless sensor networks, SDN, Cognitive Radios, TV White spaces and Intelligent Networks. He has published over 115 technical and scientific research outputs in peer reviewed accredited journal articles, book chapters and conference papers. He also serves as a reviewer in a number of ACM/IEEE conferences and journals.