Sajidha Syed Azimuddin
1and Kalyani Desikan
21School of Computing Science and Engineering, VIT, Chennai, India 2School of Advanced Sciences, VIT, Chennai, India
A Simple Density with Distance Based
Initial Seed Selection Technique for
K Means Algorithm
Open issues with respect to K means algorithm are - identifying the number of clusters, initial seed concept selection, clustering tendency, handling empty clus-ters, identifying outliers etc. In this paper we propose a novel and simple technique considering both density and distance of the concepts in a dataset to identify initial seed concepts for clustering. Many authors have proposed different techniques to identify initial seed concepts; but our method ensures that the initial seed concepts are chosen from different clusters which are to be generated by the clustering solution. The hall-mark of our algorithm is that it is a single pass algo-rithm which does not require any extra parameters to be estimated. Further, our seed concepts are among the actual concepts and not the mean of representative con-cepts as is the case in many other algorithms. We have implemented our proposed algorithm and compared the results with the interval based technique of Khan. We see that our method outperforms the interval based method. We have also compared our method with the original random K means and K Means++ algorithms. ACM CCS (2012) Classification: Computing method-ologies → Machine learning → Learning paradigms
→ Unsupervised learning → Cluster analysis Information systems → Information systems applica-tions → Data mining → Clustering
Theory of computation → Theory and algorithms for application domains → Machine learning theory →
Unsupervised learning and clustering
Keywords: K means, initial seed concept, density, dis-tance, single pass
1. Introduction
One of the major demands of various industries is to identify similar patterns of interest. Sev-eral variations of clustering algorithms have
clus-ters. They may be contiguous clusters (nearest neighbor), where a concept in a cluster is more alike to one or more concepts in the cluster than to concepts in other clusters. They may be den-sity based clusters, where high denden-sity regions are separated by low density regions, or prop-erty based clusters which share the some mutual property or signify a particular concept or may be described by an objective function. Cluster-ing based on partitionCluster-ing algorithms such as K means yields fruitful results on mining datasets, when generating a dendrogram representation is infeasible [1]. Our work revolves around Lloyd's [2] K means algorithm. Its significance lies in its simplicity, straightforwardness, and is based on the firm foundation of analysis of variances. It tends to find clusters with approx-imately the same number of concepts in each cluster, as this method is established on the least squares criterion [3]. The centroids, being the representational units of the clusters, cap-ture the statistical and geometrical meaning of the clustered concepts. The major advantages of this algorithm are that it works easily with any Lp-norm, can be easily parallelized and is insensitive to unordered concepts. This algo-rithm works well only on concepts with numer-ical attributes and can be affected negatively by an outlier.
K means, though known to be one of the best and simplest clustering algorithms, suffers from certain drawbacks. Namely, the algorithm can-not determine the number of clusters, initial seed concepts are randomly selected, it con-verges to a local minimum, cannot determine the clustering tendency, does not handle empty clusters, cannot identify outliers etc.
We focus on one of the issues mentioned above for K means ‒ converging to local optimum. This is caused by random selection of initial seed concepts and leads to exhaustive enumer-ation of all groupings to select the global opti-mum. Arthur and Vassilvitskii [4] show that the runtime of K means algorithm is super polyno-mial. The objective of our work is to generate a globally optimum clustering solution without enumerating all the groupings, by identifying initial concepts such that they are well sepa-rated and selected from densely populated re-gions i.e., they form the representative concepts of different clusters in the solution space, en-abling better quality clustering solution.
2. Related Work
In the literature many researchers have dis-cussed the importance of identifying the initial seed concepts, which are representative con-cepts, benefitting in identifying homogeneous groups with high intra-cluster similarity. As-trahan's method [5] uses two parameters, d1 and d2, where d1 is used as the radius measure for each point to estimate its density. Then the points are ordered in diminishing order of their densities. The point having the maximum den-sity is selected as the first seed concept. The other seed concepts are selected in the order of diminishing densities with a rule that every new seed concept maintains a minimum distance d2 away from the previously selected centers. All the points which satisfy these criteria are cho-sen. If the number of seed concepts obtained is larger than K, they are grouped using hierarchi-cal clustering until only K of them remains. Cao et al. [6], streamlined Astrahan's [5] method by a neighborhood-based rough set model. For each concept the ε-neighborhood is identified by estimating the concepts which lie at ε distance away from it according to a particular distance measure. The first seed concept is selected by sorting the data concepts in non-increasing or-der of their cohesion and choosing the concept with the maximum cohesion. The subsequent centers are selected by traversing the concepts in non-increasing order of their cohesion and taking the first point having coupling lesser than ε with the previously chosen centers. The computational cost of ε-neighborhood is lesser than its computational complexity.
Arthur and Vassilvitskii [7] proposed the K Means++ algorithm which solves the seed se-lection issue by selecting a random concept as the first seed concept and the other seed con-cepts are selected based on their probable close-ness to the previously selected cluster seeds satisfying the triangular inequality such that the farthest seed concepts are selected. Ran-dom first seed concept may generate different clustering solutions every time. An extension of K Means++ is scalable K Means++ where K Means++ is parallelized to increase the speed of this algorithm.
Ostrovsky et al. [8] propose a method to locate seed concepts at positions very close to the
op-thest away from the previously selected con-cepts. Only the density of the initial seed point is considered and the remaining seed concepts are only selected based on distance from the previous seed concepts. In this method, it has been assumed that there is an equal number of concepts in every cluster, which may not al-ways be true.
A heuristic approach to find the number of clusters and initial seed point was proposed by Vighnesh Birodkar and Reddy [12]. The first seed point selected is random and then the re-mainder is based on measuring the farthest point from the previously selected seed concepts. It uses a heuristic to terminate the seed selection process. Also, it assumes that the clusters are well separated in a certain way, so it cannot be applied in all the cases.
Chaudhuri and Chaudhuri [13], identify (mul-tivariate) non-elliptical or elongated clusters which require more than a single seed point by a border point detection technique. The initial seeds are selected from a densely populated re-gion and a spanning tree method is used to as-sign several seed concepts to a cluster once it is identified as an elongated cluster.
Md Anisur Rahman et al. [14] produce a set of high quality initial seeds by a Seed-Detec-tive algorithm which uses ModEx technique to generate preliminary clusters applying de-cision tree technique. A large amount of mem-ory is utilized to find out the intersection of the leaf-nodes of the decision trees. The seeds for numerical attributes are obtained by finding the mean of the numerical values from the pre-liminary clusters and the seeds for categorical attributes are found by selecting the highest fre-quency records from the preliminary clusters. These are then fed as input to K means to gen-erate the final clusters.
Mengqiu Tian et al. [15] make use of a histo-gram analysis technique to automatically ini-tialize the K means algorithm. They overcome the inaccurate segmentation that arises due to data acquisition and reconstruction of the arti-facts of CT images which have several contents with similar gray-levels. Here the key idea is to spot the peaks in histograms and the gray-level of the maximum peak in the histogram is selected as the first eligible centroid. The subsequent centroid chosen is the local maxi-timal centres. It is a 2 stage process, where in
stage 1, two initial candidate concepts are picked from the core of the two optimal clusters using a non-uniform sampling process. The re-maining candidate concept centers are selected by randomly sampling points with the probabil-ity proportional to minimum distance from the previously selected candidate concept centers and are set as the next concept center. This is repeated until K candidate concept centers are found. In the second step of stage 1, all the given concepts are considered as centres, and then the concept with its corresponding con-cepts in the Voronoi region are deleted greedily, if they have a minimal contribution towards be-ing selected as centres. Voronoi region concepts for the remaining concepts are re-calculated and the candidate concept centre values are up-dated. This process is repeated until there are K centre concepts left along with their corre-sponding Voronoi region means. The sampling and the deletion procedures are combined to obtain the K candidate concept centers. In stage 2, to find the concept centroids there are two approaches. One approach is to use Effros and Schulman [9] method to estimate the radius of the possible clusters around the previously se-lected candidate concept centres and the mean of the possible clusters gives the final initial seed concepts. The second approach is to ex-pand the Voronoi region of the candidate centre concepts obtained in stage 1, sample 4βω ran-dom concepts from the Voronoi region by fix-ing parameter β and an input parameter ω. Final centres are selected by exhaustively searching for the K candidate concepts (choosing one candidate per initial centre from the samples of each Voronoi region) which are closer to the mean and form the final seed concepts.
Khan [10] locates the seed concepts by uncov-ering the highest gaps in the dataset, extracting the cluster boundaries and figuring out the mean of the concepts within the cluster boundaries. This method performs better than K Means++ [7] only in few cases.
far-ters. They may be contiguous clusters (nearest neighbor), where a concept in a cluster is more alike to one or more concepts in the cluster than to concepts in other clusters. They may be den-sity based clusters, where high denden-sity regions are separated by low density regions, or prop-erty based clusters which share the some mutual property or signify a particular concept or may be described by an objective function. Cluster-ing based on partitionCluster-ing algorithms such as K means yields fruitful results on mining datasets, when generating a dendrogram representation is infeasible [1]. Our work revolves around Lloyd's [2] K means algorithm. Its significance lies in its simplicity, straightforwardness, and is based on the firm foundation of analysis of variances. It tends to find clusters with approx-imately the same number of concepts in each cluster, as this method is established on the least squares criterion [3]. The centroids, being the representational units of the clusters, cap-ture the statistical and geometrical meaning of the clustered concepts. The major advantages of this algorithm are that it works easily with any Lp-norm, can be easily parallelized and is insensitive to unordered concepts. This algo-rithm works well only on concepts with numer-ical attributes and can be affected negatively by an outlier.
K means, though known to be one of the best and simplest clustering algorithms, suffers from certain drawbacks. Namely, the algorithm can-not determine the number of clusters, initial seed concepts are randomly selected, it con-verges to a local minimum, cannot determine the clustering tendency, does not handle empty clusters, cannot identify outliers etc.
We focus on one of the issues mentioned above for K means ‒ converging to local optimum. This is caused by random selection of initial seed concepts and leads to exhaustive enumer-ation of all groupings to select the global opti-mum. Arthur and Vassilvitskii [4] show that the runtime of K means algorithm is super polyno-mial. The objective of our work is to generate a globally optimum clustering solution without enumerating all the groupings, by identifying initial concepts such that they are well sepa-rated and selected from densely populated re-gions i.e., they form the representative concepts of different clusters in the solution space, en-abling better quality clustering solution.
2. Related Work
In the literature many researchers have dis-cussed the importance of identifying the initial seed concepts, which are representative con-cepts, benefitting in identifying homogeneous groups with high intra-cluster similarity. As-trahan's method [5] uses two parameters, d1 and d2, where d1 is used as the radius measure for each point to estimate its density. Then the points are ordered in diminishing order of their densities. The point having the maximum den-sity is selected as the first seed concept. The other seed concepts are selected in the order of diminishing densities with a rule that every new seed concept maintains a minimum distance d2 away from the previously selected centers. All the points which satisfy these criteria are cho-sen. If the number of seed concepts obtained is larger than K, they are grouped using hierarchi-cal clustering until only K of them remains. Cao et al. [6], streamlined Astrahan's [5] method by a neighborhood-based rough set model. For each concept the ε-neighborhood is identified by estimating the concepts which lie at ε distance away from it according to a particular distance measure. The first seed concept is selected by sorting the data concepts in non-increasing or-der of their cohesion and choosing the concept with the maximum cohesion. The subsequent centers are selected by traversing the concepts in non-increasing order of their cohesion and taking the first point having coupling lesser than ε with the previously chosen centers. The computational cost of ε-neighborhood is lesser than its computational complexity.
Arthur and Vassilvitskii [7] proposed the K Means++ algorithm which solves the seed se-lection issue by selecting a random concept as the first seed concept and the other seed con-cepts are selected based on their probable close-ness to the previously selected cluster seeds satisfying the triangular inequality such that the farthest seed concepts are selected. Ran-dom first seed concept may generate different clustering solutions every time. An extension of K Means++ is scalable K Means++ where K Means++ is parallelized to increase the speed of this algorithm.
Ostrovsky et al. [8] propose a method to locate seed concepts at positions very close to the
op-thest away from the previously selected con-cepts. Only the density of the initial seed point is considered and the remaining seed concepts are only selected based on distance from the previous seed concepts. In this method, it has been assumed that there is an equal number of concepts in every cluster, which may not al-ways be true.
A heuristic approach to find the number of clusters and initial seed point was proposed by Vighnesh Birodkar and Reddy [12]. The first seed point selected is random and then the re-mainder is based on measuring the farthest point from the previously selected seed concepts. It uses a heuristic to terminate the seed selection process. Also, it assumes that the clusters are well separated in a certain way, so it cannot be applied in all the cases.
Chaudhuri and Chaudhuri [13], identify (mul-tivariate) non-elliptical or elongated clusters which require more than a single seed point by a border point detection technique. The initial seeds are selected from a densely populated re-gion and a spanning tree method is used to as-sign several seed concepts to a cluster once it is identified as an elongated cluster.
Md Anisur Rahman et al. [14] produce a set of high quality initial seeds by a Seed-Detec-tive algorithm which uses ModEx technique to generate preliminary clusters applying de-cision tree technique. A large amount of mem-ory is utilized to find out the intersection of the leaf-nodes of the decision trees. The seeds for numerical attributes are obtained by finding the mean of the numerical values from the pre-liminary clusters and the seeds for categorical attributes are found by selecting the highest fre-quency records from the preliminary clusters. These are then fed as input to K means to gen-erate the final clusters.
Mengqiu Tian et al. [15] make use of a histo-gram analysis technique to automatically ini-tialize the K means algorithm. They overcome the inaccurate segmentation that arises due to data acquisition and reconstruction of the arti-facts of CT images which have several contents with similar gray-levels. Here the key idea is to spot the peaks in histograms and the gray-level of the maximum peak in the histogram is selected as the first eligible centroid. The subsequent centroid chosen is the local maxi-timal centres. It is a 2 stage process, where in
stage 1, two initial candidate concepts are picked from the core of the two optimal clusters using a non-uniform sampling process. The re-maining candidate concept centers are selected by randomly sampling points with the probabil-ity proportional to minimum distance from the previously selected candidate concept centers and are set as the next concept center. This is repeated until K candidate concept centers are found. In the second step of stage 1, all the given concepts are considered as centres, and then the concept with its corresponding con-cepts in the Voronoi region are deleted greedily, if they have a minimal contribution towards be-ing selected as centres. Voronoi region concepts for the remaining concepts are re-calculated and the candidate concept centre values are up-dated. This process is repeated until there are K centre concepts left along with their corre-sponding Voronoi region means. The sampling and the deletion procedures are combined to obtain the K candidate concept centers. In stage 2, to find the concept centroids there are two approaches. One approach is to use Effros and Schulman [9] method to estimate the radius of the possible clusters around the previously se-lected candidate concept centres and the mean of the possible clusters gives the final initial seed concepts. The second approach is to ex-pand the Voronoi region of the candidate centre concepts obtained in stage 1, sample 4βω ran-dom concepts from the Voronoi region by fix-ing parameter β and an input parameter ω. Final centres are selected by exhaustively searching for the K candidate concepts (choosing one candidate per initial centre from the samples of each Voronoi region) which are closer to the mean and form the final seed concepts.
Khan [10] locates the seed concepts by uncov-ering the highest gaps in the dataset, extracting the cluster boundaries and figuring out the mean of the concepts within the cluster boundaries. This method performs better than K Means++ [7] only in few cases.
far-mum having the highest weighted distance of all other known centroids (Viterbi algorithm). One of the findings of this algorithm is that the segmentation should not only be based on gray levels, but should also take into consideration all the attributes or spatial information.
Scott Epter et al. [16] discuss a graph based system for detecting clusterability of the con-cepts and generating seed information, includ-ing an estimate of the value of K. A histogram is constructed by estimating the bucket size from the distance matrix and plotting the distances in the histogram from which it may be identified if the concepts are clusterable or not. Based on the separation of the peak concepts and if well separable concepts are identified, the seed con-cepts can be estimated from connected lines of the histogram. This technique works well only for well separated groups of concepts.
Md Anisur Rahman et al. [17] consider only the density of each data concept (mixed data concepts) while identifying the initial seed con-cepts and ignoring the distance between them. Some of the researchers, Astrahan [5], Cao et al. [6] focus on identifying seed concepts based on certain parameters. Astrahan's method [5] depends on parameter d1, which is the radius of every concept to be considered for density estimation and parameter d2, which is the min-imum distance to be satisfied from the previ-ous seed points; whereas the method of Cao et al. [6] depends on the set of concepts within ε
distance from the selected seed concept based on a particular distance measure. Arthur and Vassilvitskii [7] ensure that the seed concepts are far away from each other, but do not guaran-tee reliability of the solution due to randomness involved or, is successful in identifying the seed concepts but leads to over splitting of the clus-ters as in Khan [10]. Density of the first con-cept is considered by Karteeka Pavan et al. [11] but the remaining are selected based on only distance from the previous concepts, whereas Mengqiu Tian et al. [15], Scott Epter et al. [16] use histogram based approaches which perform well on only well separated clusters.
The main contributions of this paper are as fol-lows. We propose a density based seed selec-tion technique which takes into account both density and distance from the previously se-lected seed concepts of all the data concepts.
Selection is based on the criteria that higher weightage is given to distance than to density so that the seed concepts are well separated and also selected from highly dense regions. Our proposed work ensures that no other estima-tion is needed in identifying the seed concepts. One of the major drawbacks of the previous approaches is that when outliers are present in the data, their contribution in the seed selec-tion will cause a huge deviaselec-tion in the selected concepts, making the clustering of the concepts harder. Our method ensures that such a con-cept is not selected as we determine the seed concepts by prioritizing based on the criteria of density with distance from the previous seed concepts. Our proposed algorithm is a single pass algorithm as the distances between all the concepts are maintained in a distance table, and are reused while calculating the distance of all the concepts from the previously selected seed concepts. We have implemented our proposed technique and compared the results with Khan's method [10], which is interval based, random K means [2] and K Means++ method [7] (20 iter-ations) and proved that our method outperforms or performs on par with the interval based and other methods.
3. Proposed Seed Selection Method
We propose a density with distance based method which is a simple method to adminis-ter. Its highlight is that its working takes into account both the distance between the seed con-cepts and their corresponding density. Our pro-posed method overcomes the limitations of the previous approaches by locating seed concepts which are farthest from the previously selected seed concepts, ensuring that they represent the clusters and are in the densest regions, by giv-ing a higher weightage for the distance between the concepts and lowering the weightage for density. This ensures that the selected seed con-cepts are guaranteed to be selected from dense regions of concepts which are well separated from each other. Here no additional estimation needs to be made in identifying the seed con-cepts. Our method guarantees that the initial seed concepts are taken from different clus-ters that are to be generated by the clustering solution. When these concepts are given as the
initial concepts for clustering to K means algo-rithm, the clustering solution obtained ensures a global optimum solution of high quality.
Our proposed algorithm is as given in Figure 1. In step 5.3 we assign a value α: = 0.6 or 0.8 for the distance index which ensures that the seed concepts selected are well separated. Step 5.4 ensures that we select a concept from a dense region which is placed farthest from the previ-ously selected concepts. This confirms that the seed concepts are the representative points of the clusters. The proposed methodology guar-antees that the first seed concept is selected from a dense region and the remaining concepts are prioritized based on density, simultaneously ensuring that they are at a maximum distance from the previously selected seed concepts. This list is updated until K seed concepts are identified.
Our seed concepts are among the actual con-cepts, whereas most of the existing methods capture the seed concepts as the mean of the initial set up which are representative concepts. Since during first iteration of the clustering
process, the proposed method compares all the concepts with the seed concepts which are ac-tual concepts and are the representative points of each cluster, they bring together similar con-cepts which are identical to each other. The time complexity of our proposed algorithm is observed as O (|C|2), where |C| is the total num-ber of data concepts.
4. Experimental Results and
Discussion
All the experimental datasets were normalised using Min-Max normalisation given by the for-mula
( )
( )
( )
min max min
i i
C C
Z
C C
−
=
−
where C:= {C1, ..., Cn} are the given concepts to
be clustered and Zi is the i-th normalized data.
The normalized data lies between [0, 1].
Step 1. For each data concept Ci, i: = 1. . n For each data concept Cj, j: = 1. . n
Calculate EDij: = dist(Ci,Cj) where dist(Ci,Cj): =
(
C Ci− j)
2 .Step 2. For each data concept Ci, i: = 1. . n Compute Row-Sum RSi=∑nj=1EDij.
Step 3. Sort Row-Sums (RSi) with the corresponding indices of the concepts in non-decreasing order to get the Sorted Row-Sum (SRS).
Step 4. Find the index of the first seed point ISC1: = index_of_concept[min(SRS)] Step 5. For l: = 2. . K
Step 5.1. For i: =1. . n
Step 5.1.1. For j = 1. . l ‒ 1
Get gij: = ED[i,ISCj] Step 5.1.2. Get Si: = min(gij)
Step 5.2. Sort Si with the corresponding indices of the concepts in non-increasing order to get the Sorted Distance Values (SDV)
Step 5.3. With α: = 0.6 or 0.8
For each data concept Ci, i: = 1. . n
New_Den_Dist_Index(NDDI): = α * (index of Ci from SDV) + (1 ‒ α) * (index of Ci from SRS) Step 5.4. Obtain the index of the minimum value in NDDI
ind_NDDI: = index[min(NDDI)] ISCl: = ind_NDDI
Step 6. Retrieve the seed concepts (Act_Seed) using their index values in ISC1, ISC2, …, ISCK Step 7. Cluster the data concepts using the seed concepts in Act_Seed.
mum having the highest weighted distance of all other known centroids (Viterbi algorithm). One of the findings of this algorithm is that the segmentation should not only be based on gray levels, but should also take into consideration all the attributes or spatial information.
Scott Epter et al. [16] discuss a graph based system for detecting clusterability of the con-cepts and generating seed information, includ-ing an estimate of the value of K. A histogram is constructed by estimating the bucket size from the distance matrix and plotting the distances in the histogram from which it may be identified if the concepts are clusterable or not. Based on the separation of the peak concepts and if well separable concepts are identified, the seed con-cepts can be estimated from connected lines of the histogram. This technique works well only for well separated groups of concepts.
Md Anisur Rahman et al. [17] consider only the density of each data concept (mixed data concepts) while identifying the initial seed con-cepts and ignoring the distance between them. Some of the researchers, Astrahan [5], Cao et al. [6] focus on identifying seed concepts based on certain parameters. Astrahan's method [5] depends on parameter d1, which is the radius of every concept to be considered for density estimation and parameter d2, which is the min-imum distance to be satisfied from the previ-ous seed points; whereas the method of Cao et al. [6] depends on the set of concepts within ε
distance from the selected seed concept based on a particular distance measure. Arthur and Vassilvitskii [7] ensure that the seed concepts are far away from each other, but do not guaran-tee reliability of the solution due to randomness involved or, is successful in identifying the seed concepts but leads to over splitting of the clus-ters as in Khan [10]. Density of the first con-cept is considered by Karteeka Pavan et al. [11] but the remaining are selected based on only distance from the previous concepts, whereas Mengqiu Tian et al. [15], Scott Epter et al. [16] use histogram based approaches which perform well on only well separated clusters.
The main contributions of this paper are as fol-lows. We propose a density based seed selec-tion technique which takes into account both density and distance from the previously se-lected seed concepts of all the data concepts.
Selection is based on the criteria that higher weightage is given to distance than to density so that the seed concepts are well separated and also selected from highly dense regions. Our proposed work ensures that no other estima-tion is needed in identifying the seed concepts. One of the major drawbacks of the previous approaches is that when outliers are present in the data, their contribution in the seed selec-tion will cause a huge deviaselec-tion in the selected concepts, making the clustering of the concepts harder. Our method ensures that such a con-cept is not selected as we determine the seed concepts by prioritizing based on the criteria of density with distance from the previous seed concepts. Our proposed algorithm is a single pass algorithm as the distances between all the concepts are maintained in a distance table, and are reused while calculating the distance of all the concepts from the previously selected seed concepts. We have implemented our proposed technique and compared the results with Khan's method [10], which is interval based, random K means [2] and K Means++ method [7] (20 iter-ations) and proved that our method outperforms or performs on par with the interval based and other methods.
3. Proposed Seed Selection Method
We propose a density with distance based method which is a simple method to adminis-ter. Its highlight is that its working takes into account both the distance between the seed con-cepts and their corresponding density. Our pro-posed method overcomes the limitations of the previous approaches by locating seed concepts which are farthest from the previously selected seed concepts, ensuring that they represent the clusters and are in the densest regions, by giv-ing a higher weightage for the distance between the concepts and lowering the weightage for density. This ensures that the selected seed con-cepts are guaranteed to be selected from dense regions of concepts which are well separated from each other. Here no additional estimation needs to be made in identifying the seed con-cepts. Our method guarantees that the initial seed concepts are taken from different clus-ters that are to be generated by the clustering solution. When these concepts are given as the
initial concepts for clustering to K means algo-rithm, the clustering solution obtained ensures a global optimum solution of high quality.
Our proposed algorithm is as given in Figure 1. In step 5.3 we assign a value α: = 0.6 or 0.8 for the distance index which ensures that the seed concepts selected are well separated. Step 5.4 ensures that we select a concept from a dense region which is placed farthest from the previ-ously selected concepts. This confirms that the seed concepts are the representative points of the clusters. The proposed methodology guar-antees that the first seed concept is selected from a dense region and the remaining concepts are prioritized based on density, simultaneously ensuring that they are at a maximum distance from the previously selected seed concepts. This list is updated until K seed concepts are identified.
Our seed concepts are among the actual con-cepts, whereas most of the existing methods capture the seed concepts as the mean of the initial set up which are representative concepts. Since during first iteration of the clustering
process, the proposed method compares all the concepts with the seed concepts which are ac-tual concepts and are the representative points of each cluster, they bring together similar con-cepts which are identical to each other. The time complexity of our proposed algorithm is observed as O (|C|2), where |C| is the total num-ber of data concepts.
4. Experimental Results and
Discussion
All the experimental datasets were normalised using Min-Max normalisation given by the for-mula
( )
( )
( )
min max min
i i
C C
Z
C C
−
=
−
where C:= {C1, ..., Cn} are the given concepts to
be clustered and Zi is the i-th normalized data.
The normalized data lies between [0, 1].
Step 1. For each data concept Ci, i: = 1. . n For each data concept Cj, j: = 1. . n
Calculate EDij: = dist(Ci,Cj) where dist(Ci,Cj): =
(
C Ci− j)
2 .Step 2. For each data concept Ci, i: = 1. . n Compute Row-Sum RSi=∑nj=1EDij.
Step 3. Sort Row-Sums (RSi) with the corresponding indices of the concepts in non-decreasing order to get the Sorted Row-Sum (SRS).
Step 4. Find the index of the first seed point ISC1: = index_of_concept[min(SRS)] Step 5. For l: = 2. . K
Step 5.1. For i: =1. . n
Step 5.1.1. For j = 1. . l ‒ 1
Get gij: = ED[i,ISCj] Step 5.1.2. Get Si: = min(gij)
Step 5.2. Sort Si with the corresponding indices of the concepts in non-increasing order to get the Sorted Distance Values (SDV)
Step 5.3. With α: = 0.6 or 0.8
For each data concept Ci, i: = 1. . n
New_Den_Dist_Index(NDDI): = α * (index of Ci from SDV) + (1 ‒ α) * (index of Ci from SRS) Step 5.4. Obtain the index of the minimum value in NDDI
ind_NDDI: = index[min(NDDI)] ISCl: = ind_NDDI
Step 6. Retrieve the seed concepts (Act_Seed) using their index values in ISC1, ISC2, …, ISCK Step 7. Cluster the data concepts using the seed concepts in Act_Seed.
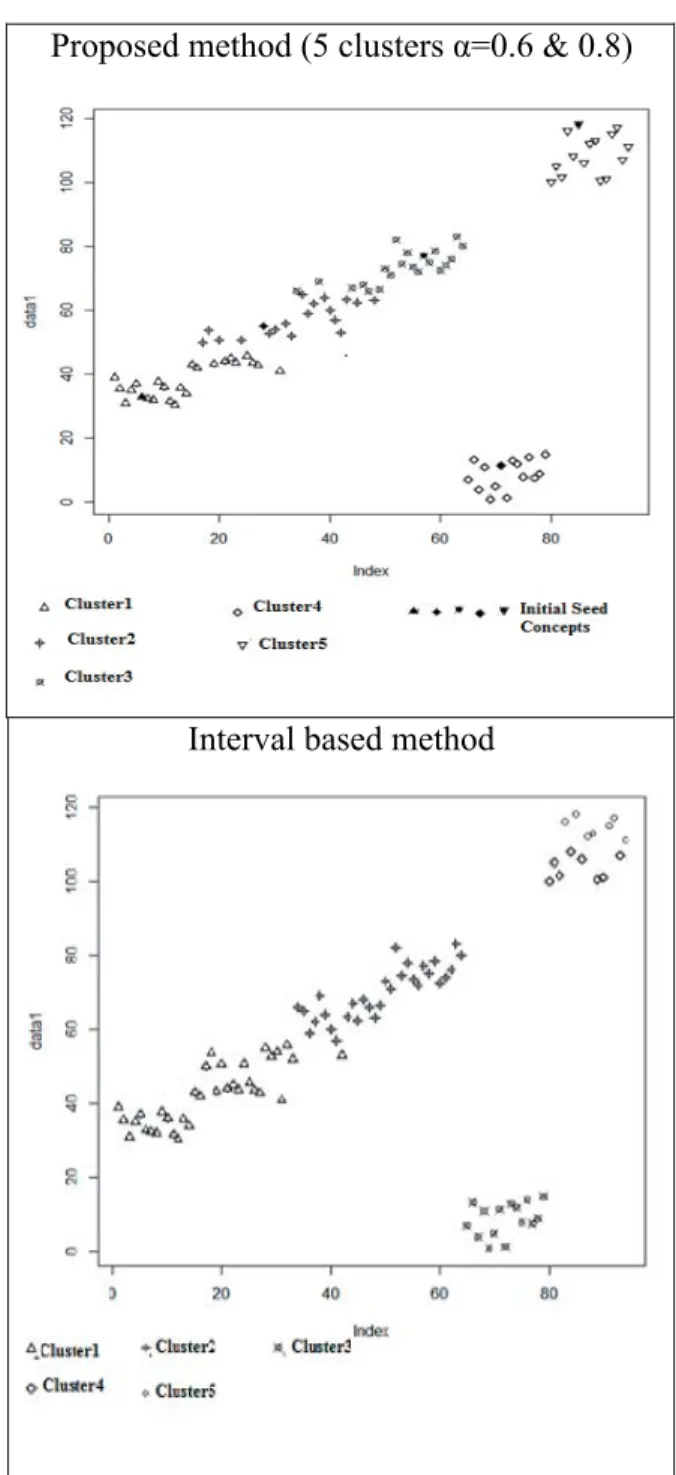
To ensure that the cluster assignments are rep-licable using this methodology, clustering was performed on the same data many times. For each of the runs, no change was observed in the cluster centres. All experiments were conducted on a HP laptop with an Intel (R) Core (TM) i-5-5200U CPU @ 2.20GHz Pentium processor and 8 GB of main memory with 64bit OS.We carried out our experiment on 7 datasets and compared our results with the interval based method, K means and K Means++ algorithms. The first dataset that we considered was the stan-dard Iris [18] dataset. Using the petal length at-tribute, it was partitioned into 3 clusters. Cloud Cover data is the second dataset downloaded from Phillipe Collard [19]. Fifty partitions were generated from 1024 concepts. Data of attribute 3 was used to perform the clustering. Abalone dataset from UCIMLR [20] was the third data-set. Data in column 5 was used for clustering 4177 instances into 25 groups. The fourth data-set was Ionosphere from UCIR. Using the data from column 5, 351 concepts were clustered into 2 partitions.Wine dataset is the fifth dataset with 179 concepts clustered into 3 groups using the data in column 13-Proline. The sixth dataset was Glass with the data in column 3-RI: refrac-tive index clustered into 2 partitions (Window glass-163, Non-window glass-51). The last was a synthetic dataset of 94 concepts with non-uni-form distribution grouped into 5 and 7 clusters. The interval based method focuses on identi-fying gaps between data concepts and ensuring that the seed concepts are closer to the mean. This leads to subdivision of dense regions as shown below in Figures 2 and 3. We have ran-domly generated 94 synthetic data concepts which are non-uniformly distributed (range of values: 1 ‒ 120). We clustered them into 5 and 7 clusters. Figure 2 and Figure 3 show the com-parative plots for 5 and 7 clusters for the pro-posed method with α = 0.6 and 0.8 (both SSE values are same) and the interval based method. In Figure 2 we see that the interval based method captures the largest gaps between the concepts and provides seed values based on the gaps which lead to oversplitting, whereas using our method the clusters are separated based on density of the regions.
We can also see in Figure 2 that our proposed method of clustering into 5 clusters with α = 0.6
was able to identify clusters from ranges 30 ‒ 40, 40 ‒ 65, 60 ‒ 80 as cluster 1, cluster 2, clus -ter 3 and 1 ‒ 15 as clus-ter 4 and 100 ‒ 120 as cluster 5 of sizes 22, 15, 15, 18, 24 respectively. In interval based method, concepts which are assigned to cluster 5 in our method are assigned to two different clusters of sizes 8 and 7, as this method focuses only on the distance between two adjacent concepts, ignoring the density. This leads to oversplitting of homogeneous
regions. The other clusters obtained by this method are of sizes 15, 34 and 30 respectively. Figure 3 shows the clustering for 7 clusters. Val-ues from 20 ‒ 30 were in cluster 1, 40 ‒ 50 in cluster 2, 50 ‒ 60 in cluster 3, 60 ‒ 70 in cluster 4, 80 ‒ 90 in cluster 5,100-120 in cluster 6 and 1 ‒ 15 in cluster 7 of sizes 11, 15, 15, 15, 13, 14, 11, respectively. In interval based method, we see the difference in cluster formation in cluster
6 (100 ‒ 120), which is subdivided into 3 clus -ters of sizes 4, 4, 7 and cluster 7 (1 ‒ 15) divided into 2 subclusters of sizes 7, 7 with other clus-ters of sizes 34 and 30. This situation arises as gaps are considered during seed identification. We estimated the accuracy of the clustering solution by dividing the sum of intra-cluster similarity by the total number of concepts (SSE Normalised). The Sum of Squared Errors or Residual Sum of Squares [21] of a clustering solution is used to estimate the tightness of the solution obtained. The smaller the value, the purer is the solution and a value 0 indicates that the cluster is in its purest form.
We validated the accuracy of clustering solu-tion using the Sum of squared differences be-tween cluster members and their closest centres (normalized by data size) as a measure of com-parison as mentioned in [10].
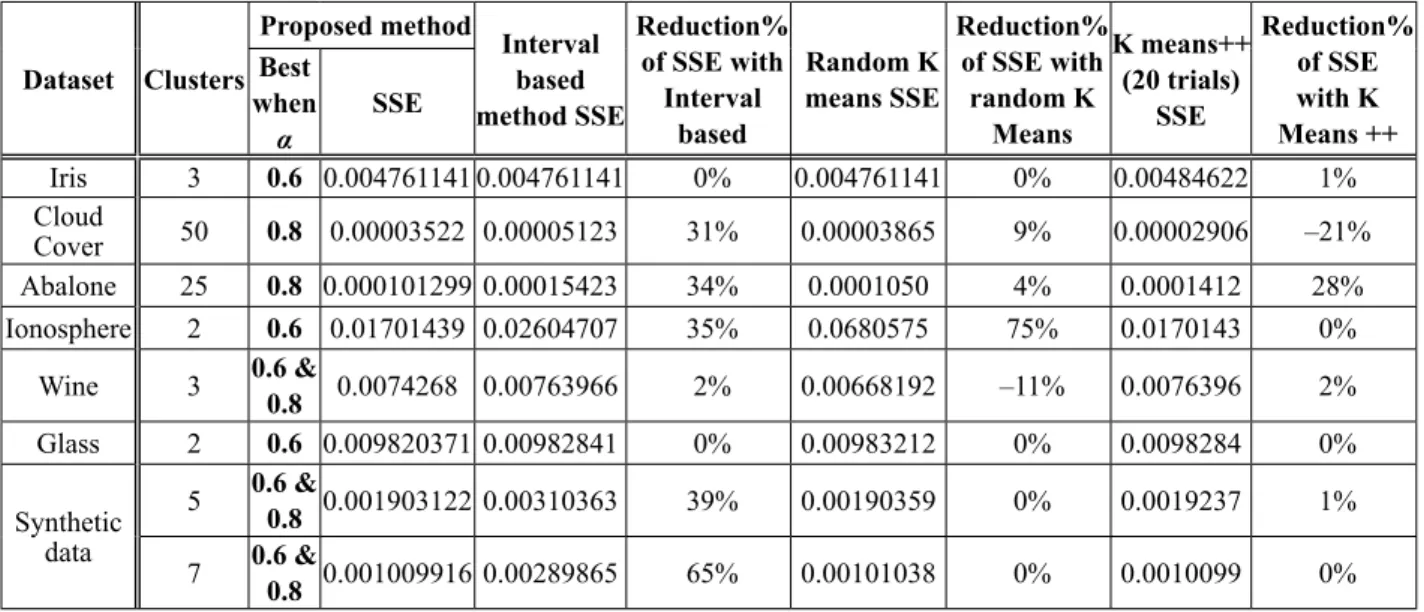
Table 1 presents the reduction percentage of SSE (Sum of squared differences between cluster members and their closest centres (nor-malized by data size)) of our proposed method with bias parameter α as 0.6 or 0.8 respectively, based on the best SSE values observed vis-a-vis the interval based method, random K means and K Means++ (20 trials). From the results obtained, we see that for cloud cover, abalone, ionosphere, wine and synthetic data concepts the proposed method outperforms the inter-val based method. Also, we see that, except for wine data concepts, the proposed method outperforms or performs similar to random K means. Finally, we observe that, excluding cloud cover dataset, the proposed method out-performs or out-performs on par with K Means++. Table 2 presents the total time taken in seconds to identify the seeds and perform the clustering. For example, if we consider the Iris dataset, the total time taken for our proposed method is 0.69 sec (0.63 sec (seed selection) + 0.03 sec (Clustering time)) when α = 0.6. This time, as can be seen in Table 2, is higher than the ex-ecution time for interval based method and K Means++. This is expected as our proposed al-gorithm works on the principle of identifying the seed concepts from a dense region and par-allelly ensuring that the seed concepts are well separated. No other additional computation is done in the proposed algorithm. The other ap-proaches do not ensure that the seed concepts
3URSRVHGPHWKRGFOXVWHUVĮ
,QWHUYDOEDVHGPHWKRG
Figure 2. Comparative plot for synthetic data concepts (5 clusters).
3URSRVHGPHWKRGFOXVWHUVĮ
,QWHUYDOEDVHGPHWKRG
To ensure that the cluster assignments are rep-licable using this methodology, clustering was performed on the same data many times. For each of the runs, no change was observed in the cluster centres. All experiments were conducted on a HP laptop with an Intel (R) Core (TM) i-5-5200U CPU @ 2.20GHz Pentium processor and 8 GB of main memory with 64bit OS.We carried out our experiment on 7 datasets and compared our results with the interval based method, K means and K Means++ algorithms. The first dataset that we considered was the stan-dard Iris [18] dataset. Using the petal length at-tribute, it was partitioned into 3 clusters. Cloud Cover data is the second dataset downloaded from Phillipe Collard [19]. Fifty partitions were generated from 1024 concepts. Data of attribute 3 was used to perform the clustering. Abalone dataset from UCIMLR [20] was the third data-set. Data in column 5 was used for clustering 4177 instances into 25 groups. The fourth data-set was Ionosphere from UCIR. Using the data from column 5, 351 concepts were clustered into 2 partitions.Wine dataset is the fifth dataset with 179 concepts clustered into 3 groups using the data in column 13-Proline. The sixth dataset was Glass with the data in column 3-RI: refrac-tive index clustered into 2 partitions (Window glass-163, Non-window glass-51). The last was a synthetic dataset of 94 concepts with non-uni-form distribution grouped into 5 and 7 clusters. The interval based method focuses on identi-fying gaps between data concepts and ensuring that the seed concepts are closer to the mean. This leads to subdivision of dense regions as shown below in Figures 2 and 3. We have ran-domly generated 94 synthetic data concepts which are non-uniformly distributed (range of values: 1 ‒ 120). We clustered them into 5 and 7 clusters. Figure 2 and Figure 3 show the com-parative plots for 5 and 7 clusters for the pro-posed method with α = 0.6 and 0.8 (both SSE values are same) and the interval based method. In Figure 2 we see that the interval based method captures the largest gaps between the concepts and provides seed values based on the gaps which lead to oversplitting, whereas using our method the clusters are separated based on density of the regions.
We can also see in Figure 2 that our proposed method of clustering into 5 clusters with α = 0.6
was able to identify clusters from ranges 30 ‒ 40, 40 ‒ 65, 60 ‒ 80 as cluster 1, cluster 2, clus -ter 3 and 1 ‒ 15 as clus-ter 4 and 100 ‒ 120 as cluster 5 of sizes 22, 15, 15, 18, 24 respectively. In interval based method, concepts which are assigned to cluster 5 in our method are assigned to two different clusters of sizes 8 and 7, as this method focuses only on the distance between two adjacent concepts, ignoring the density. This leads to oversplitting of homogeneous
regions. The other clusters obtained by this method are of sizes 15, 34 and 30 respectively. Figure 3 shows the clustering for 7 clusters. Val-ues from 20 ‒ 30 were in cluster 1, 40 ‒ 50 in cluster 2, 50 ‒ 60 in cluster 3, 60 ‒ 70 in cluster 4, 80 ‒ 90 in cluster 5,100-120 in cluster 6 and 1 ‒ 15 in cluster 7 of sizes 11, 15, 15, 15, 13, 14, 11, respectively. In interval based method, we see the difference in cluster formation in cluster
6 (100 ‒ 120), which is subdivided into 3 clus -ters of sizes 4, 4, 7 and cluster 7 (1 ‒ 15) divided into 2 subclusters of sizes 7, 7 with other clus-ters of sizes 34 and 30. This situation arises as gaps are considered during seed identification. We estimated the accuracy of the clustering solution by dividing the sum of intra-cluster similarity by the total number of concepts (SSE Normalised). The Sum of Squared Errors or Residual Sum of Squares [21] of a clustering solution is used to estimate the tightness of the solution obtained. The smaller the value, the purer is the solution and a value 0 indicates that the cluster is in its purest form.
We validated the accuracy of clustering solu-tion using the Sum of squared differences be-tween cluster members and their closest centres (normalized by data size) as a measure of com-parison as mentioned in [10].
Table 1 presents the reduction percentage of SSE (Sum of squared differences between cluster members and their closest centres (nor-malized by data size)) of our proposed method with bias parameter α as 0.6 or 0.8 respectively, based on the best SSE values observed vis-a-vis the interval based method, random K means and K Means++ (20 trials). From the results obtained, we see that for cloud cover, abalone, ionosphere, wine and synthetic data concepts the proposed method outperforms the inter-val based method. Also, we see that, except for wine data concepts, the proposed method outperforms or performs similar to random K means. Finally, we observe that, excluding cloud cover dataset, the proposed method out-performs or out-performs on par with K Means++. Table 2 presents the total time taken in seconds to identify the seeds and perform the clustering. For example, if we consider the Iris dataset, the total time taken for our proposed method is 0.69 sec (0.63 sec (seed selection) + 0.03 sec (Clustering time)) when α = 0.6. This time, as can be seen in Table 2, is higher than the ex-ecution time for interval based method and K Means++. This is expected as our proposed al-gorithm works on the principle of identifying the seed concepts from a dense region and par-allelly ensuring that the seed concepts are well separated. No other additional computation is done in the proposed algorithm. The other ap-proaches do not ensure that the seed concepts
3URSRVHGPHWKRGFOXVWHUVĮ
,QWHUYDOEDVHGPHWKRG
Figure 2. Comparative plot for synthetic data concepts (5 clusters).
3URSRVHGPHWKRGFOXVWHUVĮ
,QWHUYDOEDVHGPHWKRG
are selected from dense regions and are only distance based. Hence, the time taken by those algorithms is less. Nevertheless, our proposed approach ensures increased accuracy in select-ing the seed concepts. Thus, the seed concepts identified using our method ensure good qual-ity clusters, for most of the data sets.
5. Conclusion
In this study we considered 7 datasets for our analysis. For each of these 7 datasets, our pro-posed method was compared with interval based method, K means and K Means++ algo-rithms. The largest of the datasets considered by us is Abalone dataset with 4177 instances
and the smallest dataset is the Iris dataset with 150 instances. For each of the datasets, cluster-ing solutions were obtained by considercluster-ing the most contributing attribute.
The central objective of our proposed algorithm is to yield replicable results for the given data-set with high clustering accuracy. The sums of squared differences between cluster concepts and cluster centres obtained using our proposed method and the interval based method, random K means and K Means++ were compared and presented in Table 1. Our proposed method out-performs interval based method for almost all the datasets and is on par for Iris dataset. With respect to K Means++, our method improves the results for some datasets, whereas for cloud
cover dataset our method underperforms. We infer from Table 2 that our proposed method takes more time compared to other approaches, due to the fact that our approach takes into con-sideration both density and distance during seed selection. Albeit, our approach yields better or equivalent clustering solutions compared to the existing approaches.
6. Acknowledgements
The authors are very grateful to the anonymous reviewers and editor. Their many helpful and constructive comments and suggestions have helped us to significantly improve this work.
References
[1] A. K. Jain et al., ''Data Clustering: A Review'', ACM Computing Surveys, vol. 31, no. 3, 1999. http://dx.doi.org/10.1145/331499.331504
[2] Stuart P. Lloyd, ''Least Squares Quantization in PCM'', IEEE Transactions on Information The-ory, vol. 28, no. 2, pp. 129 – 136, 1982.
http://dx.doi.org/10.1109/TIT.1982.1056489 [3] W. S. Sarle, ''Cluster Analysis by Least Squares'',
in Proceedings of the Seventh Annual SAS Users Group International Conference, Cary, NC: SAS Institute Inc, pp. 651 – 653.
[4] D. Arthur and S.Vassilvitskii, ''How Slow is the K-Means Method?'', in Proceedings of the twen-ty-second annual symposium on computational geometry, ACM Press, 2006.
http://dx.doi.org/10.1145/1137856.1137880 [5] M. M. Astrahan, ''Speech Analysis by Clustering
or the Hyperphoneme Method'', Tech. Rep. AIM- 124, Stanford University, 1970.
[6] F. Cao et al., ''An Initialization Method for the K-Means Algorithm Using Neighborhood Model'', Computers and Mathematics with Appli-cations, vol. 58, no. 3, pp. 474 ‒ 483, 2009.
https://doi.org/10.1016/j.camwa.2009.04.017 [7] D. Arthur and S.Vassilvitskii, ''K-means++: The
Advantages of Careful Seeding'', in SODA, pp. 1027 – 1035, 2007.
[8] R. Ostrovsky et al., ''The Effectiveness of Lloyd-Type Methods for the K-Means Problem'', in Symposium on Foundations of Computer Science, 2006.
http://dx.doi.org/10.1145/2395116.2395117 [9] M. Effros and L. J. Schulman, ''Deterministic
Clustering with Data Nets'', in Proc. ISIT, 2004.
[10] F. Khan, ''An Initial Seed Selection Algorithm for K-Means Clustering of Geo-Referenced Data to Improve Replicability of Cluster Assignments for Mapping Application'', Applied Soft Computing,
vol. 12, no. 11, pp. 3698 ‒ 3700, 2012.
https://doi.org/10.1016/j.asoc.2012.07.021 [11] K. K. Pavan et al., ''Single Pass Seed Selection
Algorithm for K-Means'', Science Publications – Journal of Computer Science, vol. 6, no. 1, pp.
60 ‒ 66, 2010.
[12] V. Birodkar and D. R. Edla, ''Enhanced K-Means Clustering Algorithm using A Heuristic Ap-proach'', Journal of Information and Computing Science, vol. 9, no. 4, pp. 277 ‒ 284, 2014.
[13] D. Chaudhuri and B. B. Chaudhuri, ''A Novel Multiseed Nonhierarchical Data Clustering Tech-nique'', IEEE Transactions on Systems, Man, and Cybernetics ‒ Part B: Cybernetics, vol. 27, no. 5, 1997.
http://dx.doi.org/10.1109/3477.623240
[14] Md. A. Rahman et al., ''ModEx and Seed-De-tective: Two Novel Techniques for High Qual-ity Clustering by using Good Initial Seeds in K-Means'', Journal of King Saud University ‒ Computer and Information Sciences, pp. 93‒236,
2015.
https://doi.org/10.1016/j.jksuci.2014.04.002 [15] M. Tian et al., ''An Automatic Histogram-based
Initializing Algorithm for K-Means Clustering in CT'', in Proceedings des Workshops Bildverarbe-itung für die Medizin, Heidelberg, Germany, pp.
277 ‒ 282, 2013.
[16] S. Epter et al., ''Detection and Initial Seed Se-lection in Large Data Sets'', SIAM Workshop on Clustering High Dimensional Data and its Appli-cations, Arlington, (with SIAM data mining con-ference), April 2002.
[17] Md. A. Rahman et al., ''DenClust: A Density Based Seed Selection Approach for K-Means'', ICAISC: Artificial Intelligence and Soft
Comput-ing, pp. 784 ‒ 795, 2014.
[18] R. A. Fisher, ''Iris Data Set'', in: R. A. Fisher (Ed.), UC Irvine Machine Learning Repository, 1936. http://archive.ics.uci.edu/ml/machine-learning- databases/iris/iris.data
[19] P. Collard, ''Philippe Collard's Cloud Cover Data'', 1989.
ftp://ftp.ics.uci.edu/pub/machine-learning-data-bases/undocumented/taylor/cloud.data
[20] W. J. Nash et al., ''Abalone Data Set'', in: S. F. Division (Ed.), UC Irvine Machine Learning Re-pository, 1994.
http://archive.ics.uci.edu/ml/machine-learning-databases/abalone/abalone.data
[21] C. D. Manning et al., ''Introduction to Information Retrieval'', Cambridge University Press, 2008. https://www-nlp.stanford.edu/IR-book/ Table 1. Reduction% of SSE (normalized) of proposed method vis-à-vis interval based method,
Random K means, K Means++ (20 trials).
Dataset Clusters Proposed method Interval based method SSE
Reduction% of SSE with
Interval based
Random K means SSE
Reduction% of SSE with random K
Means
K means++ (20 trials)
SSE
Reduction% of SSE with K Means ++ Best
when
α SSE
Iris 3 0.6 0.004761141 0.004761141 0% 0.004761141 0% 0.00484622 1%
Cloud
Cover 50 0.8 0.00003522 0.00005123 31% 0.00003865 9% 0.00002906 ‒21%
Abalone 25 0.8 0.000101299 0.00015423 34% 0.0001050 4% 0.0001412 28%
Ionosphere 2 0.6 0.01701439 0.02604707 35% 0.0680575 75% 0.0170143 0%
Wine 3 0.6 & 0.8 0.0074268 0.00763966 2% 0.00668192 ‒11% 0.0076396 2%
Glass 2 0.6 0.009820371 0.00982841 0% 0.00983212 0% 0.0098284 0%
Synthetic data
5 0.6 & 0.8 0.001903122 0.00310363 39% 0.00190359 0% 0.0019237 1%
7 0.6 & 0.8 0.001009916 0.00289865 65% 0.00101038 0% 0.0010099 0%
Table 2. Comparison of time of execution in seconds of proposed method vis-à-vis interval based method, Random K means, K Means++ (20 trials).
Dataset Clusters Best α Proposed method Interval based method K means++ (20 trials) SSE
Iris 3 0.6 0.69 0.05 0.04
Cloud Cover 50 0.8 3.11 0.44 1.89
Abalone 25 0.8 18.03 2.74 3.04
Ionosphere 2 0.6 1.24 0.08 0.07
Wine 3 0.6 & 0.8 1.49 0.08 0.07
Glass 2 0.6 1.51 0.07 0.08
Received: April 2017
Revised: October 2017
Accepted: October 2017
Contact addresses: Sajidha Syed Azimuddin School of computing sicence and engineerg VIT, Chennai India e-mail: [email protected]
Kalyani Desikan Department of mathematics School of Advanced Sciences VIT, Chennai India e-mail: [email protected]
Sajidha Syed azimuddinis a selection grade assistant professor in the
School of Computing Science and Engineering, VIT, Chennai, India. She is currently pursuing her PhD in the area of data mining at VIT Chennai. She also holds the Bachelor's and Master's degrees in com-puter science and engineering from Manonmanium Sundaranar Uni-versity and Anna UniUni-versity, Chennai, respectively. So far, Ms Syed Azimuddin has published 4 research papers in various national, inter-national journals and conferences.
Kalyani deSiKanis a professor of mathematics in the School of