The Influence of Different Stocking Densities on Biochemical
Composition of Rainbow Trout Meat Reared in a
Recirculating Aquaculture System
Mirela Cre
ţ
u
*, Victor Cristea, Lorena Dediu, Stefan Mihai Petrea
“Dunarea de Jos” University of Galati, Aquaculture, Environmental Sciences and Cadastre Department, 800149-Galati, Dr. Alexandru Carnabel, 6, Romania
Abstract
The aim of this study is to evaluate the biochemical composition of rainbow trout meat, reared in a recirculating aquaculture system, at different stocking densities (DS1-2.64 kg/m3, DS2-5.16 kg/m3, DS3-7.12 kg/m3, DS4-9.42
kg/m3). The analyses were performed in the research laboratory of Aquaculture, Environmental Science and Cadastre
Department–Faculty of Food Science and Engineering, from ,,Dunarea de Jos’’University of Galati. The content of meat proteins, fats, dry substance and ash was determined. After a 33 days experimental trial, the biochemical analysis of meat from all four experimental variants shows that protein content was higher in DS1 and DS4 variants,
while the smallest amount of fats was quantified at DS1 and DS2 variants, without significant differences (p>0.05) for
none of the biochemical compounds analyzed, at the mean comparison on experimental variants. Thus, it can be concluded that biochemical composition of rainbow trout meat was not influenced by the tested stocking densities. Keywords: meat biochemical composition, rainbow trout, recirculating aquaculture system, stocking densities
1. Introduction
Lately there is a real concern of consumers and authorities regarding animal welfare in both terrestrial and aquatic environment. In contradiction with terrestrial farm animals, where there are regulations regarding the minimum area required for each animal in order to ensure basic physiological and behavioural needs, in aquaculture there are no regulations regarding the densities at which fish can be farmed [1].
Considering its nutritional value (high protein and lipid content with superior biological value and high digestibility), fish has always held an important proportion in human alimentation.
Stocking density has a significant effect on growth performance and feed conversion. High stocking density conditions has been reported to decrease growth in salmonids due to different factors such
* Corresponding author: Mirela Creţu
Tel: 0740664885, Email [email protected]
as low feed consumption and social interactions or inappropriate water quality [2], factors which may affect the biochemical composition of fish.
Biochemical composition is the main element based on which we can evaluate the nutritional value of meat. Generally changes in chemical composition of body have been known to reflect storage or depletion of energy reserves. The values of body composition in fishes vary considerably within and between species, with fish size, sexual condition, feeding, time of the year and activity [3-5]. Food composition, environment and genetic trait are also known to influence chemical composition of fish [6].
2. Materials and methods
The study was conducted at the experimental recirculating system of Aquaculture, Environmental Sciences and Cadastre Department, "Dunărea de Jos" University of Galati. The recirculating system was described in our precedent papers [7].
The configuration of the pilot recirculating system was sized according to specific technology and consists in 4 glass rearing units of 0.320 m3 each
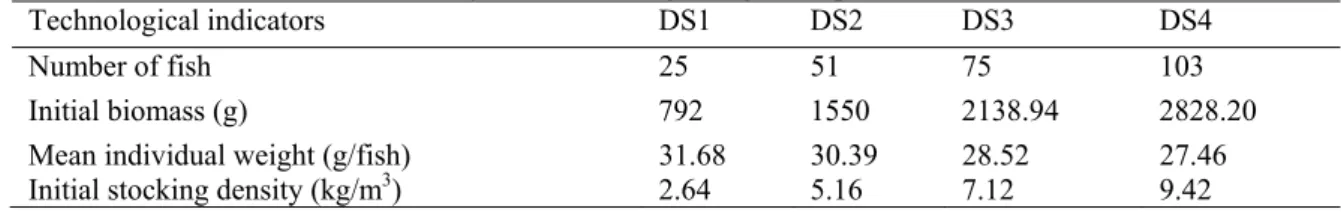
(40×80×100 cm) and two water quality conditioning units. For this trial, 254 rainbow trout fingerlings (mean body weight 29.51±1.32 g) were divided in four rearing units in order to create different stocking densities (Table 1).
Table 1. The synthetic table regarding the experimental version
Technological indicators DS1 DS2 DS3 DS4
Number of fish 25 51 75 103
Initial biomass (g) 792 1550 2138.94 2828.20
Mean individual weight (g/fish) 31.68 30.39 28.52 27.46
Initial stocking density (kg/m3) 2.64 5.16 7.12 9.42
The daily ratio was 3% of total body weight per day (for the first six days), respectively 4% of total body weight per day (for the following 27 days of the experiment). Fish were fed manually, two times/day, with Nutra PRO MP-T extruded pellets-50% crude protein and 20% lipids (Table 2).
Table 2. Biochemical composition for the Nutra PRO MP-T
Composition %
Crude protein 50
Crude fats and oils 20
Crude fibre 0.7
Crude ash 8
Sodium 0.4 Calciu 1.0 Phosphorus 1.2
Vitamin A 6000UI/Kg
Vitamin D3 1200UI/Kg
Ingredients: fish meal, fish oil, full fat soybean, soybean oil, wheat gluten, sunflower flour, wheat and wheat products
In order to determine the biochemical composition of fish, 10 rainbow trout were sampled both at the start and at the end of the experiment. The biochemical determinations were performed on muscle tissue samples and later, from the mixture, homogeneous samples were taken. The proximate composition of fish was determined using the procedure described by the [8]. Proteins were determined with Gerhardt type equipment by using Kjeldahl method; fats were determined by
of 105±2ºC using Sterilizer Esac and ash was evaluated by calcification at temperatures of 550±20°C in a Nabertherm furnace.
The main indicators used for the evaluation of biochemical meat compositions were a follows: • Protein efficiency ratio (PER)
PER=(Bf-Bi)/(FxPB),where:
F=quantity of fed administrated (Kg) PB=amount of fed protein (%) • Protein utilisation efficiency
(PUE)=100(Bf x Pf–Bi x Pi)/(F XPB) (%), where: Pf=final body protein (%)
Pi=initial body protein (%) • Retained protein (RP):
PR=final individual weight x Pf –initial individual weight x Pi.
• Retained lipids (RL):
LR=final individual weight x Lf– initial individual weight, where:
Lf=final body lipids (%) Li=initial body lipids (%)
Nitrogen-free extractives (NFE):
NFE=Dry matter-Ash- (Lipids+Protein) (%) The data were statistically analyzed, in Microsoft Excel 2010, using descriptive statistics and ANOVA test.
3. Results and discussion
situated into normal range for optimal growth (O2–8.54±0.91 mg/l; temperature–16.10±0.07ºC;
nitrite–0.15±0.04mg/l; nitrate 18.06±1.01mg/l; ammonia–0.14±0.03mg/l).
At the end of the experiment, the stocking density
registered a value of 6.73 kg/m3 in DS1, 15.35
kg/m3 in DS2, 20.46 kg/m3 in DS3 and 26.42
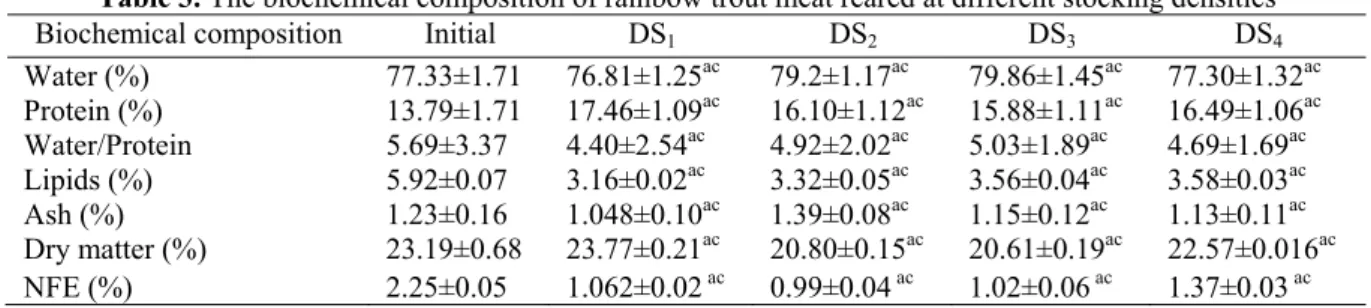
kg/m3 in DS4. Result of biochemical analysis of
rainbow trout meat held at different stocking densities are prezented in Table 3.
Table 3. The biochemical composition of rainbow trout meat reared at different stocking densities Biochemical composition Initial DS1 DS2 DS3 DS4
Water (%) 77.33±1.71 76.81±1.25ac 79.2±1.17ac 79.86±1.45ac 77.30±1.32ac
Protein (%) 13.79±1.71 17.46±1.09ac 16.10±1.12ac 15.88±1.11ac 16.49±1.06ac
Water/Protein 5.69±3.37 4.40±2.54ac 4.92±2.02ac 5.03±1.89ac 4.69±1.69ac
Lipids (%) 5.92±0.07 3.16±0.02ac 3.32±0.05ac 3.56±0.04ac 3.58±0.03ac
Ash (%) 1.23±0.16 1.048±0.10ac 1.39±0.08ac 1.15±0.12ac 1.13±0.11ac
Dry matter (%) 23.19±0.68 23.77±0.21ac 20.80±0.15ac 20.61±0.19ac 22.57±0.016ac
NFE (%) 2.25±0.05 1.062±0.02ac 0.99±0.04ac 1.02±0.06 ac 1.37±0.03ac
a-insignificant differences between the experimental variants, p>0.05 b-significant differences between the experimental variants, p<0.05 c-insignificant differences from initial moment, p>0.05
d-significant differences from initial moment, p<0.05
Water, crude lipid and ash content of the whole body of rainbow trout was not significantly (p>0.05) affected by the stocking densities. The highest percentage of protein was recorded in DS1 variant (17.46±1.09%), DS4 (16.49±1.06%) and
DS3 (15.88±1.11%), registering an increase with
26.61%, 19.58%, respectively 16.75%, in comparison with the initial moment of the experiment. Regarding the water content, it can be observed that lower values were registered for DS1
and DS4 variants (76.81±1.25%, 77.30±1.32%).
In order to evaluate the nutritional value and maintenance status of rainbow trout meat, we also calculate the Water/Protein rapport. As the value
of W/P ratio is lower, the nutritional value becomes higher [9]. At the initial moment of the experiment, the rainbow trout meat has a W/P value of 5.69±3.37 and at the end of the experimental days W/P registered a decrease in case of all the stocking densities: 4.40±2.54 at DS1, 4.92±2.02 at DS2, 5.03±1.89 at DS3,
respectively 4.69±1.69 at DS4.
The lowest quantity of lipids was quantified for DS1 and DS2 variants were the lipid content was
3.16±0.02% and respectively, 3.32±0.05%.
In all tested stocking densities, the values obtained for biochemical composition of rainbow trout meat confirm those present in literature (Table 4).
Table 4. The biochemical composition of rainbow trout meat
(%) [10] [11] [12] [13] [14] [15]
Protein 13.70 18.88 19.60 20 18.33 17.13
Lipid 5.50 2.94 4.43 3.8 7.64 9.07
Moisture 77.20 77.03 71.65 75 73.52 71.94
Ash 2.0 1.15 1.36 1.2 1.28 1.45
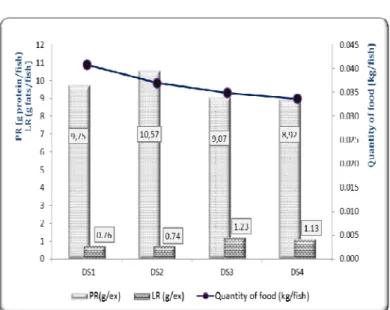
In order to evaluate the efficiency of nutrient retention at juvenile rainbow trout, for each experimental variant were calculated the most suitable indicators as follows: retained protein (RP), retained lipid (LR), protein utilisation efficiency (PUE) and protein efficiency ratio (PER).
Generally PER depends on the increasing of body
weight and feed protein content, so the higher the individual growth become, the more PER value increases.
From Figure 1 it can be observed an accumulation of large quantities of protein in case of DS2 (10.57
Figure 1. Graphical representation of protein retention (PR) and lipids retention (LR) in relation with the quantity of feed administrated
Also, the analysis of PER and PUE evolution shows that protein was best quantified in DS2
experimental variant, where also the highest
biomass weight was obtained at the end of the experiment (92.22±22.65 g/ex.).
Figure 2. The protein retention efficiency (PER) and protein utilization efficiency (PUE)
4. Conclusions
After the analysis of rainbow trout meat biochemical composition, having as variable different stocking densities conditions, it can be concluded that higher stocking densities applied did not lead to significant changes for any of the biochemical compounds analyzed.
of higher stocking densities, facts that can lead, on the long term, to the production of low market values fish. This can be caused by lack of exercise for fish reared in high stocking densities, resulted in diminishing the metabolic limiting level and growth of their fat reserves.
5. References
1. North B. P., Ellis T., Turnbull J. F., Davis J. and Bromage, N. R., Stocking density practices of commercial UK rainbow trout farms, Aquaculture 259, 2006, 260–267.
2. Cristea, V. (Creţu) Mocanu, M., Antache, A. Docan, A., Dediu, L., Ion (Placinta), P. and Coadă, M. T., Effect of Stocking Density on Leuckocyte Reaction of Oncorhynchus mykiss (Walbaum, 1792), Animal Science and Biotechnologies, 2012, 45 (2), 31-36. 3. Fauconneau, B., Alami-Durante, H., Laroche, M., Marcel, J. and Vallot, D., Growth and meat quality relations in carp, Aquaculture, 1995, 129-265-297. 4. Butchtova, H., Svoboda, Z., Križek, M., Vacha, F., and Kocour, M. V., Fatty acid composition in intramuscular lipids of experimental scaly crossbreds in 3-yer-old common carp (Cyprinus carpio L.), Acta Veterinaria Brno, 2007, 76, S73-S81.
5. Menoyo, D., Lopez –Bote, C. J., Diaz, A., Obach, A. and Bautista, J. M., Impact of n-3 fatty acid chain lenght and n-3/n-6 in Atlantic salmon (Salmo salar) diets, Aquaculture 2007, 276, 248-259.
6. Oni, S. K., Olayemi, J. Y. and Adegboye, J. D., The comparative physiology of three ecologically distinct freshwater fishes: Alestes nurse RUPEL,Synodontis schall. Block and Schneeide and Tilapia zilli Gervais, J. Fish. Biol., 1983, 22, 105-109.
7. Mocanu (Creţu), M., Cristea, V., Dediu, L., Dicu, D., Docan, A. and Ionescu, T., The influence of different stocking densities on growth performances of Oncorhynchus mykiss (Walbaum, 1792) in a recirculating aquaculture sistem Iaşi, Volumul de
Lucrări Ştiinţifice-Seria Zootehnie, 2011, 56 (16), 326-331.
8. Association of Official Analytical Chemists (AOAC), 17th Edition, A. O. A. C., Washington DC, 2000, 21, 447.
9. Mocanu, E. E.,Innovative technologies for obtaining the maximum safety of fishery products for consumer health, PhD Thesis, 2011, Universitatea Dunărea de Jos, Galaţi.
10. Phillips, A. M. and Brockwey, D. R., Nutrition of trout Protein i carbohidrate, Prog. Fish. Cutt., 1956, 159, 18.
11. Bud, I., Ladesi, D., Reka, S. T. and Negrea, O., Study concerning chemical composition of fish meat depending on the considered species. Zootehnie si Biotehnologii, 2008, 42, 2, 201–206.
12. Celik, M., Gocke, M., Basusta, N., Kucukgulmez A. and Tasbozan, Tabakogly S., Nutritional quality of rainbow trout (Oncorhynchus mykiss) caught from the Ataturk Dam lake in Turkey, Journal of Muscle Foods, 2008, 19, 1, 50–61.
13. Grujić, R., Nauka o ishrani čoveka, Izdavač Tehnološki fakultet, Atlantik, Banja Luka, 2000. 14. Plavša, N., Baltić, M., Sinovec, Z., Jovanović, B., Kulišić, B. and Petrović, J., Uticaj ishrane obrocima različitog sastava na kvalitet mesa kalifornijske pastrmke (Oncorhynchus mykiss Walbaum). Savremeno ribarstvo Jugoslavije- monografija, radovi saopšteni na IV Jugoslovenskom simpozijumu “Ribarstvo Jugoslavije”-Vrašac, Beograd,2000.