Level
of
Service
Measures
for
Biking:
A
Comparative
Analysis
of
Calculation
Methods
Matthew
M.
Day,
MRP
Abstract
Traditional
methods
forcomputing
levelof
service(LOS)
have
implicitlyfavored
mobility at theex-pense
of
accessibility.The
LOS
concept
was
developed
by highway
engineersinthe 1950s
asamethod
of measuring
thelevelof
mobilityprovided
by
acertain facility(FDOT,
2002). Ithas
been
applied inrecent years to alternative transportation
modes
such
aswalking,
bicyclingand
public transit.This
article
analyzes
and compares
the resultsof applying
severalof
theLOS
methods
thathave been
devel-oped
for alternative transportationmodes
to astudy
areainChapel
Hill,North
Carolina.Introduction
Traditional
methods of measuring
thelevelof
service(LOS)
focus narrowlyupon
mobility, asdeterminedby
therelationshipof
facility capacitytovolume
of
traffic, while ignoring accessibility. In the field
of
transportationplanning,mobilityhasbeen definedas
theability toget
from one
placetoanother(Hansen,1959;
Handy.
1994). Accessibility,by
contrast,hasbeen
definedas the potentialfor interaction. Inother words, mobility is ameasure of
how
easily a user canmove
throughafacility;accessibility,ontheotherhand,
measures
how
easily a usercan reach
a destinationusing afacility.When
accessibilityis low. a person'sabilitytoreacha destination is
compromised.
TraditionalLOS
measures
do
notcapturethiseffect.Under
traditionalLOS
measures,corridorswith highlevelsof mobilitywillscorehigh
on
traditionalLOS
methods,regardlessof
whether
theyofferaccessibility. Inmany
cases afacilitywillofferhigh mobilitybut
low
accessibility.or vice versa.
For
example,
acommunity
withabundant
roads
and
littlecongestion
butwith
relatively
few
destinations forshopping
or otheractivities displays
poor
accessibility butgood
mobility.
An
area featuringhighlevelsof congestionbutrelativelyshort distances
between
where
residentslive
and
allneeded and
desired destinationshasgood
accessibility butpoormobility.
A
more
accuratemeasure of
level ofservicewould
considerboth themobility
and
accessibility offeredby
afacility(Levine
and
Garb.2002
). Recently,new
LOS
methods emphasizing
accessibility havebeen
developed.
These
new
measures
allow planners,engineers,
and
others todetermine the accessibilityoffered
by
a broad rangeof
transportation facilities.Matthew
M
Dav
is a graduate of the University of NorthCarolina Departmentot Cityand RegionalPlanning.
He
iscurrentlyworkingasa TransportationEngineerattheNorth
Carolina Department of Transportation in the Western
including roadways, transit facilities,
and
facilitiesconstructed forpedestrians
and
bicyclists.This paperuses aselection ofaccessibility-based
LOS
measures
thathave been developed
for pedestrian,bicycle,
and
transit facilities toanalyzethedowntown
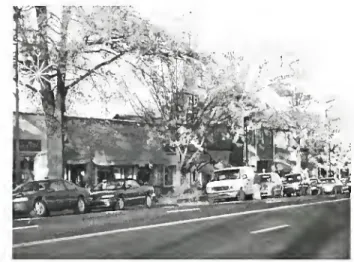
areaofChapelHill,NorthCarolina,(seeFigure1)
where
traffic levels are low and walking, biking, and publictransitarepopular
modes
ofmoving from
placeto place.Figure 1. Franklin Street in
Chapel
Hill,NC
is apedestrian
and
bike-friendlyroadway.
Photo by
Helen
Chanev.Capacity-based
LOS
standardsThe
Highway
Capacity-Manual
{HCM)
isthestandardmethodological guideintheUnitedStates for
computing
automobile levelofservice
(FDOT,
2002).For
modes
of
transportation other than private automobiles (forwhich
theHig/nvcn- Capacity-Manual
method, thoughflawed,isgenerallyused),thereislessagreement
among
transportationplannersandengineers astoanacceptable
approach
forcomputing
levelof
service.The
TransportationResearch
Board
(TRB)
hasdevelopedaTransit
Capacity
and
Qualityof Senice
Manual
(TCOSM)
that outlinesmany
differentmethods of
computing
LOS
fortransitservicesbasedon
capacity/mobility,accessibility,andqualitymeasures(Kittelson,
1999).
Some
authors suggestthatcharacteristicsof
thebuilt urban environment (Jaskiewicz,
no
date) or thesocialor policyenvironment
(Hoehner
ctal.,2003)
arealso factorsthatinfluence thelevelofservice thataperson
perceives
on
aparticularnon-automobilefacility.Non-capacity Level of Service
Models
Several accessibility-based
LOS
models have been
developedtoevaluatebicyclistandpedestrianperceived
safetywith respectto
motor
vehicletrafficand
comfortinusingthe
roadway
corridor.The
most
popularmethods
fordeterminingPedestrianLevel ofService
(PLOS)
include thePLOS
method, developed bySprinkleConsulting,and
theFruinPLOS
method, which
is included in theHighway
SafetyManual.
Emerging
national standards forevaluatingthebike-friendlinessofa
roadway
are theBicycle Levelof
Service(BLOS)
method, developedby
SprinkleConsulting,andtheBicycle CompatibilityIndex(BCI),
developed by
the FederalHighway
Administration(FHWA).
The
TransitLevelofService(TLOS)
method,developed bytheFloridaDepartment ofTransportation,
computes
levelofservicebasedon
availabilityof
transitwithin awalkingdistance.
Each
ofthesefivemethods
aredescribedindetailinthefollowingsections.
While
some
ofthese models focusupon
traveldemand
and
facilitycapacity,othersarebased
upon
awider rangeof
factors,suchas accessibility,environmentalquality,
and
safety.
LOS
methodolgies for pedestrianand
bicyclist travelcan beuseful toplanners ina varietyofways.
These
tools can help planners to identify
weak
links in anetwork ofsidewalks or bicyclefacilities,forexample.
Level
ofService
Measures
for Bikingprioritizesitesneeding improvement. Plannerscan use
thebicycle
LOS
measurestodeterminewhich
routestoincludeinthebicycle network.
They
may
alsouse themeasures to createa bicycle
map, which
can help the publicinchoosingwhich
routesto take.Pedestrian Level
of
Senice
Method, developed
by
SprinkleConsulting
The
FloridaDepartment ofTransportation(FDOT)
usesamethodologyforcomputingpedestrianlevelofservice
that
was
createdby
SprinkleConsultingandisbasedon
four
major
physical characteristicsof
the streetand
sidewalk space: presence
of
a sidewalkand
lateralseparationfromstreet;motorvehiclevolume;trafficspeed;
and drivewaytraffic
volume
andaccessfrequency(Landisetal.,
200
1 ).The
creationofthemodel
involved asurveyanda regressionanalysisofthesurveyresults.
The
firmfirst conducted a pedestrian facility quality survey in
Pensacola. Florida, asking users about environmental
factors,includingwidthofsidewalk,width ofbikelane, presenceof sidewalkbuffer,
volume
and speed oftraffic,and
number
oftrafficlanes,among
others.Second,thefirmanalyzedthe resultsofthesurveyusing
a regression analysis, in order to determine
which
environmental factors were
most
closely related totheusers'perceivedqualityofthe facilities
(FDOT.
2002). Inalaterstudy,thefirmsoughttodeterminewhethertwo
otherfactors
—
thepresenceofother pedestriansandthe presenceofbuildings againsttheedge of asidewalk—
wererelatedtotheperceivedqualityofpedestrianfacilities,
buttheyfoundthatnosuchrelationship existed.
The
PLOS
method
isfocusedprimarilyupon
physicalcharacteristics
of
theroadway
and
sidewalk
environment,
and
it provides a simplemethod
forcomputing
LOS
along asegment of
the road/pathnetwork. This
method
was
chosen becauseitisrelativelyobjective
and
easilyconverted
into auniformly-applicable levelofservicemeasure.
The
basicequationthatthisPLOS
method
utilizesis
(FDOT,
2002):PLOS
=
-1.2276InfWol
+
Wl
+
fp *%OSP
+fb*Wb
+
fsw *Ws)
+
0.0091(Vol15/L)+
0.0004 *SPD2
+
6.0468(forEnglishunits)
where,
Wol
=
widthofoutside laneoftraffic(includingon-streetparkingarea);
Wl
=
width ofmarked
shoulderormarked
bicycle lane;fp
=
on-streetparkingcoefficientorfactor (0.2usedinanalysis);
%OSP
=
percentofsegment
withon-streetparking;
fb
=
sidewalkbufferfactor;Wb
=
width ofbufferbetween
streetandsidewalk;
fsw
=
sidewalkcoefficientorfactor(equals6-0.3*
Ws);
Ws
=
width ofsidewalk;Vol
15=
volume
ofdirectionalmotor
trafficinpeak 15-minuteperiod;
L
= number
ofdirectionalthroughlanes;SPD =
average speedof
motor
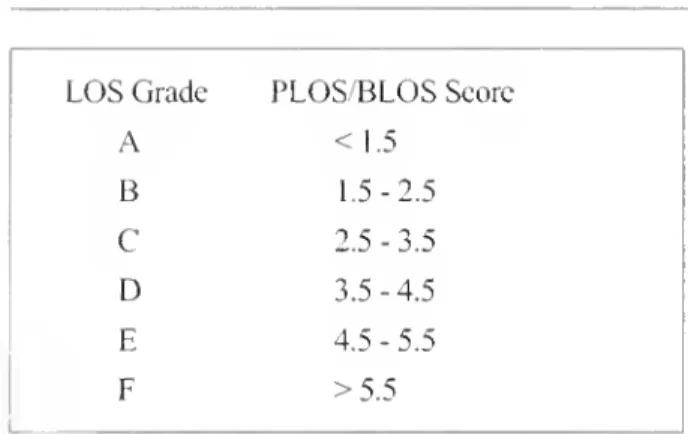
vehicletraffic.Under
thePLOS
method.LOS
iscalculatedforbothsidesof eachroad
segment
beingstudied;gradesareLOS
Grade
PLOS/BLOS
ScoreA
<
1.5B
1.5-2.5C
2.5-3.5D
3.5-4.5E
4.5-5.5F
>5.5
Fruin Pedestrian Level
of
Service Method,developed
by
Fruin
and
included
in theHighway
Capacity
Manual
The
Fruinmethod,which
requires the inputofpedestriancount data, can provide useful information about the
capacityofthe sidewalksin high-traffic locations,and determine whetherthereisaneedforadditionalsidewalk
capacityin theselocations.
The
Fruinmethodology
isdefinedby
thefollowingequation
(TRB,
2000):Pedestrianunitflowrate
=
V
15/(15 *We)
where,
VI
5=
peak
15-minute
pedestrian traffic rate (persons per 15-minutcs);We
=
effectivewidth ofsidewalk.The
flowrategeneratedby
theequationabove
isusedtodeterminea
LOS
gradefora pedestrianfacilitybasedonthestandardsbelow.
LOS
Grade
Flow
(persons/min/ft)A
<5
B
5-7
C
7-
10D
10-15
E
15-23
F
>23
The
Fruinmethod
is a capacity-basedmethod
and
assumes
thattheprimary determinantofqualityservicein the pedestrian environment is the ability to
move
through that environment with as little
impedance
as possible.BicycleLevel
ofSennce
Method, developed bySprinkleConsulting
SprinkleConsultingdevelopeda
BLOS
method
fortheFlorida
Department
ofTransportation.Thismethod,likeFruin's,isbased
upon
physicalcharacteristicsoftheroadandbicyclefacilitiesbutfocusestoa greater extent than the Fruin
method
upon
the presenceand
qualityof
bicyclefacilities
and
the characteristicsofmotor
vehicletraffic, including the volume, speed,
and
number
ofheavy
trucks (see Figure 2).The
various data arecombined
intoaLOS
scorebasedon
a regressionmodel
(FDOT,
2002).Figure
2.The
quality ofbike
facilities,such
asbike
lanes,may
affectacyclist'sBLOS.
Photo
by
Level
ofService
Measures
for Biking 7This particular
method
includes a factoronroadway
condition,
which
isa variable not included intheBCI
method
(discussed below). Otherfactorsincludemotor
vehicletraffic
volume
andspeed,effectiveoutside lane width,andamount
oftrucktraffic.Bicycle Level
of
Service isdefinedby
thismodel
as
(FDOT,
2002):BLOS
=
0.507 ln(Voll5 /L)+
0.199* SPt* (1+
10.38*
HV)2
+
7.066 *(1/PR5)2-0.005 *
We2
+
0.760(forEnglishunits)
where.
Vol
15=
volume
ofdirectionaltrafficin 15-minute peakperiod;L =
totalnumber
of throughlanes;SPt
=
effective speed limit(1.1199 ln(SPp-20)+
0.8103,
SPp
=
postedspeed);HV
=
percentheavy
trucks;PR5
=
FHWA
5-point surfaceconditionrating;We
=
averageeffectivewidthofoutside lane(lanewidthlessobstructions).
Levelofservice gradesareassigned forbothsides of
each road
segment
beingstudiedusingthesame
scaleas forthe
PLOS
model
(see previous).Bicycle CompatibilityIndex Method, developedbythe
Federal
Highway
AdministrationThe
FederalHighway
Administration(FHWA)
has developedaBCI
thatservesasameasure ofquality fordifferentroads in terms ofbicycletraffic.
The
BCI
issimilarto the aforementioned
FDOT
pedestrian andbicycle level
of
service methods, in that it primarilyfocuses
on
physicalcharacteristicsofthe road,suchas thepresence ofbicyclelanesorthevolume
ofautomobileandtrucktraffic,and
combines
them
intoameasure offacility quality that is not based entirely
on
capacity(FHWA,
1998).While
theFDOT
and
FHWA
methods
of
computing
BLOS
examine
similarcharacteristicsofthebicyclist'senvironment,the
two
modelsusedifferentcriteriaweightsand could produce verydifferentresults.
The
FHWA
method
isdifferentfrom
theSprinkleBLOS
method
inthatitaccounts forthepresenceofabicyclelane, thetraffic
volume
inlanesother than theoutsidelane, andthepresence,occupancy, andturnoverof
on-streetparking.
The
BCI
uses the following equationtocompute
levelofservice
(FHWA,
1998):BCI
=
3.67-0.966 *BL-0.410
*BLW
- 0.498 *CLW
+
0.002 *CLV
+
0.0004 *OLV
+
0.022 *SPD
+
0.506*PKG
-0.264*AREA
+
AF
where,
BL
=
presenceofbike lane(no=
0,yes=
1);BLW
=
bicycle lanewidth(meters);CLW
=
curblanewidth(meters);CLV
=
curb lanevolume
(peakhour);OLV
=
otherlane(s)volume
insame
direction(peakhour);
SPD
=
85thpercentileof
speed;PKG
=
presenceofparkinglaneoccupiedmore
than30%(no=0,yes=l);
AREA
=
typeof
development
(residential1,other=0);
AF
=
truckvolume
factor+
parkingturnoverfactor+
rightturnvolume
factor.The
gradingscale fortheBCI
ispresentedlater,alongwith a discussiononaproposedadjustmenttothegrading
scale as a result ofthe analysis conducted in Chapel
Transit Level
of
ServiceMethod, developed
by theFlorida
Department of
TransportationThe
FloridaDepartment of
Transportation uses asophisticated
method
for determining transit levelof
service at thesystem, route,and stop levels.
FDOT's
method
isbuiltupon
theframework
setupintheFederalTransitCapacity
and
Qualityof
ServiceManual,
which
suggests
measuring
transit accessibilityby
service frequency,hoursofservice,andservicecoverage. ThisTLOS
method
takesintoaccountthesefactorsand
uses a freedownloadable computer
program.Geographic
InformationSystems(GIS),andspreadsheetsto
compute
LOS
basedon
availabilityoftransitwithin a walkingdistance (based
on
awalking network),given vehicleheadways, andprojected waittimesforindividualroutes
andstops
(Ryus
etal.,2000). Itshouldbe notedthattheTLOS
doesnotaddresswhetherroutesconnectoriginsanddestinationswell,orwhethertransitcustomersare
comfortableandsafe
on
theirtrips.The
transit level ofservice in the Chapel HillTown
Centerwillbe determinedusing a
form
oft£e FloridaDepartment
of Transportation'sTLOS
methodology.The
fullversionoftheTLOS
softwareisasomewhat
burdensome program
touseandrequiresa greatdealof
data that is not always immediately available to the
public; however, theprogram,
which
isdownloadable
fromthe Internetat
no
cost,comes
with a spreadsheetthatallowsfora simplified calculationof
LOS
forroutesegments
and
stops.The
spreadsheet hasfew
datarequirements.
One
can obtain a complete outputby
inputtingonlythescheduledarrivalanddeparturetimes
of buses
—
informationwhich
can be easily obtained fromaschedule book.routesoperatingalongthatsegment,
and
thetimesthatbuses are scheduled to stop at the stops along the
segment.
A
macro
built into the spreadsheet thencalculates the
number
of minutes duringtheday
thatastophasservice availableto it.based
upon
anumber
of
variables, including user-definedmaximum
waittimes at stops,
walking
distances,environmental
characteristics,
and
theuseofstraight-lineornetwork-basedbuffers.
Levelofservice can be
computed two
differentways
usingthisspreadsheetbecausetheuser definesthetimeduration
of
the calculations. IftheuseronlycalculatesTLOS
fora portionof
theday
(i.e.,duringthetimeofservice),the
program
definesalettergradebasedon
thefrequencyofserviceguidelinesintheTransitCapacity
and
Qualityof
ServiceManual,
shown
below
(Kittelson,2001 and
1999).LOS
TLOS
ScoreHeadways*
(%
timeserved)(TCQSM)
A
>
50
%
<
10 minutesB
35.7%
-50%
10-14 minutesC
25%
-35.7%
15-20 minutesD
16.7%
-25%
21-30 minutesE
8.3%-
16.7%
31-60minutesF
< 8.3%
>
60
minutes*assumes
5minutemaximum
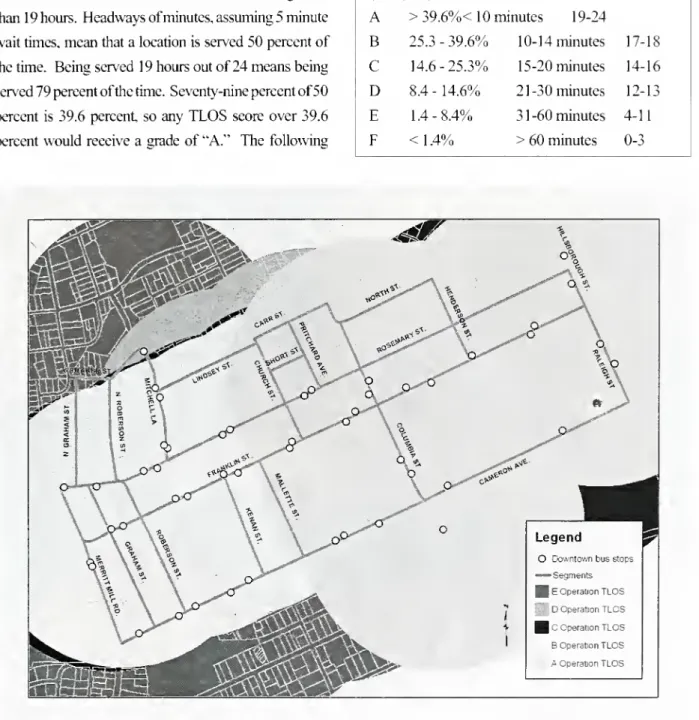
waittimeSee
Figure 3 fora graphic representationof
TLOS
scores for the
Chapel
Hill transitsystem.The
TLOS
routesegment
spreadsheetallowsausertoLevel
ofService
Measures
for BikingOn
theotherhand,iftheuserdefines the calculationperiod asexactly24hours, theLOS
gradeisdeterminedjointlybyfrequencyandhoursofservice. Thisisdone
by
simplymultiplyingthe
TLOS
score standards(intermsofpercenttime served) together to create ajoint standard. For
example
the"A"
standardforheadways
isless than 10minutesandthestandardforhoursofservice isgreater
than19hours.
Headways
ofminutes,assuming5minutewaittimes,
mean
thata locationisserved50percentofthe time. Beingserved 19hours outof 24
means
beingserved79percentofthe time. Seventy-nine percentof 50
percent is 39.6 percent, soany
TLOS
scoreover 39.6percent
would
receivea grade of "A."The
followingtablesummarizesthestandardsfor24-hour
TLOS
grading(Kittclson,2001 and 1999).
LOS TLOS
ScoreHeadways
Hours
Served(TCQSM)
(TCQSM)
A
> 39.6%<
1 minutes 19-24B
25.3-39.6%
10-14 minutes 17-18C
14.6-25.3%
15-20 minutes 14-16D
8.4-14.6%
21-30 minutes 12-13E
1.4-8.4%
31-60minutes 4-11F
<1.4%
>
60
minutes 0-3O
Downtownbusstops-Segments |EOperationTLOS
|DOperationTLOS
|COperationTLOS BOperationTLOS
AOperationTLOS
Figure
3.Example
of buffersused
inTLOS
software
that outlineareas ofChapel
Hill's transitForsimplicityincalculating
TLOS
forthiscomparativestudy, environmentalvalues fortheareas surrounding
stops
were
not calculated. Calculatingenvironmentalvalues
would
haverequiredthedataon
pedestrianfacilityquality as well asjob and population density around
stops.
When
such environmental data arcincluded inananalysis, theresearcher
weighs
the stopsaccordingto the data.
When
such environmental data is notincludedinthe analysis,allstopsareweightedequally.
Methodology
This analysis involves
computing
level ofservice forthevarious
modes
of
transportationintheTown
Centerarea
of
Chapel Hill usingthemethods
outlined in theabove literaturereview as a
means
of
discovering theapplicability
and
benefitsof
existingLOS
methodologies.Chapel Hill isa small city in the
Piedmont
regionof
centralNorthCarolina
and
isincluded intheResearchTriangle region(Raleigh-Durham-ChapelHill). Chapel
Hill's
Town
Centeressentiallycentersaroundtwo
streets.FranklinStreetand
Rosemary
Street,which
runparallelto
one
another.Traffic levelsarelow
inthedowntown
area,
due
in large part toascarcityof parking anda20
mph
posted speed limit. Walking, biking, and publictransitarcpopular formsoftransportation in this area.
The
University of NorthCarolina'smain
campus
isatthe eastern end ofthe
Town
Center.The
Town
ofCarrboroliesdirectly tothewest of Chapel Hill.
Forthepurposesofthisanalysis,a study area
was
defined thatextended one blockfrom
thesouthsideofFranklinStreet
and
fromthenorthsideofRosemary
Street.The
streets in this study area
were
broken into segments,which
generally spannedfrom one
intersection tothenextintersection,with a
few
exceptions. Data usedinthe
analyses
included
GIS
parcel data, aerial photographs, pedestrian andvehicletrafficcounts,andGIS
busstop locationdata. Trafficcountsonindividualstreetsegments
were
estimatedbasedon
known
trafficcountsandestimatedtripendspersegment.
Inaneffortto
compare
differentmethods
ofcomputing
levelofservice,
two
differentmethods
have been usedforeach
mode
oftravel beingstudied. Forpedestrianlevelofservice,the
PLOS
method
developed bySprinkleConsultingis
compared
withthe capacity-based Fruinmethod,
which
isthemethod
presented inthe Higlma)-CapacityManual.
ForbicyclelevelofserviceSprinkleConsulting's
BLOS
calculation iscompared
with theFederal
Highway
Administration'sBCI
calculation.Finally, fortransitlevelofservice,a simplified version
ofFlorida's
TLOS
method
isused.The
TLOS
method
includes
two methods of
calculations—
onewhich
isbased
upon
frequencyofserviceand
anotherwhich
isbased
on
frequencyand hours ofservice.BothoftheseTLOS
methods
arcemployed
inthe analysis.Findings
PedestrianFacilities
The two methods
utilizedforcalculatingpedestrianlevelof
serviceyieldedwidelydivergentresults.The
Fruinmethod
paintsa pictureof
excellence inChapel Hill'spedestrianenvironment. Allofthelocationsfor
which
theFruin
method was
applied received aLOS
grade of"A."
The
PLOS
model,on
theotherhand, provides amore
variedpicture.PLOS
gradesforthetown
centerrangedfrom
"A"
to "E." withmost
facilities fallinginthemiddleoftherange
("B"
or "C").The
variation in scoresproduced
by
thetwo models
Level
ofService
Measures
forBiking 11Fruinmethod, beinga capacity-basedmethod,basesits
LOS
gradesentirelyon
thevolume
ofpedestriantrafficand
the capacity ofa pedestrian facility.The
Fruinanalysis,
which
was
conductedon
the locationsin theTown
Center study areaforwhich
therewere
recent pedestrianvolume
counts,producedaresultofall"A's"forpedestrianfacilities inthearea.
While
bothmodels
arehelpfulinevaluatingtheLOS
ofpedestrians inChapel Hill, each
model
is basedupon
assumptions
which
aresomewhat
incompatiblewiththeChapel
Hillenvironment.
The
Fruinmethod
is acapacity-based
method and assumes
that the primarydeterminant of
quality service in the pedestrianenvironment
is the ability tomove
through
thatenvironment with as little
impedance
aspossible. InChapelHill's
Town
Center,where
pedestrianflowsare steady,butcertainly notcrush flows,everypedestrianfacilitywillscorean
"A"
(flowisuninterrupted). Clearly,thishas littleutility fordetermining the quality
of
thepedestrianenvironment in thissituation ofexamining
residential
and commercial
streetfronts.The
method
seems
better suited todetermining
adequacy
of
pedestrianfacilities atairports,stadiums,
and
schools,where one would
expect very largecrowds
at certainpeaktimes.
The
PLOS
method, bycontrast,calculatesscoresbasedupon
characteristicsofthepedestrianenvironment. Likemost
level ofservicemodels, thePLOS
model was
developedprimarily foruse
on
arterial highways.As
such,the assumptions
upon which
themodel
isbaseddo
not logicallyapplyto local residential streets. Forexample,
one
assumption ofthePLOS
isthatpedestriansdo
notwalk
inthestreet, but walk, instead,beside theroad
—
eitheron
a sidewalkoron
the grass. Experiencetellsus,however,that
many
peopleinChapelHillwalk
inthestreet
on low-volume
roadswhich do
notfeaturesidewalks.
The
PLOS
model assumes
the carsalwaysactas abuffer.
As
such, thePLOS
model
gives highgradestoside streets
where
on-streetparkingispresent.In reality, streets in
Chapel
Hill featuring on-streetparkingand
no
sidewalksconstitutealess-safepedestrianenvironment,as pedestriansareforced to
walk
further intothestreet.Thisproblemoccurson
severalstreetsinthe
Town
Center study area.To
account for thisinconsistency,
we
mustassume
that for streetswhere
thereis
no
sidewalkbutthereison-streetparking,bothsides
of
thestreetshouldhaveaLOS
gradethatiscloseto thatfound
on
the sideofthestreetthatdoesnothave
on-streetparking.
BicycleFacilities
The
two methods
used forexaminingbicyclelevelof
service
models
show
that bicycle level ofservice islowest
in the areasimmediately surrounding
theUniversityof NorthCarolinacampus.
The
resultsofthe Sprinkle ConsultingBLOS
method
portrayarelativelysafebicyclingenvironmentin
much
of
theChapel
HillTown
Center.Most
areasnorthand
west
of
theintersectionofFranklinand
Columbia
Streets(the
de
factocenteroftown)receiveda scoreofat least"C."
Areas around
theedge
of
theUNC
campus,
however,received gradesof
"D"
and
"E"
forthelargepart.
These
grades are given ineach direction, sincebicycle traffic flows in the
same
direction asmotor
vehicletraffic,
on
theright-handsideofthestreet.The
resultsinthetestcase generallyshow
lowerscoreson
roadswithhightrafficvolumes
and
narrowoutsidelanes. Locationswithon-streetparkingalsogenerally
have
lowerscores than those withouton-streetparking,because this parking is an obstruction
and
potentialturnover.
None
oftheseroadsegmentscontainstripedbicyclelanes,
which
also leadstothelowerscores.The
FederalHighway
Administration'sBCI
method
producedasimilarpatternofresultstothe
BLOS
method
but generally resulted in lowergrades.
The
BCI
alsofound
themost
deficient areas to be those near theuniversity campus, but found the
Town
Center tobemore
deficient overall.Only
Rosemary
Streetand
afew
residentialstreetshaveconsistentlypassingscores,arid
no
segmentsinthestudy areareceived aBCI
gradeof'A."
The
BCI
resultsarcheavily influencedby
theweightingofthe factors in the
BCI
model. Thismodel
includesmore
inputfactorsthantheBLOS
model,which
would
suggestthatitmightbea
more
accurate representationofactual conditions.
The BCI
model, however,seems
to
have
results that are very suspect. Itmay
seem
surprisingthata
low-volume
sidestreetcouldreceive alevelofservicegrade
of
"D." Thisresultinthetestcaseiscausedbytheheavy weightthatthe
BCI
model
gives tothewidthoftheroadway. Consideringthatmany
of
thesesidestreetsarenarrow,the
model
has ascribedtothem
alow
score.Thispointsatthe
same
issuenotedinthesectionabove
pertaining to the
PLOS
model: these levelof
servicemethods were
created primarily for useon
arterialhighways,not
on
sidestreets.The
resultsof
theBCI
model
still havesome
utility.They
point to locations thatcouldcertainlybeimproved
intermsofthebicyclingenvironment.
However,
they are not as useful as theBLOS
results for determining mitigation prioritiesbecause ofthe
skewed
resultsof
theanalysis.Based
upon
the results calculated,theBCI
gradingscaleseems
inadequateforexplaining bicyclelevelofserviceon
minor
sidestreets.Almost
allsidestreets inthestudy areareceivedverylow
gradesundertheinitialgradingscale forthe
BCI
method,duetothe relativelylow
weightthe
BCI
placeson
trafficvolume
andthehighweightitplaces
on
lanewidth and thepresenceofbicycle laneswhich
arcgenerally notfoundon minor
streets. Forthisreason, a modified gradingscale presented
below
was
developedforlow-
volume
residentialstreets. Ingeneral,the
low-volume
roadBCI
grading scale thatwas
developed simply increases the acceptable
BCI
scoreforeach correspondinglettergrade. This
was
determinedtobe asimpler, albeit a lessmethodologically-sound,
method
of modifyingtheBCI
thanattemptingtomodify
the
BCI
equation itself. This grading scalewas
developed
somewhat
arbitrarily.However,
with theoriginal dataused in developing the BCI, it might be
possibletogenerate alessarbitraryrevisedgradingscale for
low-volume
roads.LOS
Grade
High-volume
Low-volume
(original) (adjusted)
BCI
scoreBCI
scoreA
<
1.50<2.0
B
1.51-2.30 2.01-3.0C
2.31-3.40
3.01 -4.0D
3.41 -4.404.01-5.0
E
4.41 -5.30 5.01 -6.0F
>5.30
>6.0
TransitFacilities
As
a baseline determinationoflevelofservice,asimpleone-fourthmilebuffer analysisforeachbus stopinthe
Town
Centerwas
performed.The
entirestudy areawas
determinedtobewithin one-fourthmileofabusstop.
Level
ofService
Measures
for Biking13
serviceinanarea
would
stopatthispoint.Based
onthissimplespatial accessibility analysis alone, the Chapel
Hill
Town
Centerappearstohaveexcellenttransitservice(referbacktoFigure3).
The
routesegment
worksheet in theTLOS
softwareoffers
two methods
forcomputingtransitlevelofservice.First,a24-hourlevelofservicecan be determinedbased
on
servicefrequencyand
hoursofservice standardsinthe
TCOSM.
Second, an operation-period levelof
service can
be determined based
onlyon
servicefrequency during the hours that a route is in service.
The
two methods
producesimilar,butslightly differentresults. Usinga
GIS
program,itispossibletographicallydisplay the results
and
find spatial patternsand
differencesinthe resultsgenerated.An
examinationof
the 24-hourTLOS
accessibilityresults forChapel Hillrevealsthatservicecoverage is
actually veiy
good
intheTown
Center.While
some
corridors
may
nothave
good
service, there isgood
servicenearby
on
parallelcorridors.Mapping
theTLOS
spreadsheetresultsinGIS
allowsrecoveryofthespatialanalysis that is lost
by
using the simple spreadsheetinsteadofthefull
TLOS
program
tocompute
levelofservice.
Almost
alloftheTown
Centerstudy areafallswithin one-fourthmileofatransitstopwitha
TLOS
of"B"
orbetter—
onlythefarnorthwestcomer
ofthestudyareahaspooraccessibility to
good
transitservice.The
operation-timeTLOS
analysisproduced
similarresults.
The
corridorand
stoplocations thatdo
notmeet
a
minimum
standard ofTLOS
"C"
are identical—
theaccessibility results are almost identical to the results
forthe24-hourTLOS/accessibility.
The main
differencebetween
thetwo methods
isindeterminingthe levelofservice alongFranklin Street,
which
isthemain
streetthrough the study area.
The
operation-time analysisshows
thatduringthetime busesoperatealongFranklinStreet, the frequency ofservice is not as
good
in thewestbound
direction as in the eastbound direction. Informationsuchasthiscould beusefulinshiftingbus schedules tomaximize
headway
efficiency in this corridor.Conclusion
Pedestrian, bicyclist,
and
transit service quality vary widelyacrosstheChapel HillTown
Center. Levelsof servicevary
from
"A"
to"E"
in allmodes
of
transportation. Thereiscertainlyanopportunityforthe
town
to improveconditions in low-scoring areas,and
several potentialmitigationmeasures can be determined
based onthe factorvalues
and
datausedinthevariousLOS
models.Potentialmitigationstrategiesincludetheadditionofsidewalks
and
bicyclelanes,theaddition orremoval ofon-street parking, thespatial
and
temporal additionof
transit service,and
other physical improvements.Many
of these mitigation measures,which
aredesignedtoallow asegment
toreacha passinggradein
one
ofthe levelof
servicemethods,areatoddswith mitigation measures suggested
by
otherlevelof
seivice models. For example, a
PLOS
grade can beimproved
by
addingon-streetparking,butaBLOS
gradeisimproved
by
removingtheparking. Whileitispossible tocontinue adjusting mitigationstrategiesineachmodel
sothestrategy suggestedin
one
doesnotconflictwiththat of another model, it
would
be useful to have astandard
method
forcombining
the variousmodels
across the different
modes
of
travel to ensure thattheneedsofusersineach
mode
can bemet by
aproposedmitigation measure. This type of
model
integrationwould
alsoallowforaholisticapproachto prioritizingimprovement
projects, since automobile, bicycle,and
pedestrian improvementsto
roadways
tendtobemade
14
Day
Level
of
servicecan
be
a very useful conceptualtechniqueforquantifyingthe qualityofatransportation
facility.
LOS
doeshave
itsdrawbacks
as a qualitymeasure,though.
Depending on what
characteristicsareused to determine level ofservice, the results can be
very biased orskewed. Traditionally,
LOS
has beenusedto describe the flow of
motor
vehicle trafficandlevelofcongestion
on
roads. Here,however,thisconcepthas
been
successfullyappliedinaway
thatdeterminesservice quality for
modes
oftransportation otherthanprivate
motor
vehicles.These
methods
are not basedon
capacityand
traffic flow, as thehighway
LOS
methods
are, but insteadon
environmental
characteristics, accessibility,
and
other diversemeasuresof
servicequality ratherthansimplyeaseofuse.Whether
these
methods
adequatelycaptureallthevariablesthataffectthe qualityofa transportationfacilityisdebatable,
but they
do
at least getbeyond
the simple traditionalnotion
of
demand/capacity-basedlevelof
service.The
levelof
servicemodels
usedinthis analysiswere
developedfor
many
purposes.The
BLOS,
BCI,PLOS,
and
Fruinmethods were
developedlargely todeterminethe
adequacy
ofpedestrianand
bicyclefacilitiesalongarterial
highways
and
othermain
roads, similarto theHighway
Capacity
Manual
method
of calculatingautomobile
LOS
(whichis generally appliedtomajorstreetsas partofthemetropolitan planningprocess).
The
TLOS
route spreadsheetmethod
determines
theadequacy of
transit service frequencyand
hoursof
service (although thefull
TLOS
method
alsoaccountsforenvironmentalfactorssuchasthesidewalknetwork
and
density ofresidentsand employees
in an area).Necessarily, these
methods
arenot abletoaccount forallfactors thatinfluencethe qualityofservice
on
agiventransportation facility.
The
differencesinLOS
scoresderived
from
the differentmethods
usedin thisanalysisshow
thatthere issome
need
forintegrationoffactorsand
methods
todetermine
a standardmethod
forcomputing
levelofservicefor alternativetransportationfacilities.
While beyond
thescopeofthispaper, futureresearchcouldbe
done
todetermine whetheradditionalfactorscouldbe
added
tothesecalculations,as wellasdetermine
how
to integratethese variousmethods and
thefactors usedineachmethod.
References
Federal
Highway
Administration."The
Bicycle
Compatibility Index:
A
Levelof
Service Concept." ImplementationManual. ReportNo.FHWA-RD-98-095. 1998.
Florida
Department
ofTransportation.2002
Quality/Level
of
ServiceHandbook.
FDOT:
Tallahassee,2002.Hoehner,
Christine M., et al. "Opportunities forIntegrating
Public
Health
and
Urban
Planning
Approaches
toPromote
Active
Community
Environments."
American
Journalof
Health Promotion.Vol. 18,No. 1 (September/October2003).
Jaskiewicz, Frank. "PedestrianLevel
of
ServiceBased
on
Trip Quality." TransportationResearch
Board
E-Circular
E-C019:
Urban
StreetSymposium.
Transportation Research Board:
Washington
D.C.,no
date.
KittelsonandAssociates. TransitCapacity
and
Qualityof
Service Manual. Transportation Research Board:Washington
D.C.,January 1999.Kittelson
and
Associates,etal. TransitLevelof
Service(TLOS)
Software Users Guide.FDOT:
Tallahassee,Level
ofService
Measures
for Biking 15
Laiidis,Bruce,etal.
"Modeling
theRoadsideWalking
Environment:
PedestrianLevel
of
Service."Transportation Research Record,
No.
1773(200
1 ):82-88.
Levine.
Jonathan
and
Yaakov
Garb."Congestion
Pricing's
Conditional
Promise:
Promotion
of
Accessibilityor Mobility?" TransportPolicy.2002.
Meyer. Michael
D.and
Eric J. Miller.Urban
Transportation Planning.
Second
Edition.McGraw:
Boston,2001.
Rodriguez,Daniel. "TransitService Characterization:
Key
Points." Lecture,January21.2004.Ryus, Paul, et al.
"Development
ofFlorida's Transit Level-of-ServiceIndicator." TransportationResearchRecord
No. 1731 (2000):123-129.Steiner,
Ruth
L. et al. "Refinement oftheRoadway
Segment
Level of
Service."FDOT:
Tallahassee,December
2002.Transportation Research Board. Higinva}- Capacity