I. Abstract
Satellite tobacco mosaic virus (STMV) is a small plant virus that is a member of the icosahedral plus-strand RNA virus family. A large portion of known viruses fall into this family including larger more complex viruses such as poliovirus. STMV is one of the most basic viruses in this family and was thus chosen as a model system on which to study plus-strand icosahedral RNA viruses. Many biological processes in these viruses are RNA-mediated but very little is known about the higher order structures of the RNA. This makes it difficult to determine how RNA structure governs function. Two structures have been proposed for the structure of STMV RNA. However, there is little consensus between the models and very few models of the RNA within the virion exist. We investigated the secondary and tertiary structure of the STMV RNA genome both within and isolated from the virion.
II. Introduction
Importance of RNA Structure in Viral Genome
Icosahedral plus-strand RNA viruses constitute a large and diverse portion of known viruses, including important human pathogens such as poliovirus and hepatitis A.1 The RNA genome of these viruses plays an important role in many biological processes. In addition to encoding viral proteins, the higher-order structure of the RNA genome governs many aspects of the viral replication cycle from packaging to evading degradation by the host cell.2 It has been suggested that viral RNAs sample different structures depending on the functional state of the RNA.6 Two such functional states include the RNA genome when it is packaged within the viral capsid (in virio) and once it is released from the capsid (ex virio). We aim to better understand the function of RNA structure during viral replication by modeling the structure of a viral RNA in both the ex virio and in virio state. This is essential to understanding the virulence of
icosahedral, plus-strand RNA viruses.
of the total nucleotides.4,5 The connections between these helices cannot be visualized by crystallography. As a result, the location of the helices within the genome cannot be accurately determined.
Several global secondary structure models have been proposed for STMV but there is little consensus between models and the field remains controversial. Currently, there are two prominent, opposing structural models. The first model is based on a combination of
crystallographic visualizations, computational modeling and traditional chemical probing
experiments.4-6 It proposes that the RNA exists in an extended linked stem loop structure (shown schematically in Figure 1B). The second model is based on SHAPE analysis and cryo-electron microscopy visualizations. It suggests the RNA structure is dominated by long-range base pairing interactions (shown schematically in Figure 1C).2,7,8 Both structural studies suggest that the secondary structure of the RNA genome plays an essential role in assembly of the viral particle. Due to the large differences between these two models, further experiments and analysis are necessary to build an accurate three-dimensional structure of the STMV RNA genome.
Methods for Characterizing RNA Secondary and Tertiary Structure
Selective 2’-hydroxyl acylation analyzed by primer extension and mutational profiling (SHAPE-MaP) is an approach that can be used to chemically probe the secondary structure of RNA genomes.9 Nucleotides in an RNA can be either constrained due to interactions with other nucleotides or proteins or can be flexible if they lack such interactions. SHAPE reagents, such as 1-methyl-7-nitroisatonic anhydride (1M7), react preferentially with the 2’ hydroxyl of the ribose sugar of flexible nucleotides to form 2’-O-adducts on the RNA. To enable analysis via massively parallel sequencing, a DNA library must be constructed from the original RNA sample using a reverse transcription step. This is carried out under specific conditions that cause the reverse transcriptase to misread SHAPE-modified nucleotides and incorporate a nucleotide
noncomplementary to the original RNA sequence in the newly synthesized complementary DNA (cDNA). Thus, the structure-specific modifications are encoded as mutations in the cDNA. Mutations in the DNA library are then measured by massively parallel sequencing to determine the mutation rate of every nucleotide in the RNA. A high mutation rate indicates a nucleotide that has a high reactivity with 1M7 and is therefore flexible. A low mutation rate indicates a nucleotide with a low reactivity towards 1M7 and is therefore likely constrained. SHAPE-MaP reactivities are used as constraints to model a minimum free energy structure of the RNA. The program assumes that the constrained nucleotides are more likely to be base paired whereas flexible nucleotides are likely to be single stranded.9
structural variations or “breathing” during which nucleotides that are usually constrained and unreactive to DMS become flexible and reactive to DMS. Interacting nucleotides become reactive to the chemical probe in a correlated way. For example, consider two nucleotides involved in a common tertiary interaction: as the structure “breathes” and the tertiary interaction breaks, the nucleotides involved will simultaneously become reactive to DMS. In RING-MaP, experimental conditions are optimized to yield multiple modifications in a single strand of RNA without disrupting the native structure in order to detect the reactivity of both nucleotides. This directly contrasts with SHAPE reagents, which do not modify nearly enough to use for
correlation analysis. As with SHAPE-MaP, these modifications are recorded as mutations in the cDNA library. These mutations are identified by massively parallel sequencing and then
analyzed to detect correlated nucleotide pairs. Nucleotides that are determined to mutate in a correlated fashion are considered to be interacting via either secondary or tertiary interactions. The advantage of this technique is that, instead of simply indicating a particular nucleotide is constrained, RING-MaP identifies the nucleotide with which the interaction occurs.10
Here we investigate the higher order structure of STMV RNA isolated from the virion (ex
virio) and within the virion (in virio) with the aim of understanding the relationship between
III. Methods SHAPE-MaP
STMV Virion and RNA Extraction
Stock STMV virions, ~1.2mL, were dialyzed in a 10K cartridge for 24 hours against 2L SHAPE folding buffer 50nM HEPES pH 8.0, 200mM NaCl, 5mM MgCl2. The virions were then
frozen at -80°C in 50uL aliquots and thawed as needed. To generate data for ex virio and in virio
RNA, virions (from the same initial aliquot) were extracted before or after modification
respectively. To extract the ex virio RNA the samples were incubated with 1mg/mL Proteinase K and 1% SDS for an hour at 37°C. A phenol chloroform extraction was then performed with three phenol extractions and five chloroform extractions. After modification, the in virio RNA was extracted in the same way but with only three chloroform extractions.
SHAPE-MaP and SuperFold
Modification and sample preparation were carried out as detailed in a previous study by Siegfried et al.9Ex virio and in virio RNA samples were incubated in folding buffer at 37°C for 20 minutes. The samples were then modified by treating with one tenth volume 100mM 1-methyl-7-nitroisatonic anhydride (1M7) in DMSO and incubating at 37°C for 5 minutes.
Negative controls were run for each set of samples by treating with the same volume of DMSO. For analysis purposes a denatured control – denatured by incubating in 50% Formamide and 4mM EDTA for 1 minute at 37°C and heating to 95°C for 1 minute - was also treated with 100mM 1M7 and incubated at 37°C for 5 minutes. Reverse transcription was then performed for 3 hours at 42°C in a buffer that uses MnCl2 as the activating divalent. From this cDNA library,
Reactive positions are determined by subtracting the 1M7-modified data from the DMSO-only data then dividing this difference by the denaturing control. These structural insights can be used to predict RNA secondary structure models and are readily applied as a pseudo-free energy change term in the RNAstructure modeling software package.11 To fold large RNAs, the program SuperFold applies SHAPE-MaP constraints in a windowed fashion to model a minimum free energy structure for the RNA. The program uses the current optimum
parameters: slope = 1.8, intercept = -0.6, max base pairing distance = 600. The SuperFold
program also uses the SHAPE-MaP reactivities to calculate base pairing probabilities, which are used to plot probability arcs and Shannon entropy.
RING-MaP
STMV Virion and RNA Extraction
Dialyzed virions, prepared as above, underwent a buffer exchange into RING folding buffer, 300mM Cacodylate pH 7, 10mM Mg2+, either after extraction (ex virio) or just before modification (in virio). The ex virio extraction was performed as outlined above. The extraction
of in virio RNA, carried out after modification, was performed using TRIzol Reagent (Ambion,
15596-018).
RING-MaP
prepared using a Nextera XT DNA Sample Preparation Kit (Illumina, FC-131-1024). Correlated modifications were detected using in-house software as described previously.10
IV. Results
We investigated the structure of the STMV RNA genome in two functional states. We first analyzed the ex virio state, where the structure was interrogated when the RNA genome is free of the protein capsid. Second, we analyzed the in virio state, where the RNA is still inside the capsid. SHAPE-MaP derived reactivity data was collected for ~95% of nucleotides for both states. Data could not be collected for ~5 nucleotides at the 5’ end and ~35 nucleotides at the 3’ end due to low read depth at these sites. For the RING-MaP experiments usable data was collected for all but the last ~100 nucleotides.
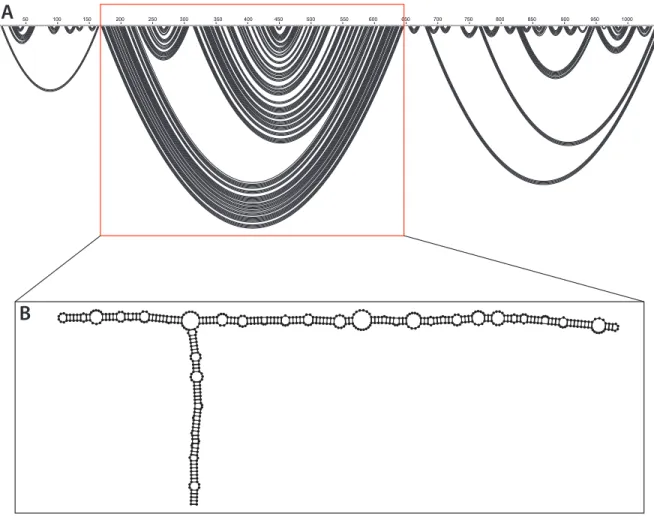
SHAPE-MaP directed modeling of the ex virio RNA suggests that it forms a three domain structure (Figure 2A). The key feature of this structure is a central T-shaped domain (Figure 2B). This is flanked on either side by a 5’ and 3’ domain. The central domain is
Figure 2. Secondary structure models can be displayed as an arc plot. Nucleotides are shown across the top with base pairs drawn as black arcs between paired nucleotides. (A) Arc plot of the SHAPE-MaP determined minimum free energy model of the ex virio secondary structure. The central T-shaped domain, highlighted in a red box, is flanked by the 5’ and 3’ domains
respectively. (B) Model of the ex virio central T-shaped domain.
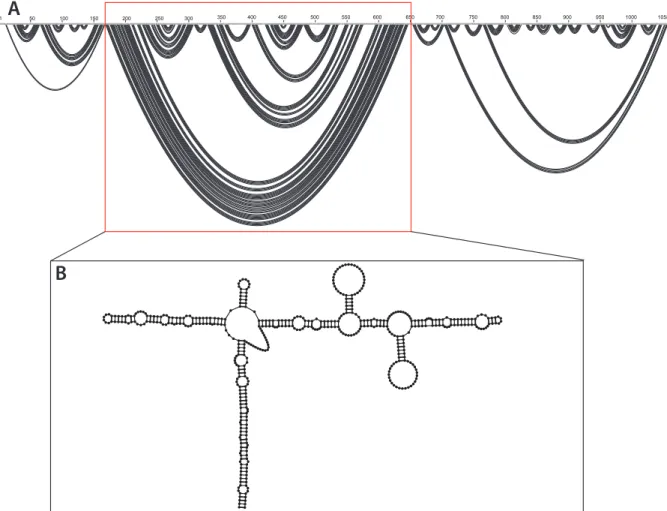
Overall the SHAPE-MaP directed in virio structure is very similar to the ex virio model.
The in virio model consists of the same three domains (Figure 3A). The 5’ and 3’ domains show
some long-range base pairing interactions but consist mainly of short, local stem loops. The in
virio structure forms a central, T-shaped, domain dominated by long-range base pairing
interactions (Figure 3B). The stem and left arm of the T-shape consist solely of multiple short helices linked by single stranded bulges. The right arm forms similar helices linked by bulges but also displays two stem loops that branch off the main arm at positions 355-400 and 480-525
950
1
A
50 100 150 200 250 300 350 400 450 500 550 600 650 700 750 800 850 900 1000 1058(Figure 3B). In each of these regions, the single stranded loops are comprised of nucleotides with very high SHAPE-reactivities. In this model 55% of the nucleotides are base paired.
Figure 3. (A) Arc plot of the SHAPE-MaP determined minimum free energy model of the in
virio secondary structure. The central T-shaped domain, highlighted in a red box, is flanked by
the 5’ and 3’ domains respectively. (B) Model of the in virio central T- shaped domain.
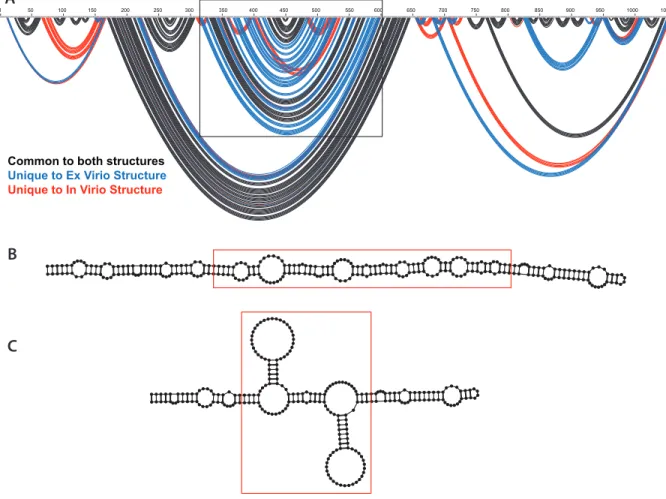
The main difference between the SHAPE-MaP directed ex virio and in virio models is a change in predicted secondary structure that takes place in the right arm of the central T-shaped domain (Figure 4A). The ex virio model predicts multiple helices stacked on top of one another joined together by small single stranded bulges (Figure 4B). However, the in virio model suggests that two stem loops form, branching off the main arm (Figure 4C). Other than this change, the other helices and overall structure are very similar. The short stem loops observed in
950
1 50 100 150 200 250 300 350 400 450 500 550 600 650 700 750 800 850 900 1000 1058
G A G G U A AG G U U A A A CC A AA C C G UA A A U CG A C G G G U G A C A A U U C G A A U G UUG
U U A C U A U G A U U A G A G C U G G A A G C U A U C C U A A G G U C A A U C C G A C U C C A A CGU
GGGUCAGA GCCAU
ACCUUUC GAAGUGU
CAGUUCAAUC U G G U A U U G CUUU
U A A A G U A C C G
GUCGGGUCACUAU U UUCG
GCAAAU UUCC
G G A C A G A U U C C U U U ACAAGCGU
C A C A G U G A U G A G U G U C C GU G CUUGGACCC
AG UUA A C ACC
G C CAGUAA A UGAGUA
CAGUUUUG UGA
GGCU G A A G C C A U U G U U C A A G A C U G G U G A C U C U A C U G A G G A G U U C GAA
G G G C G U G C A U C A A A C A U C A A CAC
the 5’ and 3’ domains of the RNAs are largely the same in the ex virio and in virio models. However the long-range base pairs in these domains show variation between the two functional states. Overall the ex virio predicted structure is slightly more base paired than the in virio
predicted structure.
Figure 4. (A) Arc plot comparing the proposed secondary structure for ex virio and in virio RNA with the key region of difference highlighted. Black depicts structures common to both, blue is structures unique to ex virio and red is structures unique to in virio(B) Right arm of the ex virio
model central T-shaped domain with the key region of difference highlighted with the red box. (C) Right arm of the in virio model central T-shaped domain with the key region of difference highlighted with the red box.
GUCGG GUCAC UAU
U UUC
G GCAAAU
U UCC
G G A C A G A U U C C U U U A C
AAGCG UC A C A G U G A U G A G U G U C C G U G CUUGG
ACCC A
GUUA A C A C
C G C CAGUAA A U
GAGU A
CAGUUUUG UGA
GGCU G A A G C C A U U G U U C A A G A C U G G U G A C U C U A C U G A G G A G U U C GA A G G G C G U G C A U C A A A C A U C A A C A C AC G A G C U U C U G U A G G G U A C A G G A U U C C A A C U A A U U U G C G U C A G A A U A C U G U G G C A G C C G A G B A 950
1 50 100 150 200 250 300 350 400 450 500 550 600 650 700 750 800 850 900 1000 1058
C
Confidence of SHAPE-predicted Structural Models
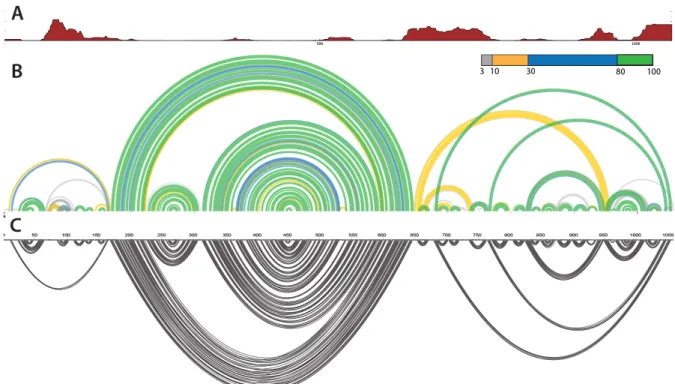
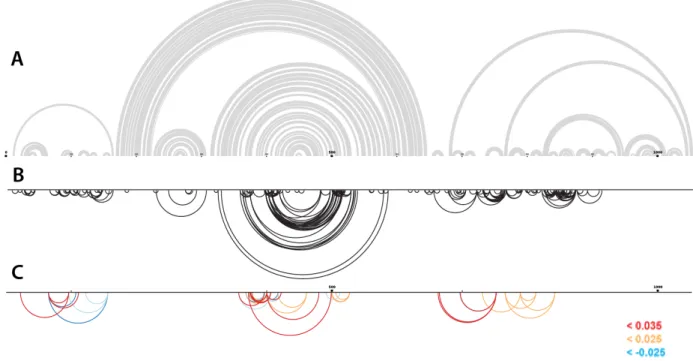
In order to evaluate the confidence of the structures predicted in our secondary structure models, we calculated the probability for each base pair across all possible structures in the ensemble that is predicted for the STMV RNA. These probabilities are visualized by plotting base pairing arcs colored to represent magnitude of the probability (Figure 5B, 6B). Green arcs depict the most probable base pairing while blue, yellow and grey arcs depict lower probability pairs. These base pair probabilities can also be used to calculate the Shannon entropies – a numerical representation of the probabilities (Figure 5A, 6A). Regions with higher Shannon entropy may form multiple alternative structures and we therefore have low confidence in the predicted structure of these regions. Conversely, regions of low Shannon entropy correspond to well-defined RNA structures or persistent single-strandedness. This visualization approach highlights regions that are likely to sample a single predominant secondary structure and those regions in which multiple structures are likely to be in equilibrium.
The Shannon entropy and probability arcs for the ex virio and in virio RNAs suggest that both the 5’ and 3’ domains of the ex and in virio structures are less well defined. The short stem loops predicted for both functional states in these domains are relatively well defined. However the longer-range base pairs observed in the 5’ and 3’ domains probably represent several possible structures for the domain that exist in equilibrium (Figures 5,6). This is reflected in the
The central T-shaped domain however is very well defined in both the ex virio and in
virio RNA. In the ex virio model, low Shannon entropy is seen across the domain and the helices
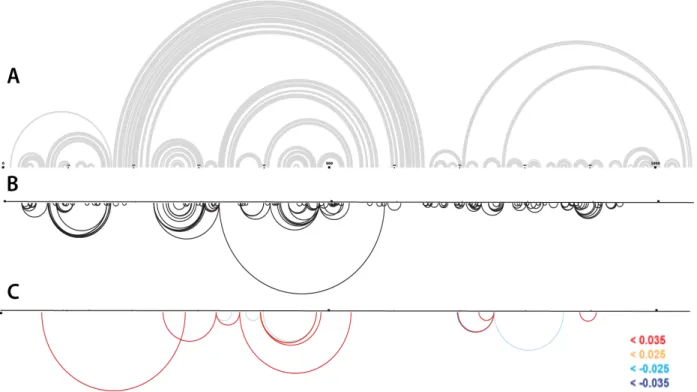
predicted all have a high probability (Figure 5). In the in virio model, the long-range interactions that form the stem and the left arm of the T-shaped structure are very well defined. However there is a region of high Shannon entropy from nucleotides 325-550. This region is less well defined and the probability arc shows several alternative helices (Figure 6).
Interestingly, the region of high Shannon entropy observed in the in virio model corresponds to the region where the largest difference between ex virio and in virio is seen (Figure 4). This could indicate that the in virio model is simply sampling an alternative structure related to that seen in the ex virio model and that the difference between the two is not
significant. We believe that this is not the case because, when the probability arcs are analyzed, it can be seen that the less probable, alternative arcs in this region of the in virio RNA do not correspond to the predicted ex virio structure (Figure 6B, 5C). Instead the probability arc for the
in in virio structure predicts two stem loops branching off of the main arm of the structure that
Figure 5. Predicted ex virio secondary structure with metrics used to determine validity of suggested motifs. (A) Plot of Shannon entropy across the genome. High Shannon entropy indicates lower levels of confidence in the structure. (B) Probability arc plot showing the probability of formation of particular motifs. (C) SHAPE-predicted secondary structure.
Exploring Secondary and Tertiary Interactions in STMV RNA
The RING-MaP experiments for both the ex and in virio RNA display multiple
correlations throughout the genome (Figure 7, 8). The correlations were categorized based on the contact distance of the two interacting nucleotides. The contact distance is the shortest path between two nucleotides, where the SHAPE-predicted secondary structure base pairs can be used to form the path. Both models are dominated by correlations that have a contact distance of less than 20 with only a few correlations with larger contact distances (Figure 7B, 8B). Overall the pattern of the correlations between exvirio and in virio are fairly different but in both the majority of the correlations occur in the central T-shaped domain with fewer and shorter correlations in the 5’ and 3’ domains.
It was determined in previous work that RING-MaP correlations with a contact distance lower than 20 are likely to be recapitulating the secondary structure interactions rather than tertiary interactions.10 A comparison of these correlations with the proposed secondary structure provides another method for determining the level of confidence in our SHAPE-predicted structures. Many correlations with a contact distance of less than 20 were identified for the ex
virio RNA (Figure 7B). The correlations in the central T-shaped domain support the secondary
structure of both arms of the T-shape. In particular, the correlations corroborate the idea of stacked helices as opposed to multiple stem loops branching off of the central arm. The predicted structure of the 5’ and 3’ domains are supported to a lesser extent by the RING-MaP
Very few correlations with a contact distance greater than 20 were observed in the ex
virio state. The correlations, when considered in terms of the secondary structure, generally
depict interactions between a helix and its neighboring bulge (Figure 7C). Most of the correlations have a contact distance only marginally above 20. This suggests that very little tertiary structure is present in the ex virio RNA. However, it is possible that the tertiary structure of the RNA is held so tightly that little “breathing” occurs so that the RING-MaP cannot detect the tertiary structure. Also, due to limitations in the method, it is not possible to detect
interactions that occur over a long distance.
Similar RING patterns are observed in the in virio RNA. The correlations with a contact distance less than 20 support the proposed secondary structure (Figure 8B). In the central T-shaped domain, these correlations mimic the base pairing in the left arm of the structure and support the structure of the two stem loops that branch off of the right arm. This indicates, via a different experimental approach, that a structural change occurs as the RNA is released from the capsid. Multiple secondary structures present in the 5’ and 3’ domains of the RNA are also supported by the RING-MaP correlations.
Similar to the ex virio data, very few possible tertiary interactions were detected. Again the interactions had a contact distance of only slightly more than 20. We propose that, as before, these interactions are simply interactions between helices and neighbouring regions of single stranded nucleotides rather than significant regions of tertiary structure (Figure 8C).
V. Discussion
The secondary structure models proposed by SHAPE-MaP experiments clearly support the long-range base pairing model over the linked stem loop model (Figure 1B, 1C). The 5’ and 3’ domains of the SHAPE-predicted models resemble the stem loops expected in the linked stem loop model. However, the well defined central T-shape domain contains long-range base pairs that are separated by ~475 nucleotides in the primary sequence, thus supporting the long-range base pairing model. The linked stem loop model proposed 30 stem loops linked by single stranded RNA based on the 30 helices visualized crystallographically. However, the structures proposed in this study also agree with crystal structure observations. In the in virio model, 30 helices of 7-9 base pairs can be identified as probable capsid binding sites.
This data enhances previously predicted SHAPE-predicted STMV RNA models. SHAPE-MaP provides more accurate data on a larger range of nucleotides thus improving the validity of the SHAPE-predicted structures shown here.
Our SHAPE-predicted secondary structure for the ex virio and in virio STMV RNA suggest that there is a significant structural difference in the right arm of the central, T-shaped domain of the two models. This observation is supported by a second experimental approach, which also depicts a change that occurs as the RNA is released from the capsid. This suggests that the RNA exists in multiple conformations depending on the functional state.
highlighted. This is supported by recent molecular dynamics experiments that suggest the capsid alone is relatively unstable and relies on the RNA for the icosahedral structure.12
It is interesting to note that the central T-shaped domain where the conformational change occurs corresponds to the capsid protein-coding region of the RNA genome. It is plausible that this plays a role in determining the structure of this region.
To our knowledge this is the first time that the tertiary structure of the STMV genome has been explored. Our findings suggest that neither the ex virio nor in virio RNA display a great deal of tertiary structure. Based on the extended secondary structure observed by both AFM and cryo-EM, the energy cost of bringing the arms of the central T-shaped domain closer together may not be compensated for by the resulting tertiary interactions. It is also plausible that interaction with the capsid is sufficient to sustain the three-dimensional structure of RNA and few, if any, RNA tertiary interactions are needed.
References
1. Schneemann, A. The structural and functional role of RNA in icosahedral virus assembly.
Annu. Rev. Micorbiol. 2006,60, 51-67.
2. Garmann, R.; Gopal, A.; Athavale, S.; Knobler, C.; Gelbart, W. and Harvey, S. Visualizing the global secondary structure of a viral RNA genome with cryo-electron microscopy. RNA. 2015,21, 1-10.
3. Dodds, J. Satellite tobacco mosaic virus. Annu. Rev. Phytopathol. 1998,36, 295-310. 4. Larson, S.; Day, J.; Greenwood, A. and McPherson, A. Refined structure of satellite
tobacco mosaic virus at 1.8 Å resolution. J. Mol. Biol. 1998, 277, 37-59.
5. McPherson, A. and Larson, B. Satellite tobacco mosaic virus RNA: structure and implications for assembly. Curr. Opin. Struct. Biol. 2001, 11, 59-65.
6. Schroder, S.; Stone, J.; Bleckley, S.; Gibbons, T. and Mathews, D. Ensemble of
secondary structures for encapsidated satellite tobacco mosaic virus RNA consistent with chemical probing and crystallography constraints. Biophys. J. 2011, 101, 167-175. 7. Archer, E.; Simpson, M.; Watts, N.; O’Kane, R.; Wang, B.; Erie, D.; McPherson, A. and
Weeks, K. Long-range architecture in a viral RNA genome. Biochemistry 2013, 52, 3182-3190.
8. Athavale, S.; Gossett, J.; Bowman, J.; Hud, N.; Williams, L. and Harvey, S. In vitro secondary structure of the genome RNA of satellite tobacco mosaic virus. PLoS One 8
2013, e54384.
9. Siegfried, N.; Busan, S.; Rice, G.; Nelson, J.; and Weeks, K.; RNA motif discovery by SHAPE and mutational profiling (SHAPE-MaP). Nat. Methods. 2014, 11, 959-965. 10.Homan, P.; Favorov, O.; Lavendar, C.; Kursun, O.; Ge, X.; Busan, S., Dokholyan, N. and
Weeks, K. Single-molecule correlated chemical probing of RNA. PNAS. 2014, 111, 13858-13863.
11.Deigan, K.; Li, T.; Mathews, D. and Weeks, K. Accurate SHAPE-directed RNA structure determination. Proc. Natl. Acad. Sci. U.S.A 2009, 106, 97-102.