THE ROLE OF ENVIRONMENTAL DRIVERS ON THE DISTRIBUTION OF VERMILION (SEBASTES MINIATUS) AND SUNSET ROCKFISHES (S.
CROCOTULUS) IN THE SOUTHERN CALIFORNIA BIGHT
By Austen Hughes
Honors Thesis
Environmental Science and Ecology University of North Carolina at Chapel Hill
4/10/2015
Approved:
Allan Hicks:
Introduction
The fishing industry is a globally important economic activity providing more than 45 million jobs worldwide, and with an annual catch of about 145 million tonnes, is also an important source of food for many areas of the world (FAO Fisheries and Aquaculture Department 2010). Historically, many fisheries have been harvested at unsustainable rates. The Food and Agriculture Organization (FAO) report 53% of fisheries as fully exploited and 32% as overexploited in 2010, with some species such as the Bluefin Tuna and the Atlantic Cod seeing as much as a 96% reduction from virgin stock (Pacific Bluefin Tuna Stock Assessment 2012). However, some populations of fishes that are scientifically assessed and managed have seen shifts from overexploitation towards more stable population sizes and fishing rates. The RAM Legacy database for fish stocks show that of stocks that have been managed, 64% showed a decrease in mortality and increase in biomass over the past five years (Hilborn 2014).
One group of fishes that are important to the $173 million annual recreation fishing industry in Southern California that faces many of the challenges associated with assigning individuals to discrete species and stocks are the rockfishes (Gautam 1996). The genus Sebastes, commonly known as Rockfish,are a primarily demersal group of species commonly found along the West Coast of North America (Love et al. 2002). Over 100 species of Rockfish have been described worldwide, making it the most diverse group in the family Scorpaenidae. All Sebastes are grouped under the family
One species of rockfish that is commercially important and has recently been the source of uncertainty in its stock is Vermillion Rockfish (Sebastes miniatus). Unlike most other teleost fishes, many species of Sebastes such the Vermilion Rockfish have internal fertilization and are viviparous; adults release their larvae into the water column of offshore areas in late fall to early winter (Vermilion Rockfish [S. miniatus]). A large portion of geographic dispersal occurs during the pelagic larval and juvenile stages; offshore planktonic larvae disperse towards near shore habitats such as kelp beds after they transition into the juveniles stage, followed by recruitment to adult populations in deeper water after reaching maturation (Love et al. 1991). Adult Vermilion Rockfish tend to show strong homing behavior, and typically spend most of their life in one area with daily excursions to feed. (Love et al. 2002). These home ranges may be as small as a single small rock outcropping or may span dozens of square miles of sea floor (Love et al. 2002). Vermilion Rockfish inhabit a broad geographic range, from Southeast Alaska to Baja California. Typically red to red-orange in color with some white and black markings, Vermilion Rockfish are most commonly found at depths between 50-150 m, but have been encountered as deep as 400 meters (Love et al. 2002). Vermilion Rockfish have been a commercially and recreationally important species in Southern California since the 1930s. More recently they have become especially important recreationally, ranking first in Southern California sport landings from 1990 to 2004 (MacCall 2005). High exploitation rates and size-selective fishing have not only caused a decline in the abundance of Vermilion Rockfish, and other Rockfish populations, but also a truncation of their size distribution (Love et al. 1998).
Recent genetic research from Hyde et al. 2008 has revealed that fish classified as
Vermilion Rockfish (S. miniatus) actually comprise two distinct species that diverged 2-3 million years ago. This newly-identified species was named the Sunset Rockfish (S. crocotulus). The two species are indistinguishable based on coloration, morphological characteristics, and meristics; the only known difference between the two species aside from genetics is their geographic distribution (Fig. 1). Preliminary studies suggest that
Sunset Rockfish generally occur south of Point Conception (34.4⁰ N) in waters deeper than 100 meters, while the Vermilion Rockfish is typically found coastwide in depths
Sunset Rockfish (
S. crocotulus)
shallower than 100 m. To date, however, no rigorous statistical analyses of the distribution of these two species has been done (Hyde et al. 2008).
Figure 1: Vermilion Rockfish (left) and Sunset Rockfish (right)
The identification of a new species of rockfish raises difficult issues for research and fisheries management. There is little information on how these two species differ in terms of life history characteristics and geographic distribution, which are fundamental to defining stock boundaries, conducting stock assessments, and developing sustainable harvest regulations. Current efforts at conserving Rockfish in Southern California includes the 4,200 square mile Cowcod Conservation Area (CCA) which prohibits fishing deeper than 36 meters within its boundaries. Surveys used in stock assessments and seasonal catch quotas have not differentiated between Vermilion and Sunset
geographic distribution of the two species and differences in biology, such as feeding and mating behaviors, are required. Efforts are underway to gather basic life history data on Sunset and Vermilion Rockfish, but a more immediate need exists to develop methods that can refine our ability to characterize geographic distribution differences (if any) between these two species. Surveys suggest depth segregation between Vermilion Rockfish and Sunset Rockfish may be somewhat less distinct than the 100 m threshold for distinguishing between the species proposed by Hyde et al. (2008), at least within the SCB, suggesting other environmental factors may also play a role in defining the two species distributions.
Logistic regression models have shown to be an effective tool at using geographic and environmental data to predict the occurrence of species and map their distribution
(Osborne and Tigar, 1992). The biological and environmental data collected by NOAA’s annual Hook and Line Survey provides for a large data set that could be utilized for determining the factors which may influence differences in distribution between Sunset and Vermilion Rockfish. The objective of this study is to evaluate the importance of various environmental and spatial variables in Vermilion and Sunset Rockfish distribution in order to refine the ability of fisheries scientists to accurately assign individuals to a species. Logistic regression models fitted to data from the NOAA Hook and Line survey allowed for the prediction of the proportion of each species given spatial and environmental covariates, which is useful to determine the species composition of catches as well as understand how management restrictions protect each species.
Methods
California sportfishing industry. The survey encompasses the Southern California Bight (SCB) from Port Arguello (34.6° N) to the US-Mexico Exclusive Economic Zone (EEZ) boundary (32.0° N). There are 121 fixed sites that were selected to cover a range of geographical areas within the SCB and depths at which Rockfish commonly occur, and are sampled every year unless poor weather conditions prevent sampling. Depth ranges from 40 m to 230 m as measured by a depth sounder, and is measured and recorded for each site each year. These permanent sites were chosen based on input from local sport and commercial fishing industry members as well as fishing agencies, and are stratified into 19 geographically related sampling areas to ensure spatial coverage of the SCB (Harms et al. 2008). Each of these sampling areas contains between four and eight sites, which were chosen to reflect where Rockfish are likely to occur as determined by input provided by the local fishing industry and the California Department of Fish and Game (Harms et al. 2008). The survey is conducted every year from late September to mid-October, using two chartered vessels that each perform two legs of five or six day. The sites to sample are divided between the two vessels by randomly assigning half of the sites in one sampling area (Fig. 2 ) to one vessel, and the other half to the second vessel. The captain then determines the best route to ensure sampling at every assigned site during the duration of the survey.
The survey uses standard hook and line gear for Rockfish deployed by rod and reel aboard each vessel, as the sites are predominantly rocky and not conducive to surveying with trawl gear (Harms et al. 2008). At each sampling site, a 100 yard radius was constructed from the GPS coordinate designating the site, and five drops are made. A drop consists of three deckhands each deploying a sampling rig, with the sinker dropped to the bottom for each sample. Drop locations within each site are determined by the captain with the goal of maximizing catch, with each drop beginning within the 100-yard radius and the vessel allowed to drift during sampling. Drops are constrained to a
After being reeled in, fish are removed from the line and placed on a table for data collection. All rockfish encountered during the survey are identified to species by visual observation by a designated crewmember. Non-Rockfish species are removed from the hook, identified, weight, and measured before being released. Each Rockfish is measured for length and weight, and otoliths, a fin clip for genetic information, and possibly a section of ovary are collected for further analysis. Length (cm) is measured as fork length, the distance between the tip of the snout and the end of the flesh portion of the tail, and is measured in centimeters. Weight (kg) of the whole fish is taken immediately after the fish is removed from the line on a stationary platform scale.
For fish identified on the survey as Vermilion Rockfish, a sample of tissue is taken from the left pectoral fin using scissors (Fig 2). The survey does not differentiate between Vermilion Rockfish and Sunset Rockfish in the field; definitive species assignment is genetically determined via the collection of fin clip tissue (Harms et al. 2008). This tissue sample is placed on chromatography paper without alcohol preservative (LaHood et al. 2008) (Fig. 2), and mitochondrial DNA is extracted using a DNeasy-96 Blood and Tissue Kit. Extracted mitochondrial DNA is amplified by polymerase chain reaction (PCR) using primers and the process is outlined in Hyde and Vetter (2007), specifically analyzing the region of the mitochondrial genome cytochrome c oxidase subunit1, which differs in length between Vermilion and Sunset Rockfish. The restriction fragment length polymorphism (RFLP) was used due to its low cost and high accuracy for analyzing large numbers of samples (Hyde et al. 2008). The resulting restriction fragments were
Figure 2: Fin clips of Vermilion Rockfish on chromatography paper
The survey deployed a Conductivity-Temperature-Depth (CTD) sensor array at each site to collect a suite of environmental and oceanographic data that includes full water
This complete subset of the NOAA Hook and Line survey data was compiled including both environmental and spatial data as explanatory variables and proportion of Vermilion Rockfish caught as a response variable. Proportion of Vermilion Rockfish was calculated as the total number of fish genetically identified as Vermilion Rockfish between years 2010-2013 divided by the sum of fish genetically identified as Vermilion Rockfish and fish genetically identified as Sunset Rockfish between years 2010-2013. Spatial data included geographic area, latitude, longitude, and distance to nearest port (km). Latitude and longitude coordinates were converted to eastings and northings. Environmental data included site depth (m), minimum and maximum sampling depth, CTD temperature (°C), CTD salinity (psu), and CTD dissolved oxygen (mL/L) (DO). Steepness and sea surface temperature (SST) were also recorded. Chlorophyll and turbidity data were excluded from the data set due to large amounts of incomplete and inaccurate data. Minimum and maximum depth were determined by the deepest and shallowest depth measurements for a given site from years 2010-2013. Site depth was calculated using the average of
minimum and maximum depth for average depth, and bottom steepness was calculated by the difference between minimum and maximum depth. CTD temperature, salinity and dissolved oxygen were measured at the point when the CTD was held at bottom during deployment, as determined by the depth profile generated for each drop. CTD
temperature, salinity, and dissolved oxygen were averaged over 2010-2013. The data set also included site number, geographic area, gender, and average weight of Vermilion Rockfish between the years 2010-2013. Gender and weight were not used in this analysis.
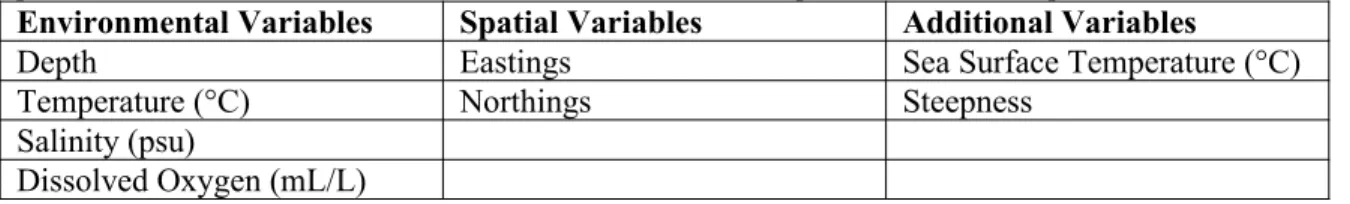
Table 1: Variables available for use in the logistic regression models. The environmental model drew from the environmental parameters collected by the CTD sensor. The spatial model drew from the spatial parameters. The full model drew from all of the environmental, spatial and additional parameters. Environmental Variables Spatial Variables Additional Variables
Depth Eastings Sea Surface Temperature (°C)
Temperature (°C) Northings Steepness
Salinity (psu)
In order to address relationships between explanatory variables, correlations between depth, temperature, salinity, dissolved oxygen, steepness, eastings, and northings were analyzed using a correlation matrix and Pearson’s product-moment correlation
coefficient. To examine which combination of variables best predict the proportion of Vermilion Rockfish at a site, logistic regression models were fit to environmental and spatial parameters. Four separate models were produced using 1) depth only (i.e., the only known variable that predicts the distributions of sunset and vermillion rockfish), 2) only oceanographic parameters plus depth, 3) only spatial parameters plus depth, and 4) all of the parameters listed in Table 1. For each of the three models covariates other than depth, a final set of predictors were selected, using the Akaike Information Criterion (AIC) as an indicator for model fit. For each of three models, a final set of predictors was selected using a step-wise variable selection approach. A step consisted of the addition of a variable or the removal of a previously added variable or interaction between two variables that resulted in the greatest reduction in AIC from the previous step, beginning with the null model. The final models calculated proportion of Vermilion Rockfish according to:
logit(ProportionVermilion)=β0+β1V1+β2V1+…+βnVn
Where V represents a variable in the model, with n variables added in the stepwise process described above.
plotted as box plots with MSE in link logit space, which log transforms probability values (p between 0 and 1) into log-odds (Ashton 1972). This was calculated according to:
MSE=1 n
∑
i=1n
(
Observed proportion−logit(Proportion Vermilion))
2Where logit(Proportion Vermilion) is the value calculated by the model being tested.
Using the model with the lowest MSE, the predicted change in proportion of Vermilion Rockfish with respect to a single variable was analyzed, while the other variables in the model were held constant. This was done to investigate the individual effects of variables on proportion and the way these effects change due to potential correlations between the model variables. Plots were created for each variable; for example, one plot predicted the proportion of Vermilion Rockfish across depths while the rest of the variables were held at high, median and low values; one plot predicted the proportion across another variable holding all other variables in the model constant; etc. Using this approach, the depths that predicted 90%, 50% and 10% Vermilion Rockfish were calculated.
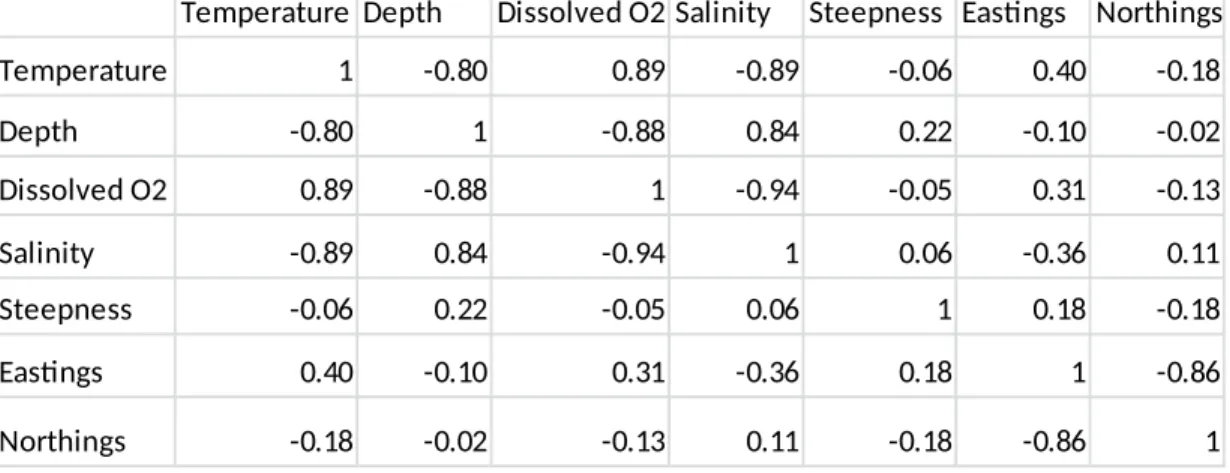
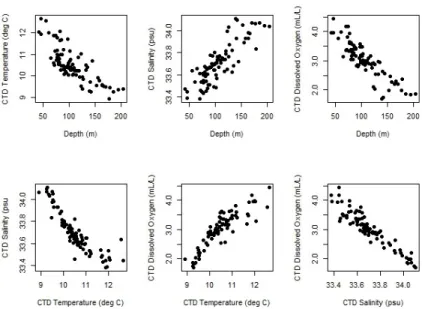
A high degree of correlation was seen among four of the environmental explanatory variables: depth, temperature, dissolved oxygen and salinity (2). These four variables had Pearson correlation coefficients that were greater than 0.8 or less than -0.8. Depth showed a strong negative relationship with both temperature and dissolved oxygen, but showed a strong positive relationship with salinity (Fig. 3). Temperature showed a strong positive relationship with dissolved oxygen and a strong negative relationship with salinity, while salinity and dissolved oxygen showed a strong negative relationship (Fig. 3). These relationships follow well established patterns found in ocean water columns (Emery et al. 1982), and may cause difficulty in determining the causal variables responsible for distribution differences in Vermilion and Sunset Rockfish. The two spatial variables, Eastings and Northings, were also highly correlated with one another(r =0.86). Correlations between the environmental and spatial variables did not show strong correlation. Moreover, steepness was not significantly correlated with any other variables.
Table 2: Correlation matrix of environmental and spatial parameters. All values reported as Pearson’s product-moment correlation coefficient.
Temperature Depth Dissolved O2 Salinity Steepness Eastings Northings
Temperature 1 -0.80 0.89 -0.89 -0.06 0.40 -0.18
Depth -0.80 1 -0.88 0.84 0.22 -0.10 -0.02
Dissolved O2 0.89 -0.88 1 -0.94 -0.05 0.31 -0.13
Salinity -0.89 0.84 -0.94 1 0.06 -0.36 0.11
Steepness -0.06 0.22 -0.05 0.06 1 0.18 -0.18
Eastings 0.40 -0.10 0.31 -0.36 0.18 1 -0.86
Figure 3: Scatterplots of the environmental variables exhibiting high correlations based on the correlation analysis (Table 2)
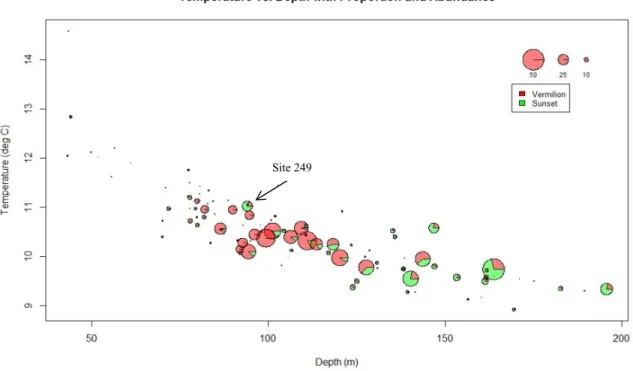
A qualitative examination of the NOAA Hook and Line survey data suggest that Vermilion and Sunset Rockfish are distributed unevenly with respect to temperature, depth, and geography. For example, when with the proportion of Vermilion and Sunset Rockfish are plotted against depth and temperature an increasing proportion of
Vermillion Rockfish is seen at deeper depths and colder water (Fig. 4). The highest total abundances, independent of species, were concentrated between depths of 80 to 120 meters. Sites with a higher proportion of Sunset Rockfish were less numerous than sites with higher proportions of Vermilion. The highest proportion of Sunset Rockfish was seen at sites with depths greater than 140 meters.
Figure 4: Plot of temperature vs. depth for all site observations 2010-2013. Points are represented by pie charts indicating the proportion of Vermilion and Sunset Rockfish, scaled to reflect abundance. Anomalous site 249 is identified by arrow.
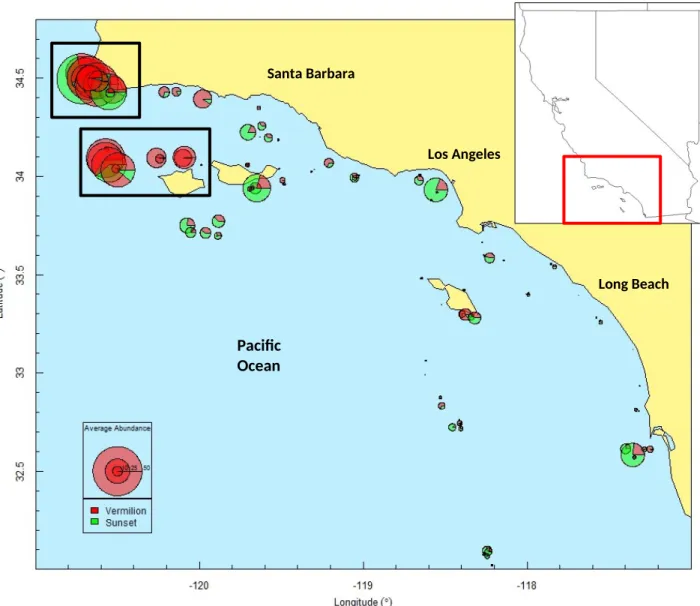
Figure 5: Sampling sites in the Southern California Bight. Each site is represented by a pie chart representing the proportion of Vermilion (red) and Sunset (green) Rockfish, scaled to reflect abundance. Inset maps can be seen in Figs. 6 & 7.
Pacific Ocean
Los Angeles
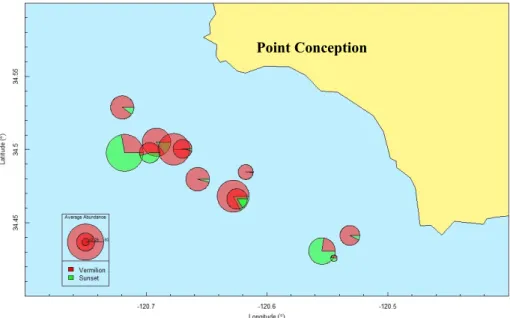
Figure 6: Zoomed image of Point Conception sites in upper left (34.5 Latitude) of Fig. 5. Each site is represented by a pie chart representing the proportion of Vermilion (red) and Sunset (green) Rockfish, scaled to reflect abundance.
Figure 7: Zoomed image of San Miguel sites at middle left (34 Latitude) of Fig. 5. Each site is represented by a pie chart representing the proportion of Vermilion (red) and Sunset (green) Rockfish, scaled to reflect abundance.
Point Conception
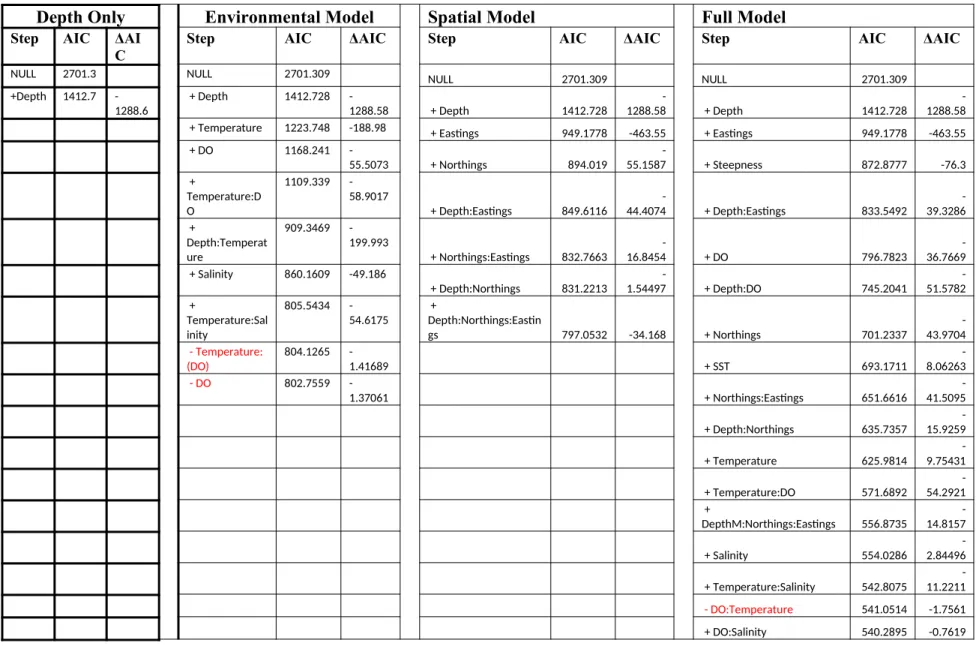
Table 3: Steps resulting in the final environmental, Spatial and Full logistic regression model. A + indicates the variable that was added for a given step. AIC values are given for the model at each step. Delta AIC represents the reduction in AIC as a result of the addition of the variable in the step of the model creation. A – indicates a variable that was added in a previous step was removed, and are denoted by red text. A : indicates variable interactions
Depth Only Environmental Model Spatial Model Full Model
Step AIC ΔAI
C
Step AIC ΔAIC Step AIC ΔAIC Step AIC ΔAIC
NULL 2701.3 NULL 2701.309 NULL 2701.309 NULL 2701.309
+Depth 1412.7
-1288.6
+ Depth 1412.728
-1288.58 + Depth 1412.728
-1288.58 + Depth 1412.728
-1288.58
+ Temperature 1223.748 -188.98 + Eastings 949.1778 -463.55 + Eastings 949.1778 -463.55
+ DO 1168.241
-55.5073 + Northings 894.019
-55.1587 + Steepness 872.8777 -76.3
+
Temperature:D O
1109.339
-58.9017
+ Depth:Eastings 849.6116
-44.4074 + Depth:Eastings 833.5492
-39.3286 + Depth:Temperat ure 909.3469 -199.993
+ Northings:Eastings 832.7663
-16.8454 + DO 796.7823
-36.7669
+ Salinity 860.1609 -49.186
+ Depth:Northings 831.2213
-1.54497 + Depth:DO 745.2041
-51.5782 + Temperature:Sal inity 805.5434 -54.6175 + Depth:Northings:Eastin
gs 797.0532 -34.168 + Northings 701.2337
-43.9704
- Temperature: (DO)
804.1265
-1.41689 + SST 693.1711
-8.06263
- DO 802.7559
-1.37061 + Northings:Eastings 651.6616
-41.5095
+ Depth:Northings 635.7357
-15.9259
+ Temperature 625.9814
-9.75431
+ Temperature:DO 571.6892
-54.2921 + DepthM:Northings:Eastings 556.8735 -14.8157
+ Salinity 554.0286
-2.84496
+ Temperature:Salinity 542.8075
-11.2211
- DO:Temperature 541.0514 -1.7561
Four separate logistic regression models were developed, one with just environmental data, one with spatial data, and one that combined the environmental and spatial data. Model selection from AIC produced a final environmental model that included depth, temperature, and salinity, as well as interaction terms between depth and temperature, as well as temperature and salinity (Table 3). The delta AIC from the null model to the final model suggests a substantial improvement with the inclusion of the measured variables. Additionally, the delta AIC suggests the inclusion of these environmental variables result in an improved fit to the data over using only depth. Proportion of Vermilion was
calculated in this model according to:
logit(Proportion Vermilion)Environmental=β0+β1∗Depth+β2∗Temperature+β3∗Salinity+β4∗Depth:Temperature+β5∗Temperature:Salinity
The final spatial model included depth, eastings, northings, as well as the following interactions: depth:eastings, eastings:northings, depth:northings, and
depth:eastings:northings (Table 3). The delta AIC from the null model to the final model suggests a substantial improvement with the inclusion of the measured variables.
Proportion of Vermilion was calculated in this model according to:
logit(Proportion Vermilion)Spatial=β0+β1∗Depth+β2∗Eastings+β3∗Northings+β4∗Depth:Eastings+β5∗Depth:Northings+β6∗Depth:Eastings:Northings
The final full model included depth, eastings, steepness, DO, northings, sea surface temperature (SST), temperature, salinity, depth:eastings, depth:DO, eastings:northings, depth:northings, temperature:salinity, DO:salinity, and depth:eastings:northings (Table 2). The delta AIC from the null model to the final model suggests a substantial
improvement with the inclusion of the measured variables. Proportion of Vermilion was calculated in this model according to:
logit(Proportion Vermilion)Full=β0+β1∗Depth+β2∗Eastings+β3∗Steepness+β4∗DO+β5∗SST+β6∗Temperature+β7∗Salinity+β8∗Depth:Eastings+β9∗Depth:DO+β10∗Eastings:N orthings+β11∗Depth:Northings+β12∗Temperature:Salinity+β13∗DO:Salinity+β14∗Depth:Eastings:Northings
statically significant difference in MSE (Fig. 8). In order to better compare model performances in the cross-validation, Figure 8 represents the MSE in logit link space, which transforms probabilities into log-odds (Ashton 1972).
Due to the high degree of correlation between the variables included in the environmental model (Fig. 3), the relationship and interactions between the proportion of Vermilion Rockfish model variables (Depth, Temperature, and Salinity) were plotted to predict responses for each variable while holding the others at median, high, and low values (Fig.Figure9). The black curves represent the change in proportion of Vermilion Rockfish in relation to the variable labeled on the x-axis when both other variables are held
constant at their median values. For example, when both temperature and salinity are held constant at their median values for the data set, the predicted proportion of Vermilion at a given depth is represented by the black curve in the leftmost graph (Fig. 9). The blue curve represents the change in proportion of Vermilion Rockfish in relation to the variable labeled on the x-axis when both other variables are held constant at low values (20th percentiles), while the red curve represents both other variables held constant at high
values (80th percentiles). Using the median curve for depth, the division at which the
Figure 9: Relationship of depth, temperature and salinity to proportion of Vermilion Rockfish for low (20th percentile),
median and high (80th percentile) environmental conditions based on environmental model.
Figure 10: Confidence intervals on proportion of Vermilion Rockfish versus depth, temperature and salinity while the remaining variables of the model were held at median values.
Discussion
best in predicting proportion of Vermilion Rockfish. However, all four models were similar in their predictions of the proportion of Vermilion Rockfish, and using depth alone does only slightly worse than the full model.
Although the inclusion of environmental data improved our ability to predict proportions of these two species, depth was still the most important explanatory variable. In each of the three models, depth was the first variable to be incorporated into the logistic
regression model, because depth produced the greatest reduction in AIC over the null model than any other variable. In the cross-validation, the inclusion of eastings and northings as proxies for latitude and longitude actually increased the MSE in predictions of proportion of Vermilion Rockfish compared to predictions using depth alone.
Additionally, of the variables in the environmental model, the confidence intervals suggested the relationship between depth and proportion to be more well defined than the relationship between proportion and both temperature and salinity.
The results of the cross-validation study exhibited slight differences from the stepAIC() model calculations. The spatial model was slightly worse than the depth only model, even though the AIC indicated greater model strength. These results suggest that depth is the best predictor since it reduced the AIC the most of all other variables, and that
was fit. Under this view, the environmental model is a parsimonious, easier to
understand model that fit the cross-validation data better than the other models tested. Future studies could improve on these shortfalls by incorporating the effects of interannual variability.
The depth distribution of Vermilion and Sunset Rockfish indicated by the environmental model differ from those suggested in previous studies. Hyde et al. (2008) suggest a distinct depth partitioning, with a majority of Vermilion Rockfish found shallower than 100 meters and a majority of Sunset Rockfish found deeper than 100 meters. This study shows that Vermilion and Sunset Rockfish do not have sharp depth partitioning, with proportion of Vermilion Rockfish declining with deeper depths but with the two species co-occurring at depths even as deep as 200 meters. Based on the distribution suggested by the environmental model, a 90% proportion of Vermilion Rockfish was predicted shallower than 100 m and a 10% proportion was predicted deeper than 150 m. Between 100 m and 150 m, the model suggests a high degree of co-occurrence, with a 50% proportion occurring at 126 m.
The results of this study may have important implications for the fisheries management practices in the SCB. Current management efforts to allow overfished Rockfish
populations such as cowcod (S. levis) and bocaccio (S. paucispinis) to rebound include the closing of certain areas or depths to commercial and recreational fishing. In the SCB, the CCA encompasses 4200 mi2 in which fishing is prohibited. However, much of this
area is deep water over 140 meters, which our models suggest would contain
predominantly Sunset Rockfish. This puts more pressure on shallow-water fishing areas outside of the CCA, which are dominated by Vermilion Rockfish, as also discussed by Hyde et al. 2008. A better understanding of depth distribution would allow managers to assess the effects that area closures have on particular species and could help protect important areas for adult rockfish.
emergence of this species complex and the lack of knowledge of their distribution and life histories, the Vermilion Rockfish has not undergone a stock assessment since 2005. The results of this study could be used to help inform separate assessments of Vermilion and Sunset Rockfish by estimating species specific catches. The insight from the depth and spatial distributions suggested by these models could be used to estimate the
proportion of Sunset and Vermilion Rockfish in catches. Additionally, these models can provide insight into how fishing has affected the proportions of Vermilion and Sunset Rockfish by using current bathymetry data and historical catch records to compare to current records. A greater understanding of these changes could be an important tool for assessing these species and establishing more comprehensive management strategies to ensure the sustainability of this important fishery.
While many marine species show depth partitioning, this partitioning is likely a reflection of a change in some other variable correlated with depth rather than simply the change in water pressure at different depths. Correlations between the environmental variables and depth illustrate that many environmental variables that have a more direct impact on animal physiology such as temperature, salinity and dissolved oxygen vary strongly with depth. The cross-validation of the logistic regression models indicates that environmental conditions such as temperature, salinity and dissolved oxygen have a greater importance in the distribution of Vermilion and Sunset Rockfish than geographic location. Genetic analysis by Hyde et al. 2008 showed little hybridization between the two species,
suggesting reproductive isolation mechanisms have played a role in sustaining divergence of the two species as well. While the reasons for the divergence of these two species are not known, further studies focused on biology and life history could aid in future stock assessments.
were encountered in shallower water. Data from sites such as these could aid in a better understanding of the differences in life histories between these two species. In order to better understand this important area, the Hook and Line survey should collect more data at this site in the future.
The continued collection of environmental data by the Hook and Line survey will allow for models such as the ones described in this study to improve with every year of new data. The survey has also recently begun utilizing even more tools for collecting
environmental data not included in this study, such as chlorophyll and turbidity sensors, which could be used in future studies. The method of model creation and subsequent distribution predictions established in this study could readily be applied to other economically important species as well, not only to investigate distribution but also to better understand the importance of oceanographic conditions on yearly catch variability. The Hook and Line survey’s rich database provides for great opportunities for future studies that could lead to more comprehensive management strategies for the important fisheries of the SCB.
Acknowledgements
I would like to thank Geoff Bell and Allan Hicks for their insight and tireless editing, Jaye Cable and the Environmental Science department for providing the opportunity for this Thesis, and everyone at NOAA and the NWFSC for making this research possible.
References
Ashton, W. D. (1972). The Logit Transformation: with special reference to its uses in Bioassay. Griffin's Statistical Monographs & Courses 32. Charles Griffin. ISBN 0-85264-212-1.
Blair, W. F. (1953). Experimental Evidence of Species Discrimination in the Sympatric Species, Peromyscus truei and P. nastus. The American Naturalist, 87(833), 103-105.
DiGiacomo, P. M. and Holt, B. (2001). Satellite observations of small coastal ocean eddies in the Southern California Bight. Journal of Geophysical Research, Vol. 106, No. C10, 22,521-22,543.\
Emery, W.J., Dewar, J.S. (1982). Mean temperature-salinity, salinity-depth and temperature-depth curves for the North Atlantic and the North Pacific. Progress in Oceanography, 11 (3), pp. 219-256,IN1-IN4,257-305. doi:
10.1016/0079-6611(82)90015-5
"Fish Stock Assessment 101: Part 2-A Closer Look at Stock Assessment Models." National Marine Fisheries Service: NOAA Fisheries. Accessed March 31, 2015.
http://www.nmfs.noaa.gov/stories/2012/10/10_10_12stock_assessment_101_part2.html. Halpern, B. S. (2003). The impact of marine reserves: Do reserves work and does reserve size matter? Ecol Appl 13: 117−137
Gautam, A. (1996). Economic status of U.S. fisheries 1996. Amy Gautam, ed. NOAA-NMFS, Fisheries Statistics Division.
Harms, J. H., Benante, J. A., & Barnhart, M. R. (2008). The 2004-2007 Hook and Line Survey of Shelf Rockfish in the Southern California Bight: Estimates of Distribution, Abundance, and Length Composition. NOAA Technical Memorandum, NMFS-NWFSC Series.
Harms, J. H., Wallace, J. R., & Stewart, I. J. (2010). Analysis of fishery-independent hook and line-based data for use in the stock assessment of bocaccio Rockfish (Sebastes paucispinis). Fisheries Research, 106(3), 298-309. doi:
http://dx.doi.org/10.1016/j.fishres.2010.08.010
Hilborn, R. and C. J. Walters. (1992). Quantitative fisheries stock assessment: choice, dynamics and uncertainty. Chapman and Hall, New York. pp. 570.
Hilborn, R., and Ovando, D. (2014). Reflections on the success of traditional fisheries management. ICES J Mar Sci, 71 (2014), pp. 1040–1046
Hitchman, S. M., Reyns, N. B., & Thompson, A. R. (2012). Larvae define spawning habitat of bocaccio Rockfish Sebastes paucispinis within and around a large southern California marine reserve. Marine Ecology Progress Series, 465, 227-242. doi: 10.3354/ meps09926
Hosmer, D. W., Lemenshow, S., Sturdivant, R. X. (2013). Applied Logistic Regression. John Wiley & Sons, Inc. Hoboken, NJ.
the speciation process. Mol Ecol, 17(4), 1122-1136. doi: 10.1111/j.1365-294X.2007.03653.x
Hyde, J. R., & Vetter, R. D. (2007). The origin, evolution, and diversification of Rockfishes of the genus Sebastes (Cuvier). Mol Phylogenet Evol, 44(2), 790-811. doi: 10.1016/j.ympev.2006.12.026
Hyde, J. R., & Vetter, R. D. (2009). Population genetic structure in the redefined Vermilion Rockfish (Sebastes miniatus) indicates limited larval dispersal and reveals natural management units. Canadian Journal of Fisheries and Aquatic Sciences, 66(9), 1569-1581. doi: 10.1139/f09-104
Jackson, J. B. C., Kirby, M. X., Berger W. H., Bjorndal, K. A., and others. (2001). Historical overfishing and the recent collapse of coastal ecosystems. Science 293: 629−637
Johansson, M. L., Banks, M. A., Glunt, K. D., Hassel-Finnegan, H. M., & Buonaccorsi, V. P. (2008). Influence of habitat discontinuity, geographical distance, and oceanography on fine-scale population genetic structure of copper Rockfish (Sebastes caurinus). Mol Ecol, 17(13), 3051-3061. doi: 10.1111/j.1365-294X.2008.03814.x
LaHood, E. S., Miller, J., Apland, C. & Ford, M. (2008). A Rapid, Ethanol-Free Fish Tissue Collection Method for Molecular Genetic Analyses, Transactions of the American Fisheries Society, 137:4, 1104-1107, DOI: 10.1577/T07-181.1
Love, M. S., Carr, M., Haldorson, L. (1991). The ecology of substrate-associated juveniles of the genus Sebastes. Environ. Biol. Fish. 30, 205–243.
Love, M. S. (1998). A severe decline in the commercial passenger fishing vessel Rockfish (Sebastes spp.) catch in the Southern California Bight, 1980-1996. California cooperative oceanic fisheries investigations, progressive report, 39, 180-195.
Love, M. S., Yoklavich, M., & Schroeder, D. M. (2008). Demersal fish assemblages in the Southern California Bight based on visual surveys in deep water. Environmental Biology of Fishes, 84(1), 55-68. doi: 10.1007/s10641-008-9389-8
Love, M. S., Yoklavich, M., & Thorsteinson, L. (2002). The Rockfishes of the Northeast Pacific. UC Press, Berkeley.
MacCall, A. D. (2005). Assessment of Vermilion Rockfish in Southern and Northern California. NOAA NMFS Southwest Fisheries Science Center.
PACIFIC BLUEFIN TUNA STOCK ASSESSMENT. (2012). International Scientific Committee for Tuna and Tuna-like Species in the North Pacific Ocean.
http://isc.ac.affrc.go.jp/pdf/Stock_assessment/Final_Assessment_Summary_PBF.pdf
Pacific Fisheries Management Council (2013) Scientific and Statistical Committee Report on Stock Assessments: Supplemental Report. http://www.pcouncil.org/wp-content/uploads/F5b_SUP_SSC_JUN2013BB.pdf
Phillips, J. B. (1964). Life history studies on ten species of Rockfish (genus Sebastodes). California Department of Fish Bulletin, 126, 1-70.
The State of World Fisheries and Aquaculture 2010. (2010). FAO Fisheries and Aquaculture Department. http://www.fao.org/docrep/013/i1820e/i1820e.pdf
"Vermillion Rockfish [S. Miniatus]." California State University: Nearshore Marine Fish Research Program. Accessed March 24, 2015.
http://www.csun.edu/~nmfrp/vermillionRockfish.html