DONALD MCCALL. Iodine Inactivation of Hepatitis A Virus,
Poliovirus 1 and Echovirus 1 in Modeled Worst Case Water.
(Under the direction of MARK D. SOBSEY)
Hepatitis A virus, poliovirus 1 and echovirus 1 were
exposed to either 8 or 16 mg/Qt iodine under controlled
extreme water conditions (5 degree C, 5 NTU Bentonite clay
and 10 mg/L dissolved organic acids) at three pH values
(4.5, 7.0 and 9.5). Virus titers were determined from
halogen quenched samples collected at specific time points
over a sixty minute contact time. The primary research
objective was to determine if globaline (iodine) at present
concentration (8 mg/tablet/quart of water) and used
according to present instruction (1 tablet, 2 tablets if
water cloudy or cold, and thirty minutes contact time) is
sufficient protection against HAV or other enteroviruses.
Iodine virucidal efficiency was dependent upon virus
type, pH and iodine concentration. Iodine stability
decreased above neutral pH. The three test viruses survived
sixty minutes iodine contact at pH 4.5, 8 and 16 mg/Qt
iodine and at pH 7.0, 8 mg/Qt iodine. At pH 7.0, 16 mg/Qt
iodine, HAV was not detectable after one minute, echo 1 was
not detectable after ten minutes, and polio 1 survived sixty
increased. First order inactivation kinetics were not
observed for the three test viruses under trial conditions.
KEY WORDS:
clay, disinfection, echovirus, enterovirus, fulvic acid,
This research was conducted as part of a research
program supported by the United States Army, Contract No.
DAMD17-86-C-6053.
I would like to especially thank Dr. Mark D. Sobsey for
the confidence, patience and knowledge he has provided to me
during my years at the University of North Carolina.
I also would like to thank Dr. Frederic K. Pfaender and
Dr. Daniel A. Okun for generously serving on my committee
and offering their review and constructive criticisms. I am
grateful to all the professors and university staff at
U.N.C, for their knowledge and support while at the School
of Public Health. Finally, I would like to express my
appreciation to Dr. Lorraine Alexander and Carla Oldham for
their friendship as well as assistance.
List of Tables ... iv
List of Figures ... vi
I. INTRODUCTION AND OBJECTIVES ... 1
II. REVIEW OF THE LITERATURE ... 2
A. Enterovirus Persistence and Fate ... 2
A.l. Viral Persistence in the Environment ... 2
A.1.1. Temperature ... 3
A.1.2. Solids ... 5
A.1.2.1 Theoretical Virus-Surface Interactions ... 6
A.1.2.2. Inorganic Solids in Water ... 8
A. 1.2.3. Organic Solids in Water... 13
A.1.2.4. Inorganic and Organic Colloid Interactions ... 15
A. 1.3. Virus Type... 18
A. 1.4. pH Effects ... 20
A.2. Environmental Fate of Enteroviruses ... 22
B. Disinfection ... 24
B.l. Halogen Disinfection Efficiency ... 24
C. Hepatitis A and the U.S. Military... 32
D. Indicator Concept ... 35
E. Iodine ... 36
F. Summary ... 45
III. MATERIALS AND METHODS ...___... 47
A. Worst Case Water... 47
B. Echo and Polio Virus Preparation and Concentration ... 47
B.l. Echo and Polio Virus Stock Purification .. 48
C. Hepatitis A Virus Preparation and Concentration 49 C.l. HAV Virus Stock Purification... 50
D. Halogen Demand Free Water... 51
D.1. Halogen Demand Free Glassware ... 51
E. Virus Stock Preparation... 51
G. Iodine Tablets
(globaline: tetraglycine hydroperiodide) ... 53
H. Bentonite Clay ... 53
H.l. Bentonite Clay Working Stock Solution .... 54
I. Humic and Fulvic Acid ... 54
1.1. Stock Humic Acid Solution ... 54
1.2. Stock Fulvic Acid Solution ... 54
1.3. Working Stock Humic-Fulvic Acid Solution . 55 J. 1% Na2S203 (sodium thiosulphate) Quench Solution ... 55
K. Experimental Protocol ... 56
K.1. Experiment Preparation ... 56
K.2. Experimental Procedures ... 58
K.2.1. Iodine Control Samples ... 58
K. 2.2. Virus Control Samples ... 60
K. 2 . 3 . Test Samples ... 60
L. Virus Assay and Titer Determination ... 60
L. 1. Plaque Assay ... 62
L.2. Radio-Immuno Focus Assay ... 63
L.3. Titer Calculation ... 65
M. Data Analysis ... 66
M.1. Iodine Residual Determination ... 66
M.2. T-99 and T-99.99 values and Linear Regression ... 67
M.3. CT Values ... 68
IV. RESULTS ... 70
A. Introduction ... 70
B. Iodine Residuals... 70
B.l. pH 4.5 ... 71
B.2. pH 7.0... 72
B.3. pH 9.5 ... 73
C. Virus Survival ... 74
C.l. pH 4.5 ... 74
C.2. pH 7.0... 76
C.3. pH 9.5 ... 78
D. T99 and T99.99 Inactivation Values ... 80
D.l. pH 4.5 ... 81
D.2. pH 7.0 ... 82
D.3. pH 9.5 ... 83
E • CT Values... 84
F.l. pH 4.5 ... 86
F.2. pH 7.0 ... 87
F.3. pH 9.5 ... 88
V. DISCUSSION ... 106
A. Introduction... 106
B. Virus Type... 107
C. pH Effects... 108
D. Water Quality... 109
E. Iodine Concentration... 113
F. Virus Inactivation Kinetics by Iodine ... 114
VI. CONCLUSIONS... 118
Appendix A ... 121
Appendix B ... 123
Appendix C ... 125
Appendix D... 127
Appendix E ... 138
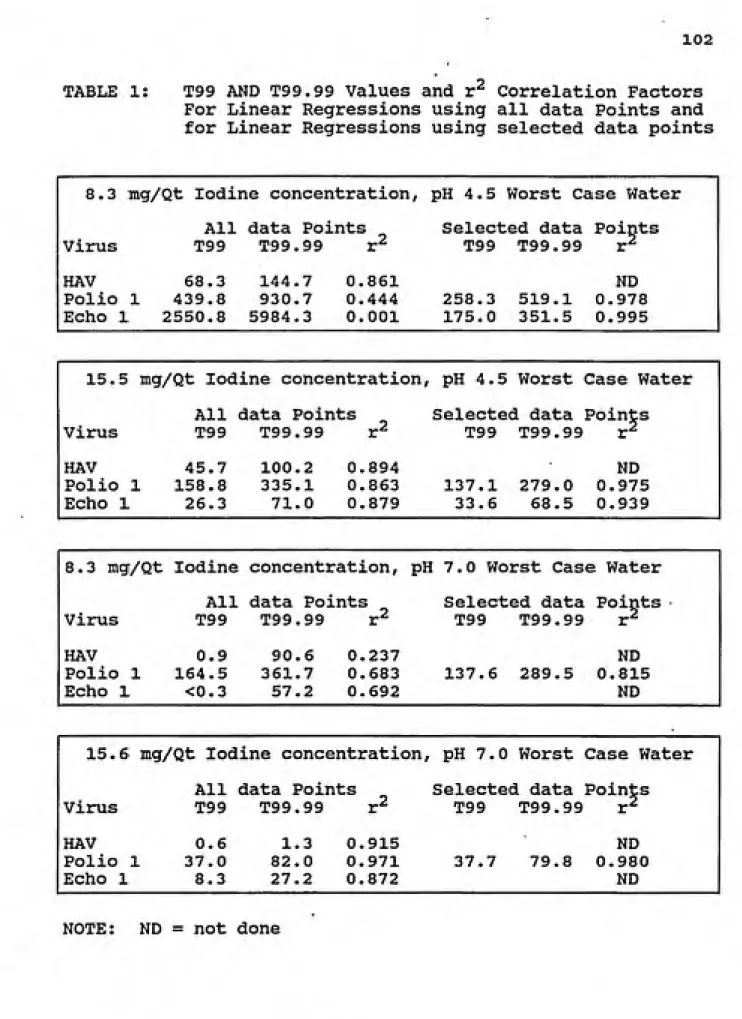
1. T99 AND T99.99 Values and r^ Correlation Factors
for Linear Regressions using all data Points and for Linear Regressions using selected data points... 102
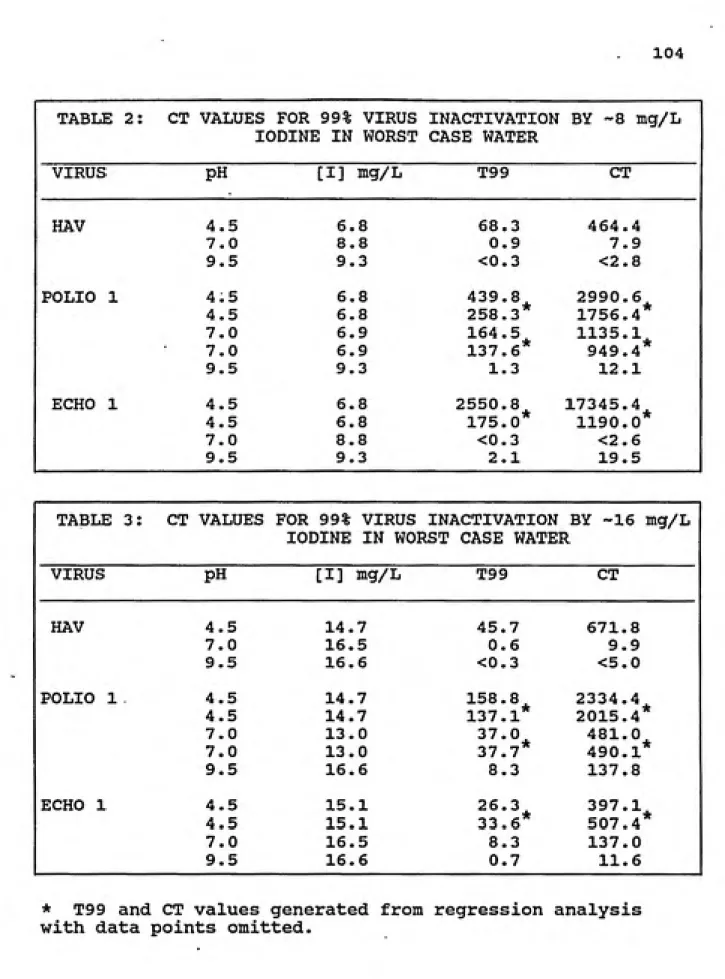
2. CT values for 99% virus inactivation by ~8 mg/L iodine in worst case water ... 104
3. CT values for 99% virus inactivation by ~16 mg/L iodine in worst case water ... 104
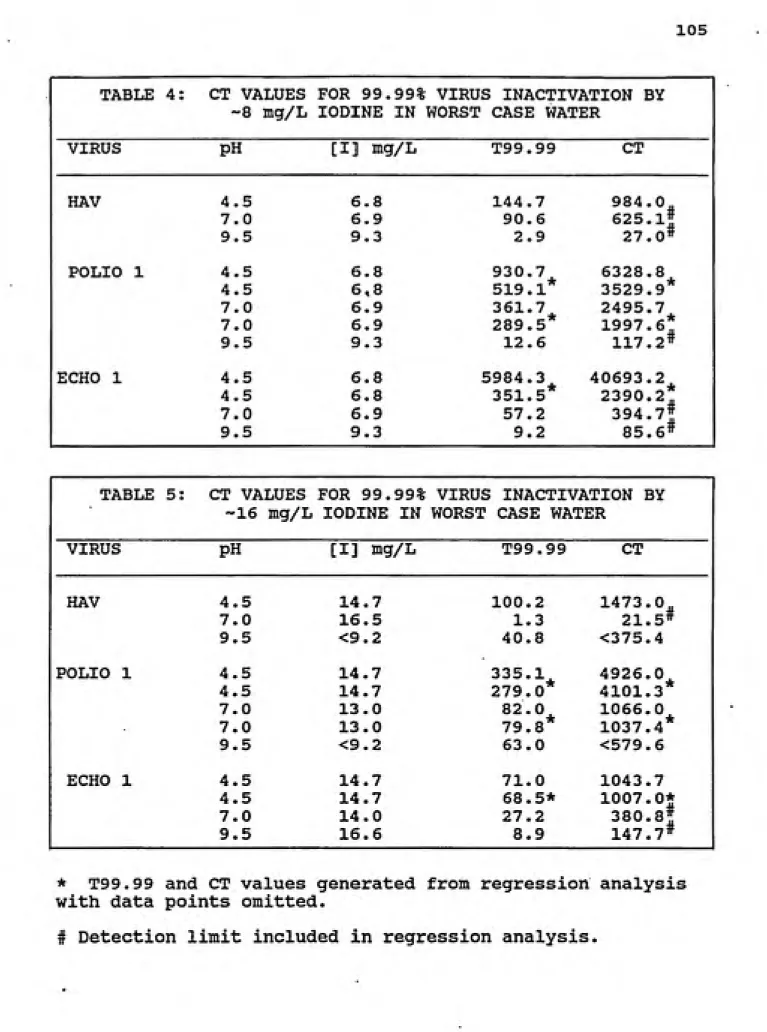
4. CT values for 99.99% virus inactivation by ~8 mg/L iodine in worst case water ... 105
5. CT values for 99.99% virus inactivation by -16 mg/L iodine in worst case water... 105
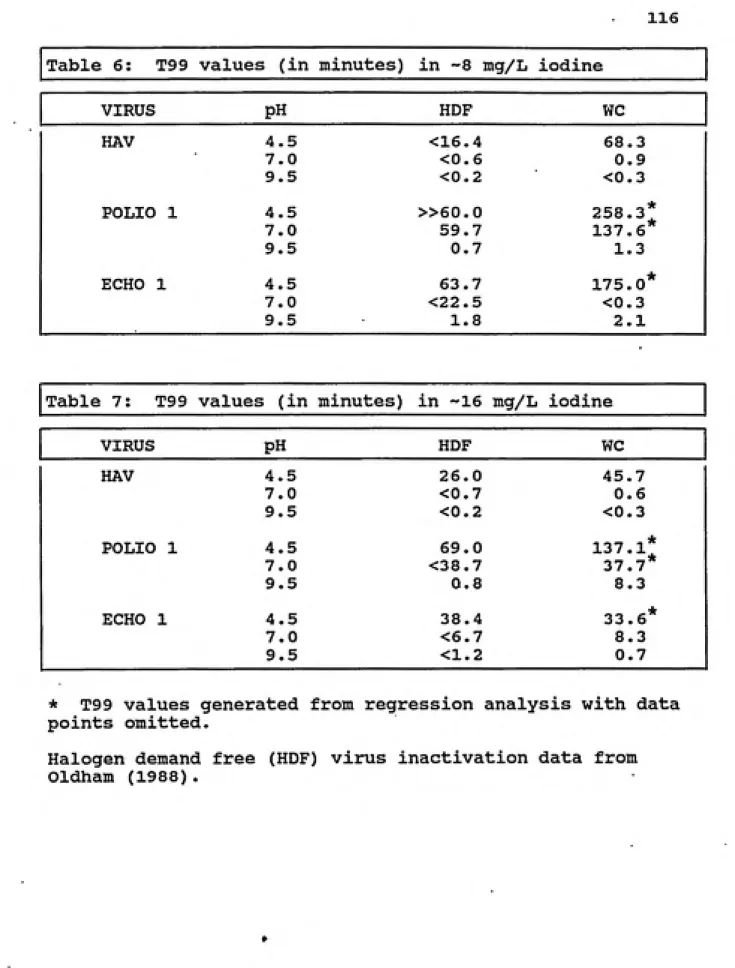
6. T99 values (in minutes) in ~8 mg/L iodine ... 116
7. T99 values (in minutes) in ~16 mg/L iodine ... 116
8. T99.99 values (in minutes) in ~8 mg/L iodine .... 117
9. T99.99 values (in minutes) in -16 mg/L iodine ... 117
Appendix D: 1. Iodine Concentration in pH 4.5 Experiments ... 127
2. Iodine Concentration in pH 7.0 Experiments ... 128
3. Iodine Concentration in pH 9.5 Experiments ... 129
4. Average Percent Iodine Remaining ... 130
5. Inactivation of HAV, polio 1 and echo 1 by 1 Tablet/Quart iodine at pH 4.5 and 5 C in worst case water... 131
6. Inactivation of HAV, polio 1 and echo 1 by 2 Tablets/Quart iodine at pH 4.5 and 5 C in worst case water ... 132
•
8. Inactivation of HAV, polio 1 and echo 1 by 2 Tablets/Quart iodine at pH 7.0 and 5 C in
worst case water ... 134
9. Inactivation of HAV, polio 1 and echo 1 by
1 Tablet/Quart iodine at pH 9.5 and 5 C in
worst case water ... 135
10. Inactivation of HAV, polio 1 and echo 1 by 2 Tablets/Quart iodine at pH 9.5 and 5 C in
1. Experimental Procedures Flow Diagram ... 59
2. Average iodine decay 8.3 mg/Qt, pH 4.5 in HDF
Control, Worst Case Control and Test Sample ... 90 3. Average iodine decay 15.5 mg/Qt, pH 4.5 in HDF
Control, Worst Case Control and Test Sample ... 91 4. Average iodine decay 8.3 mg/Qt, pH 7.0 in HDF
Control, Worst Case Control and Test Sample ... 92 5. Average iodine decay 15.6 mg/Qt, pH 7.0 in HDF
Control, Worst Case Control and Test Sample ... 93 6. Average iodine decay 8.8 mg/Qt, pH 9.5 in HDF
Control, Worst Case Control and Test Sample ... 94 7. Average iodine decay 15.7 mg/Qt, pH 9.5 in HDF
Control, Worst Case Control and Test Sample ... 95
8. HAV, polio 1 and echo 1 inactivation by 8.3 mg/Qt iodine in model worst case water at pH 4.5 ... 96
9. HAV, polio 1 and echo 1 inactivation by 15.5 mg/Qt
iodine in model worst case water at pH 4.5 ... 97
10. HAV, polio 1 and echo 1 inactivation by 8.3 mg/Qt iodine in model worst case water at pH 7.0 ... 98
11. HAV, polio 1 and echo 1 inactivation by 15.6 mg/Qt iodine in model worst case water at pH 7.0 ... 99
12. HAV, polio 1 and echo 1 inactivation by 8.8 mg/Qt iodine in model worst case water at pH 9.5 ... 100
13. HAV, polio 1 and echo 1 inactivation by 15.7 mg/Qt
Previous research on enterovirus inactivation by iodine
in iodine demand free waters has indicated that virus
inactivation efficiency is compromised as water temperature
decreases, pH decreases and iodine concentration is reduced.
Halogen inactivation efficiency is also dependent upon virus
type and the halogen demand characteristics of the water.
The research presented in this report was undertaken to
determine whether or not hepatitis A virus, poliovirus 1 and
echovirus 1 would be inactivated by 99.99 percent (4 log^g
inactivation) under modeled extreme conditions in no more
than thirty minutes. The research objective was to
determine if globaline at its present concentration (8
mg/tablet/quart of water) and present instructions (1 tablet
and thirty minutes contact time, or if water is cold or
cloudy, than 2 tablets and thirty minutes contact time) is
sufficient protection against HAV or other enteroviruses
under emergency field conditions. Modeled extreme
conditions were 5° C water temperature, 5 NTU Bentonite
clay, and 10 mg/L organic acid (5 mg/L humic acid and 5 mg/L
fulvic acid). Duplicate trials were performed at buffered
water pH values of 4.5, 7.0 and 9.5 with iodine
A. Enterovirus Persistence and Fate
A.1. Viral Persistence in the Environment
By definition human enteroviruses are introduced into
the environment by human fecal material. The medium of
entry varies: directly, sewage treatment effluent, septic
tank effluent, sludge, landfills and water reuse. The
result is the same; namely, viral contamination.
Enteroviruses are intracellular parasites of animal
host cells. Consequently they do not reproduce outside the
host animal. However, viruses can persist and may be
transported throughout the environment. Much has been
learned about viral persistence and factors influencing
viral persistence in the natural environment. These influencing factors can be divided into three general
categories: physical, chemical and biological. The primary
physical factors are: temperature, viral adsorption to or
embedment in soil or other particulate matter, soil type and
texture, moisture content, light and hydrostatic pressure.
The primary biological factors are: virus type, viral
aggregation, microbial, protozoan predation and proteolytic
enzyme or other biological by-product effects. The chemical
factors include pH, salt and ion concentration, halogens and
coverage of each factor will not be presented here. Instead
temperature, solids, both inorganic and organic, virus type,
pH-related factors and enterovirus fate will be reviewed.
A.1.1. Temperature
Temperature is the primary factor determining virus
survival in the natural environment. All other variables
being equal, the lower the temperature the greater the virus
survival (Gerba, 1984; Bitton, 1980). Hurst et al. (1980a)
showed that under varying conditions (aerobic sterile, aerobic non sterile, anaerobic sterile and anaerobic non
sterile) poliovirus 1 survived longest at the lowest
temperature (1, 23 and 37° C). Yeager and O'Brien (1979)
found that the rate of poliovirus inactivation in water
saturated soils was temperature dependent. They were able
to recover virus 12 days after 37° C incubation, 92 days
after 22° C incubation and 180 days after 4° C incubation.
Yates et al. (1985) determined that poliovirus 1, echovirus
1 and MS-2 phage decayed faster in 23 degree groundwater
than in 12 and 4 degree groundwater. In 4 degree
groundwater, both polio and echo persisted 28 days before 1
Log (90%) reduction.
Salo and Oliver (1976) performed virus stability
experiments with coxsackievirus A9, poliovirus 3 and
poliovirus 1 under pH values of 3, 5, 7 and 9. The greatest
inactivation at 2° C. Less than 5 Log reduction occurred
over 12 days at 2° C, for all but one of the viruses under
all pH conditions tested.
Hauchman et al. (unpublished) tested HAV, poliovirus 1
and echovirus 1 and found that at 5° C, T99 values for the
virus were greater than 8 weeks in groundwater, 12 weeks in
primary effluent and 16 weeks in secondary effluent.
Research suggests that temperature dependent viral
inactivation may be caused by a range of different
mechanisms' Block (1983) lists possible mechanisms for
temperature dependent inactivation as: viral capsid
disruption, viral RNA alteration, oxidation, water molecule
bombardment and increased microbial activity at higher
temperatures (leading to enzymatic degradation and
predation). O'Brien and Newman (1977) performed
inactivation experiments with radio-labeled poliovirus 1 and
coxsackievirus B-1. They reported that above 44° C
inactivation is largely due to capsid disruption. Below 44°
C, inactivation is dependent upon RNA degradation. They
suggest that both mechanisms may have occurred at the same time in their experiments. Block (1983) cites research by
Dimmock (1967) with poliovirus that supports higher
temperatures lead to capsid degradation and lower
temperatures lead to viral nucleic acid disruption. It is
temperatures less microbial activity occurs and suggests
that fewer proteolytic enzymes are manufactured and therefore less viral degradation occurs at lower
temperature. Hurst et al. found that under air tight
conditions viral inactivation decreased compared to open
conditions. The inactivation rates could be explained by differences between aerobic and anaerobic microbial
activity. Block (1983) states that freezing could effect capsid integrity and structure. Block also reports that between 37 and 50° C oxidation is the most
critical-inactivating factor.
Most likely, inactivating mechanisms are mediated by temperature, somewhat in the manner described by Sattar
(1981). He suggests that increased temperature acerbates the degradation mechanism leading to increased inactivation rates. Compared to other viral groups, enteric viruses are
more heat stable (Melnick and Gerba, 1980).
A.1.2. Solids
Solid-virus association is important to viral
persistence in the environment. Block (1983) describes viruses in a water environment as typically either solid-associated or quickly adsorbed to solids and cites Gerba et al. and Wellings et al. in demonstrating that the majority
of enteroviruses in a water environment are solid
than 99 percent of "free" enteric viruses adsorb to
estuarine sediments under varying conditions, while Gerba quoted in Bitton (1980b) found bacteria and enteric viruses
in greater concentrations in coastal sediments than in the
water column.
A.1.2.1. Theoretical Virus-Surface Interactions
Enteroviruses can be described as electrically charged colloidal particles. These charges are due primarily to
ionized carboxyl and amino groups present on the virus
capsid (Bitton, 1980a; Bitton, 1975). Gerba (1984) reviewed
the theoretical behavior of colloidal (virus, clay etc.)
particle adsorption. Significant colloidal interactions are
interdependent upon double-layer and van der Waals forces. Dispersed individual colloids are observed to carry an electrical charge, but colloidal systems as a whole remain electrically neutral. Virus (and other colloid) surface charges attract opposite charges from the surrounding medium
into a compact area known as the Stern layer. The ions are
held in the Stern layer by electrostatic and van der Waals forces which are strong enough to overcome thermal
agitation. A diffuse outer layer of ions (the Gouy layer)
is composed of opposing counter charges to the Stern layer.
The Gouy layer charges serve to neutralize the Stern layer
charges. Thermal agitation and Brownian motion prevent the
of the Gouy layer (shear plane) is defined as the Zeta
potential. If ion concentration in the suspending medium is of sufficient concentration to allow significant size
reduction of the Stern-Gouy layers, or if colloidal surface
charges can be lessened by ambient constituents, then van
der Waals forces (which are always attractive) can be of
consequence and adsorption is more likely to occur between
particles (Gerba, 1984; Metcalf and Eddy, 1979).
Surface adsorption is a dynamic process but eventually equilibrium is achieved and the rate of adsorption is equal to the rate of desorption. This assumes there are a fixed
number of accessible, equal energy adsorption sites
available on the colloid surface, and that adsorption is a
reversible process (Metcalf and Eddy, 1979). Adsorption
equilibrium is thought to be dependent upon amount and type
of colloidal substrate present (viruses, inorganic and organic solids) and temperature (Gerba, 1984). The
literature describing adsorption is contradictory. Gerba (1984) states that virus adsorption may be diffusion limited or dependent upon virus charge. Moore et al.(1981) report that virus-surface interactions are first order reactions
and concentration dependent. Bitton, cited in Taylor et al. (1980), reports that enterovirus adsorption efficiency is controlled by diffusion, surface charge of interacting
clays and silt in waters (Rao and Melnick, 1986).
Typically, virus adsorption is described as a single
layer adsorption, but viral aggregations or competing
substrate (organic acids) may lead to complexed particles.
Invagination and phagocytosis may also complicate virus
adsorption phenomena. Viruses excreted from host are
characteristically embedded in a matrix of fecal material.
Viruses in natural waters are usually associated with both
organic and inorganic solids, therefore environmental
effects on virus adsorption and transport are usually a
mixture of competing but interrelated interactions.
A.1.2.2. Inorganic Solids in Water
Inorganic components of natural waters are composed of
various dissolved and suspended particles. These may
include clays, salts, asbestos particles, iron and aluminum
oxides and hydroxides, quartz, amorphous silica, carbonates
and feldspar (Safe Drinking Water Committee, 1977).
Suspensions of sands (2.00 mm 0.05 mm), silts (0.05 mm
-0.002 mm) and clays (less than or equal to -0.002 mm) are
determined by the suspending water's velocity (energy)
(Bitton, 1980a). Clays, because of their large surface area
to volume ratio and ionic content, are the most adsorptive
components of natural waters.
The clay particle size limit is by definition less than
fundamental unit of clay minerals is the SiO^ tetrahedron
with a silicon atom located in the center of four corners of
oxygen atoms. The oxygen atoms are connected to aluminum,
iron or magnesium ions predominantly in one of two forms.
Type I clays (e.g. Kaolinite) are linked by three of the
four corners to form a hexagonal platelet in which the
oxygen atom tips all point in the identical direction. The
clay sheets are connected by weak hydrogen bonds. This clay
form is also identified as a two layer type clay because of
the 1:1 ratio of Si02 to AI2O3. Type II clays (e.g.
Illite, Bentonite) consist of an octahedral layer of two
sheets of closely packed oxygen atoms or hydroxyl ions with
the metal cations located in octahedral coordination. This
2:1 ratio of Si02 to AI2O3 is considered a three layer type
clay (Bitton, 1980). Three layer type clays are further
defined as expanded (e.g. Montmorillonite, Bentonite) and
non expanding (e.g. Illite) clays. Expanded clays have
water molecules between the clay sheets that increase the
surface area; non expanded clays do not. Bitton states that
expanding three layer clays are better adsorbents then non
expanding three layer (e.g. Illite) or two layer (e.g.
Kaolinite) clays (Bitton, 1980).
Clay charge is dependent upon suspending solution pH
(Young and Sharp, 1985; Moore et al., 1981 and Bitton,
one clay is a model for all clay pis (Gerba, 1984). Just as
the pi varies among clay types, the pi also varies among
virus types and strains (Goyal and Gerba, 1979). The
general trend is lower pH (less than 7) greater virus-clay
adsorption; greater pH (above 7) less adsorption to clay
particles (Gerba, 1984; Bitton, 1980b). Taylor et al.
(1981) has shown there is a critical pH where the virus and
soil go from strong to weak uptake. These transition pH
values are typically nearest the unique virus type and soil
type isoelectric points.
Gerba (1980) states that pH is the major variable
determining virus adsorption to soils. Reduction of pH
(increase of protons) leads to increasing reduction of the
double layer repulsion between clays and viruses. Research
by Moore et al. (1981) and Taylor et al. (1981) onpoliovirus adsorption to minerals, soils and clays indicated
that as pH increased, poliovirus adsorption was reduced.
However, different substrates effected adsorption
efficiency. The authors explained the repulsion as an
increase of double layer repulsion forces that inhibit van
der Waals attractions. Research by Sobsey et al. (1980)
also supports virus adsorption as being pH-dependent and
that soil type is important to the efficiency of adsorption.
Research (Moore et al.,1981; Sobsey et al.,1980; Turk et al., 1980; Moore et al., 1975; Carlson et al.,1968) has
shown that an increase in cation concentration also
Conversely, a decrease in cation concentration (e.g.
rainwater or deionized water) leads to increased elution of
enteroviruses from inorganic solids (Bitton, 1980b; Melnick
and Gerba, 1980; Sobsey et al., 1980). Bitton (1980a)
states that this behavior is also virus strain and type
dependent.
Moore et al. (1981) report that virus adsorptions by
clays and soils usually reaches an equilibrium in 10 to 60
minutes. Sobsey et al. (1980) support Moore with studies
involving poliovirus 1 and reovirus 3. They report
equilibrium was generally achieved in 15 minutes. Carlson
(19 68) reports coliphage T2 and poliovirus 1 achieved 90
percent of maximum virus adsorption to Kaolinite,
Montmorillonite 23 and Illite 35 during the initial 5
minutes of contact time. Maximum adsorption was at
approximately 15 minutes. The adsorption process was
reversible.
Research indicates that pure clays and soils rich in
clays are more adsorptive than sands and soils with lower
percentage clays. Bitton (1980b) cites studies on T2 phage
by Gerba and Schaiberger. T2 adsorbed between 43 and 91
percent on clay compared to 0 to 9 percent on sand. Moore
et al. (1981) reported on poliovirus adsorption by 34
minerals, soils and clays. Their research showed a strong
correlation between increased virus adsorption and lack of
also showed a strong correlation between available negative
substrate surface charge and viral adsorption. The greater
the negative charge the less virus adsorbed to substrate
surface. It is interesting to note that 32 of the 34 soils
tested adsorbed greater that 91.5 percent of the available
poliovirus. Sobsey et al. (1980) found that Bentonite and
Kaolinite clays adsorbed more poliovirus and reovirus than
Lakeland and Fripp sand. Both clays and sands had less than
1 percent organic material in their makeup.
Natural river clays and soils have shown similar viral
adsorption properties and behavior compared to pure clay
minerals. Carlson et al. (1968) reported that river clays
increased viral adsorption with increased cation
concentration. Ninety percent of maximum adsorption
occurred during the initial five minutes of contact and
adsorption was reversible. The Safe Drinking Water
Committee (1977) reported that Berg found viruses more often
in silt filtered from river water than from river water
itself. It was suggested that the efficiency of recovery
was less from silt than water because more virus were
adsorbed to silt than suspended in the water.
Lund and Nissen (1986) reported that bentonite clay is
used by Sudanese to disinfect Nile River water. Their
research showed that if proper flocculation occurred, 3 to 4
logiQ units of virus would be removed from river water.
Schaub and Sagik (1975) suggest that water quality
They found viruses adsorbed to clay particles more rapidly
in wastewater (primary sewage effluents) than in tap water.
Hurst et al. (1980a) determined that the sludge layer and
upper soil layer of a rapid infiltration basin contained
large concentrations of enteroviruses. In Bitton's review
of virus adsorption (1980b), Duff is cited as finding 25 to
75 percent of viruses attached to solids in wastewater.
Wellings et al. are quoted as finding 68 to 90 percent of
bound viruses in effluent and influent taken from a Florida
package treatment plant.
A. 1.2.3. Organic Solids in Water
As stated previously, it is not representative of
natural conditions to separate inorganic and organic
components in natural waters. For example, in instances
where inorganic particles are coated with organic fractions,
the predominate effect will be from organic constituents
(Safe Drinking Water Committee, 1977). Most of this organic
material is known as humus. Humus constitutes greater than
80 percent, by weight, of all organic material in natural
waters and makes up a significant portion of the total
organic carbon (TOC) content of natural waters (Black and
Christman, 1963).
Historically, humus is divided into three fractions:
humic acid, fulvic acid and humin. Physical complexity and
resistance to degradation increases from fulvic acids to
humic acids to humin. The fractions are divided according to
Humic acids are soluble in strong bases. The
predominate humic acid fractions have molecular weights of
several thousand and may be aggregated in solution. The
degree of aggregation or association is pH and concentration
dependent. In low concentrations the acids are dissociated.
Humic acids are primarily composed of polycarboxylic
aromatic acidic and aliphatic groups. They may also contain
phenolic and quinoid groups (S.D.W.C., 1977).
Fulvic acids are soluble in both acidic and basic
solutions. Fulvic acids are believed to be the predominate
fraction of humus and impart yellowish-brown colors to
waters. Fulvic acids are similar in structure to humic
acids but of lower molecular weights. The fulvic fractions
may also contain compound groups such as protein,
polysaccharides and aminosugars (Bitton, 1980; S.D.W.C.,
1977).
Kononova has suggested that humin is humic acids bound
to mineral constituents in soil. He was able to dissolve
the organic fraction in a strong basic solution by repeated
alternate strong acid, base washings (S.D.W.C., 1977).
Humus components are thought to arise from organic debris
(predominantly vegatative) incompletely degraded by
microfauna and flora. Either anaerobic or aerobic
conditions can lead to humus formation.
properties allow humic and fulvic acids to effect
enterovirus adsorption to and elution from both organic and
inorganic solids. Gerba (1984) states that humus adsorption
effects are caused primarily by organic acid functional
groups, not molecular weights. Metcalf and Eddy, list three
general organic polyelectrolyte adsorption processes.
Because enteroviruses are negatively charged, humic and
fulvic acids may act as a coagulant by lowering the capsid
charge. Secondly, humic and fulvic acids may act as an
interparticle bridge by adsorbing particles along the
molecule. This process can be further extended by particle
chains attaching among themselves. The third process is a
combination of the other two processes. The virus charge is
both lowered and particle bridges are formed (Metcalf and
Eddy, 1979). The Safe Drinking Water Committee (1977) cites
Khan and Schnitzer as proposing humic acids may also act as
a "molecular sieve" by trapping virus particles in a three
dimensional matrix. It is probable that all these forces
interact in unique ways depending upon virus type, pH and
organic acid and soil composition.
A.1.2.4. Inorganic and Organic Colloid Interactions
Humus soil components effect inorganic soil components
both ionically (surface charge) and physically (surface
structure, texture, aeration and water holding capacity)
forces (e.g. non-polar van der Waals forces), columbic
interactions, ion-dipole and coordination interactions, and
entropy effects.
As described previously, humic and fulvic acids are
generally anionic polymeric colloids either dissolved,
suspended in solution or attached to solids. Clays are
predominantly colloidal platelets of aluminosilicates with
polyvalent metal ions dispersed throughout. Theoretically,
organic anions are repelled by negatively charged clay
material. However, most evidence indicates that iron and
aluminum oxides are the primary groups involved in organic
adsorption to expanding lattice type clays. At lower pH
values, isomorphic substitution and ion exchange may allow
polyvalent ions (e.g. iron, magnesium, aluminum) to form a
cation bridge between inorganic soil and organic colloid
surfaces. Cation exchange capacities of humic materials
may reach 200 meq/100 g soil to greater than 500 meq/100 g
soil (S.W.D.C.,1977; Bitton, 1980). Polyhydrous oxide
complexes are readily formed by iron and aluminum ions at
clay surfaces. The negative charge and the complex makeup
of the humic material will allow interaction with inorganic
colloid surface charges. This interaction presumably allows
reduction of double layer forces and adsorption to the
inorganic substrate.
were reduced on Virosorb 1 MDS filters in the presence of
humic and fulvic acids. They explained the reduction by
interactions and possible virus-acid complexing. Bixby and
O'Brien (1979), using bacteriophage (MS-2) and fulvic acid,
demonstrated that the acid could block adsorption sites on
soils. They also determined that fulvic acids could complex
with MS--2 and that decomplexation would occur under certain
circumstances. The viruses were reported to be viable after
decomplexation occurred. Gerba (1984) reported that humic
materials reduced poliovirus adsorption to magnetite.
Taylor et al. (1981) and Moore et al. (1981) found that
soils with the greatest organic material content were poorer
absorbents of poliovirus and reovirus. Sobsey et al. (1980)
reported that poliovirus adsorbed less to Ponzer muck than
to clays.
Laboratory experiments using water with seeded
poliovirus showed less adsorption to sandy soils from humic
colored water (420-750 color units) than from tap water.
Approximately 80 percent of the virus in a highly colored
water (2000 color units) passed through sandy soil columns.
After treating the leachate with activated carbon to remove
the color, virus adsorption increased in the soil columns
(Bitton, 1980).Viral adsorption to soils in the presence of sewage
wastewaters appears to increase. Bitton (1980) reports that
poliovirus suspended in activated sludge effluent was
rainwater were filtered through the coluions only 0.008
percent virus was detected in the leachate. Bitton states
that activated sludge effluent can have a conductivity of
500-700 umhos/cm. Lance and Gerba (1984) observed that
poliovirus 1 suspended in sewage effluent adsorbed more
readily to solid substrate than poliovirus in deionized
water. They proposed that greater adsorption is related to
greater ionic strength of the suspending solution. They
also reported viral elution was decreased in the presence of
dissolved organic compounds in the solution.
A.1.3. Virus Type
Environmental factors exert pressure to select viral
strains that are more successful at surviving outside their
host to ultimately reach another host and reproduce.
Thurman and Gerba (1988) state that poliovirus evolves at a
rate of approximately 2 RNA bases per week. They point out
that at this rate it would be possible for poliovirus to be
completely transformed in as little as 71 years. Whether
this actually would occur is not known, but different
conformations of virus strains are known to exist. Often
these different conformational groups have different
isoelectric points (Thurman and Gerba, 1988). Isolated
enterovirus epidemics could lead to genetic shifts.
Hurst et al. (1980b) found that in 9 soil types
inactivation of MS-2 phage, T2 phage and poliovirus 1
varied. The only consistent result was that MS-2 decayed
(coxsackie A9, coxsackie B3, echo 1, polio 1, T2, MS-2 and
rotavirus SA-11) in FM soil decayed by 3 logs or less at
varying times between 3 and 30 days.
Yates et al. (1985) reported on inactivation rates of
poliovirus 1, echovirus 1 and MS-2 coliphage in 11
groundwater samples from the United States. The rates
varied for different viruses in different waters. They
reported that the only significant factor effecting virus
survival was water temperature. They also reported that
MS-2 inactivation rates were equal to or less than the
enteroviruses in most of the waters tested and that
statistically there was no significant correlation between
decay rate and virus type tested. They suggest using MS-2
as a model for enterovirus behavior in groundwater.
Hauchman et al. (unpublished), in studies performed at
University of North Carolina, determined hepatitis A virus,
poliovirus 1 and echovirus 1 survival in groundwater,
secondary and primary effluents and saturated soil
suspensions under both sterile and non sterile conditions.
At 25° C in soil free groundwater, secondary effluent and
primary effluent, HAV survived longer than the polio or
echovirus. The same results were observed in soils
saturated with groundwater, secondary and primary effluents.
Temperature and microbial activity appeared to effect HAV
less than polio and echo under these conditions.
differences leading to variances in enterovirus survival.
The enteroviruses (polio 1, 2 and 3 and coxsackievirus A-7,
A9, Bl, B2 and B3) were subjected to conditions of pronase
and trypsin for two hours at 37° C. Coxsackie A-9 was the
most sensitive to the enzymes tested being inactivated
greater than 2.5 logs by trypsin and greater than 3 logs by
pronase. Coxsackie A-7 and B2 were inactivated by pronase
greater tan 1 log reduction. Trypsin, except for coxsackie
A-9, had little or no effect on the viruses. Pronase had no
effect on poliovirus 2 and 3 and coxsackievirus Bl and B3.
Poliovirus 1 was inactivated six percent by pronase.
As discused previously, isoelectric points are
different for different viral strains and types (Gerba,
1984). The interactions between virus particles and
environmental components lead to different behavior and
survival rates. Adsorption, aggregation and consequently,
survival are directly and indirectly effected by virus type
and hydrogen ion concentration.
A.1.4. pH Effects
Generally, ion concentration effects virus survival.
Specifically, hydrogen ion concentration effect virus
survival through direct (aggregation, adsorption, virus
capsid conformational form and capsid susceptibility) and
indirect effects (metal and other ion concentrations and
species, turbidity and light protection, protection by
adsorption surface [both physically and by organic enzyme
other colloids creating a viral (physio-chemical) protective
complex.
As discussed above, adsorption and viral aggregation
are pH dependent. The general trend is the greater the pH
the less enterovirus adsorption (Hurst, Gerba, Cech, 1980b;
Melnick and Gerba, 1983; Bitton, 1980a; etc.) Research has
shown that virus adsorbed to inorganic and organic particles
have a greater tendency towards capsid stability (Melnick
and Gerba, 1983). Young and Sharp (1977) report the natural
state for poliovirus in fresh waters is aggregation.
Indirectly, pH-mediated adsorption and aggregation can
lead to increased virus survival through UV protection and
increased turbidity (light attenuation) (Bitton, 1980b).
Gerba (1984) reported research that revealed enteroviruses
were protected from ribonuclease degradation by clay
absorption of the enzyme. Alternatively, increased pH can
cause metals to precipitate out of solution attaching to
virus or solids associated with the virus leading to
inactivation.
Salo and Cliver (1976) and Sattar (1981) note that
enteroviruses are acid stabile and have adapted to the
alimentary tract (pH usually less than 3). Young and Sharp
(1985) also report that enteroviruses can have unique pH
dependent conformational forms. Their research shows that
echovirus has at least two different conformational forms
(1976) report that enterovirus inactivation mechanisms are
different at different pH values. They state that at an
alkaline pH greater than 8, capsid dissociation occurs.
High-pH lime wastewater treatment processes are used to
inactivate picornavirus (Sattar,1981).
A.2. Environmental Fate of Enteroviruses
Increased virus transport and/or increased virus
persistence can be a direct consequence of virus adsorption
to clay and solid surfaces. Once viruses are introduced
into an environment they may remain where deposited or they
may be transported vertically and/or laterally. As
discussed previously, adsorption processes maybe reversible,
consequently, viruses can be transported either freely or in
a sorbed state. The adsorption-elution processes may be
repeated countless times through identical or through
different stimuli (e.g. salt concentration, pH, soil
composition, virus aggregation, etc.). Each occurrence
could transport the viruses further (Gerba, 1984; Sattar,
1981; Bitton, 1980b). Larger particles (and viruses
associated with particles) settle faster than smaller
particles (Stoke's Law). Consequently, increased water
velocity or disturbances (e.g. wave actions, dredging
operations, snow and water runoff, increased rainfall, etc.)
may resuspend free and solid associated viruses (Bitton,
1980b). It should be noted, that finer sized clay particles
are more easily suspended in water and are usually more
1980b). Gerba states that repeated wastewater applications
on land, along with repeated adsorption-elution cycles could
result in a phenomenon whereby a concentrated plug of
viruses could be eluted during a rainfall (Gerba, 1984).
Melnick and Gerba (Rao and Melnick, 1986) list factors that
contribute to viral migration in surface and ground waters.
These include sewage treatment plant and septic tank
effluents, sewer line leakage, sludge disposal and leachate,
water reuse for irrigation, injection wells, soil faults and
channelization.
Block (1983) has cited examples of virus transport.
Enteroviruses were detected in a ship channel up to 13
kilometers away from their source. Dahling and Safferman
are cited as detecting viruses 317 kilometers from their
suspected source. Dahling and Safferman also reported that
30 percent of the viruses were detected 300 kilometers away
their suspected source after 7.1 days of transport. HAV has
been detected in ground waters. Rao and Melnick (1986)
report that Hejkal, Gerba, Melnick et al. detected HAV,
Cocksackie B2 and B3 antigen in well water in Georgetown,
Texas in June, 1980. Sobsey et al. (1986) recovered
virulent HAV from contaminated water and from four
groundwater wells at St. Martin's Crossroads, Maryland in
1984. Other reports of active virus recovery include polio
1, echo 27 and 29 isolated from a 95 foot deep well in
Maryland and polio 2 recovery from a well in Michigan (Rao
B. Disinfection
Disinfection is the process whereby disease causing
organisms are removed or inactivated thereby preventing
disease transmission. Historically, chlorine has been used
as the primary method to disinfect drinking water
distributed in developed communities and cities in the
United States. The controlled nature of the water treatment
processes and the distribution systems has allowed processes
employing free chlorine as a drinking water disinfectant to
function well and usually prevent disease transmission in
systems where integrity is maintained and combined chlorine is kept to a minimum.
B.l. Halogen Disinfection Efficiency
The Safe Drinking Water Committee (1980), reviewed
factors that effect viral inactivation efficacy during
disinfection. They include: water quality, pH, temperature
and organic and inorganic constituents; viral type,
concentration and aggregation state; laboratory organisms
versus "naturally occurring" organisms; physical and
chemical water treatment processes; disinfectant
application; disinfectant demand and chemical reactions;
disinfectant concentration and residual. The inability to control these factors often caused early disinfectionexperiments (before 1945) to produce unsubstantiated or
Many of the same factors that.effect enterovirus
survival in the environment also effect disinfection
efficacy (Chang, 1971). The explanations for increased
viral persistence during disinfection are based upon the
previously discussed environmental effects and will not be
discussed here.
The halogens associated with water disinfection are
chlorine, bromine and iodine; their atomic weights are
35.45, 79.90 and 126.90, respectively. In aqueous halogen
solutions, water pH, temperature and ionic strength
determine the free halogen species present and their
relative concentrations (Chang, 1971; Hoehn, 1976; Snoeyink
and Jenkins,1980). The halogen species present effect disinfection efficacy. In aqueous solution, without
nitrogenous containing compounds, the predominate halogen
(represented by X) species that are active disinfectants,
are the elemental form (X2), the hypohalous acid (HOX) and
the hypohalite ion (OX") (Chang, 1971). Under aqueous
conditions, the elemental form will undergo hydrolysis and
form the hypohalous acid. The general hydrolysis equation
is represented as: X2 + H2O <=> HOX + H"*" + X~.
Hypochlorous (pK^ at 25°C = 7.5), hypobromous (pK^ at 25°C =
8.4) and hypoiodous (pK^ at 25°C =9.5) acids are relatively
weak acids with their strength decreasing, respectively
(Snoeyink and Jenkins, 1980). Hypohalous acid ionization is
conditions between pH 4.5 and 9.5 and temperature around
25°C, water without nitrogenous compounds will not contain
elemental chlorine (CI2)• Hypochlorous acid (HOCl) will
predominate below pH 7.5 while hypochlorite (0C1~) ion will
predominate above pH 7.5. Under the above conditions,
elemental bromine (Br2) will predominate below pH 4.1;
hypobromous acid (HOBr) will predominate between pH 4.1 and
8.4 ; above pH 8.4 hypobromite (OBr~) ion will predominate.
Under the above conditions, iodine will be primarily in the
elemental (I2) form below pH 8; between pH 8 and 12
hypoiodous acid (HOI) will predominate. lodite ion (0I~) is
not important as a disinfectant species because dissociation
occurs at a pH (above 12) not normally encountered in natural waters (Snoeyink and Jenkins, 1980; S.D.W.C.,
1980).
Water components may react with halogens causing other
chemical reactions as well as exerting halogen demand which
can reduce disinfection efficacy. Snoeyink and Jenkins
(1980) discuss the four types of halogen demand reactions
that can occur. They are (1) reactions that are promoted by
sunlight, (2) reactions that occur with inorganic compounds,
(3) reactions that occur with organic compounds and (4)
reactions that occur with inorganic ammonia. Oxidation reactions account for most of the halogen demand in natural
waters. Aqueous halogen solutions are not stable when
exposed to sunlight. Ultraviolet radiation introduces
halite ions. It is a significant halogen demand in waters
exposed to sunlight.
Most research on inorganic reactions with halogens has
been on chlorine. Chlorine is used to oxidize Fe(II),
Mn(II) and S(-II) in groundwaters. Reactions between
chlorine and reduced inorganic compounds usually are rapid.
All of the reduced inorganic ions will be oxidized before
chlorine residual will be detectable. Other inorganics also
effect halogen microbial interaction and consequently reduce
disinfection efficacy. Kuzminski, Feng and Liu (1970)
reported that E. coli survival increased under conditions of
pH 5.0 and 7.0, with water temperature less than 3°C and
CaC03 (calcium carbonate) concentrations of 600 mg/L for
both chlorine and bromine disinfection experiments. They
hypothesized that reduced bacteria inactivation could have
been caused by Ca"*" ions physiochemically blocking
halogen-cell interactions or E. coli clumping caused by the CaC03.
Organic compounds (living, dead and dissolved material) will interact with halogens forming complex halo-organic compounds of weak disinfection power and or exerting halogen
demand (Gottardi,1983; S.D.W.C., 1980; Snoeyink and Jenkins,
1980). Gottardi (1971) states that chlorine reacts with
organic compounds about three times faster than iodine and
that bromine reacts with organic compounds about 4 times
faster than iodine, under similar conditions. The halogens
the reactions are dependent upon the base strength of the
amines. These haloamines may function as a weak oxidant
many times less powerful than the free halogen species but
will also exert a demand on halogen disinfection capability.
Chlorine and bromine readily substitute to phenolic groups.
These reactions are pH dependent, therefore species and concentrations formed are pH and temperature dependent
(S.D.W.C., 1980; Snoeyink and Jenkins, 1980).
Quails and Johnson (1983) researched fulvic acid free chlorine consumption in natural waters. In many natural
waters humic substances may represent the major
non-nitrogenous chlorine demand. Their research revealed that
halo-humic reactions typically form a curvilinear halogen
consumption response. They were able to model fulvic acid
chlorine consumption by two discrete second order reactions.
The first reaction occurred from zero to thirty seconds of
chlorine contact. Data plotted from this reaction generally
showed a curved downward trend and was called a "fast"
reaction. The second reaction occurred from thirty to three
hundred seconds and was called a "slow" reaction. Data
plotted from the second reaction generally showed a slight
downward trend. Dissolved organic carbon concentrations
that were approximately equal, consximed free residual chlorine in approximately equal amounts both during the
initial "fast" reaction and during the second "slow"
reaction. Chlorine consumption changed little between pH
model may be used to predict short term fulvic acid
consumption of free chlorine.
The halogen demand created by ammonia is different from
other inorganic halogen demand reactions (Snoeyink and
Jenkins, 1980). Chlorine and Bromine will react with
ammonia stepwise to produce halogenated ammonia compounds
called chloramines and bromamines. The reaction products
vary with pH, temperature, halogen concentration, ammonia
concentration and reaction time (Snoeyink and Jenkins, 1980;
S.D.W.C., 1980). Iodine does not react with ammonia to
produce iodamines (Gottardi, 1983).
For chlorine, monochloramine (NH2CI) is the predominate
chloramine formed at pH greater than 8 and molar ratio of
hypochlorous acid to ammonia is 1:1 or less. Monochloramine
production is optimized in a pH range of 7 to 8 and a
chlorine to ammonia ration 5:1 (weight) or less. Below pH 7
to around pH 4.5 with higher chlorine to ammonia ratios
dichloramine (NHClj) is favored; below pH 4.5 trichloramine or nitrogen trichloride (NCI3) is formed (S.D.W.C., 1980).
Chloramines are stable and are capable of virus inactivation
but are many times less powerful than hypochlorous acid or
hypochlorite ion.
Bromine and ammonia undergo similar reactions to
chlorine and ammonia in an aqueous media, inorganic bromamines, unlike inorganic chloramines, are labile and
easily convert between species. For this reason bromamine
also decompose rapidly into nitrogen gas and bromide
(S.D.W.C, 1980). Bromamines are also capable of virus
inactivation but as with chloramines are less powerful than
free bromine species.
Iodine's inability to react in any appreciable way with
inorganic ammonia and fonti stable iodamines as well as its
much slower reaction rates with proteins eliminates the
major sources of halogen demand that effect chlorine and
bromine (Gottardi,1983). For these reasons, in waters of
poor quality more free iodine species are available for
pathogen inactivation.
Feng (1966; S.D.W.C, 1980) proposes that active
chlorine disinfectant species should be listed in descending
order of strength:
Cl2> H0C1> 0C1"> NHCl2> NH2C1> R-NHCl.
Research cited in Drinking Water and Health (S.D.W.C.,1980)
generally supports this generalization. Free and combined
bromine species show similar trends in disinfectant
efficacy. As with any generalization there are deviations
from the trend, not the least of which are specific pathogen
sensitivities.
Halogen inactivation of enteroviruses are based upon
one of three mechanisms. They are: (1) capsid structure
alteration, thereby preventing host cell attachment; (2)
nucleic acid alteration, preventing virus replication by the
host cell; or (3) both mechanisms functioning together. As
discussion over which of these mechanisms is the most
appropriate and how they operate. Chick described
disinfection as a first order chemical reaction, Watson described the multi-hit theory of disinfection. Chang
(1971) presented an overview of disinfection research to
1971 and discussed the importance of virus aggregation in
disinfection data. He stated that nucleic acid denaturation
involves more energy than destruction of sulfa-hydral groups and that research indicated capsid inactivation is a direct process. Chang stated that survival data other than
exponential reduction is dependent upon aggregation size.
Recently, Thurman and Gerba (1988) reviewed
disinfection research on viral inactivation. They pointed out the importance of the disinfectant type in determining
the mechanism of inactivation. Thurman and Gerba cite
research by Young and Sharp (1985) that chlorine alters poliovirus capsid conformation. It is not known if these capsid changes are permanent, but they do alter the virus infection efficacy. Research was also cited that chlorine
and chlorine dioxide will react with viral nucleotides under
specific conditions (Dennis, 1979; Dennis et al., 1979).
These contrasting research finding were explained by a report by Alverez and O'Brien (1982) that chlorine
inactivation is dose related. They reported that chlorine concentrations less than 0.8 mg/L affect the virus capsid; concentrations greater than 0.8 mg/L reportedly release
integrity. Likewise, research on bromine indicated that
lower concentrations react with viral capsid protein
(Keswick et al., 1981) while higher bromine concentrations
(greater than 15 mg/L) and bromine chloride will react with
nucleic acids (Oliveri et al.,1971). Taylor and Butler (1982) determined that iodine disrupts viral capsid
integrity. It is worth noting that in research where the
virus capsid is inactivated but the RNA remains infective,
complementation of damaged viral material may allow
infection to occur (Sharp, 1982). This process is known as multiplicity reactivation. It is suggested that increased
aggregation (possibly from low ionic strength) increases the
chance of damaged viral components being incorporated into a
host cell and reactivating. Thurman and Gerba point out the
necessity of complete viral component inactivation.
C. Hepatitis A and the U.S. Militarv
Diseases are not infrequent during war time. War is disruptive to organized society. Potable water delivery and human waste removal are two of the most important human
needs that are disrupted and two of the largest contributors
to disease transmission. Malaria, respiratory infections,
gastroenteritis, acute diarrhea and hepatitis A are among
the most common diseases to have been encountered during past military campaigns. Hepatitis A is a problem of particular importance because of the degree and length of
illness, the long recuperation period and because the
1984). American soldiers during World War II averaged •Infectious Hepatitis' convalescence periods of 6 to 8 weeks. American soldiers serving in Vietnam averaged hospital stays of 46 days. Hepatitis A cases are often reported in multiple rather than individual cases and
resources required during recuperation can be extensive and draining. Gauld (1946) illustrated the seasonal and
regional nature of HAV during World War II. As with most enteric viral diseases, occurrence was greatest during late
summer and fall.
Bancroft and Lemon's (1984) overview of hepatitis A and the military points to several important facts concerning the special risk hepatitis A poses to vulnerable military personnel. Hepatitis will usually not spread until the unit
comes in contact with the contaminated area or personnel.
Once the disease is introduced into the unit it reaches high
incidence quickly. Hepatitis control is limited under
emergency or war conditions.
Research performed by Neefe et al. (1945 and 1947)
revealed that water treated with chlorine was inadequate to inactivate HAV in cases where free chlorine was not
obtained. During the mid and late 1940's the only way to test for HAV inactivation was to use fecal filtrates from
known hepatitis cases. For this reason experimental samples contained unoxidized organic constituents. Samples that
were chlorinated sufficiently to inactivate bacterial
Coagulation, flocculation and filtration increased chlorine
effectiveness against the hepatitis virus. The most
effective means of water treatment was coagulation,
flocculation, filtration followed by "superchlorination"
(approximately 15 mg/L). Although this method was not
entirely dependable, the US Army adopted this treatment as
standard protocol until globaline was introduced (Bancroft
and Lemon, 1984).
Drinking water disinfection in undeveloped or disturbed
regions (e.g. emergency or war) is a unique problem and as a
consequence a different solution is demanded. It follows
from the discussion above that some of the problems that
exist in field water disinfection are: little choice of
and/or ability to treat water source (no pretreatment or
coagulation to remove dissolved or solid inorganic and
organic contaminants). This can lead to disinfectant demand
or disinfectant cross reactions which can reduce or
extinguish the disinfectant power. Further disinfectant
efficiency reduction may be caused by solid contaminants
which can result in increased aggregation and consequent
pathogen protection both from physical and chemical
inactivation.
Considerations of the above factors led Fair, Chang and
Morris (1945) to list 10 characteristics of an ideal field
disinfectant as cited in O'Connor and Kapoor (1970). These
characteristics deal with the importance of: disinfectant
dependability and predictability of the disinfectant and the
aesthetics of the treated water. In addition, present
technology limits the use of indicator organisms as a method for determining possible pathogen contamination of the water
source, therefore the disinfectant must be dependable in a
wide range of water quality.
D. Indicator Concept
Microbiological indicators are routinely used to
determine the presence of human fecal pollution and the possibility of pathogenic organisms presence. Geldrich
(1978) lists characteristics of an ideal indicator. The list includes: 1) the indicator should be present in the
feces when the pathogen is present but in numbers greater than the pathogen; 2) there should be a positive correlation
between fecal contamination of the water source and
indicator presence; 3) the survival and fate of the
indicator should have a known and constant relationship between it and the pathogen; 4) the disinfectant process should effect the indicator and pathogen by identical means
and at identical or predictable rates. The fundamental
precept underlying the use of indicators is that there are resource and time available to test for the surrogate. Typically, because of the circumstances surrounding
emergency field water disinfection there is a lack of time
and resources available to determine if fecal indicators are
ratio of fecal indicator bacteria at water intakes is much
smaller than in sewage effluents and therefore the
likelihood that viruses would survive disinfection after the
indicator organism is eliminated is much greater for
drinking water than for sewage effluent if the indicator is
significantly more sensitive to the disinfectant than the
virus.
E. Iodine
In part because of the research discussed above,
research to develop a portable drinking water disinfectant
was undertaken by Chang et al. at Harvard during the 1940's.
This research lead to the development of globaline, an
iodine-based disinfectant, used to disinfect canteen waters
and other small volvime field water supplies. Globaline is a
triiodide compound phosphate buffered to a slightly acidic
pH that releases approximately 8 mg/L iodine when dissolved
in water (Kapoor and O'Connor, 1970).
Iodine is the only solid halogen at room temperature.
It's melting point is at 113.5° C and boiling point is at
184.4° C. If iodine is heated slowly, iodine has sufficient
room temperature vapor pressure to sublimate but is still
much less volatile than chlorine (Kinman, Black and Thomas,
1970) . Iodine is the least soluble halogen J.n water and is
the least reactive of the halogens to organic and inorganic
constituents in an agueous solution. Iodine also has the
lowest standard oxidation potential for the halogens
Elemental iodine (I2) hydrolyzes in water to form
hypoiodous acid (HOI) and iodide ion (I~). This reaction is
described: Ij + H2O <==> HOI + H"^ + I". The equilibrium
equation describing iodine hydrolysis in water is:
iHQIl_IHLLlIl" = K}^
The equilibrium constant, Kj^, is quoted in Chang (1958) as 9
X 10"^^ at 0° C, and 3 x 10"^"^ at 25° C. The iodine
species present in water is dependent upon water pH, amount
of iodide present, organic material present, and water
temperature (Gottardi, 1983; S.D.W.C, 1980). Chang (1958)
states that for all intents and purposes, all titrable
iodine exists in the diatomic state (I2) when the initial
concentration is less than or equal to 20 mg/L and pH is
less than or equal to 7.Iodide is formed in elemental iodine hydrolysis and as
a product of the iodine reaction with organic materials.
Gottardi (1983) reports that iodide has no disinfecting
characteristics. Research by Hsu (1964) and Hsu et al.
(1966) report that iodine inactivation properties are
inhibited by iodide ion formation at low pH (below pH 6) and
high organic materials. Poliovirus and f2 phage
inactivation was inhibited under acid conditions. Hsu et
al. (1966) suggest that the inhibition was caused by reduced
tyrosine iodination. Hsu (1966) mentions the tragedy of the
failure of iodine inactivation of the poliovirus vaccine and
Hypoiodious acid disassociation constant (K^) at 25° C,
is 4.5 X lO"-'-'^. Consequently a 10~'*M iodine concentration
at 25°C should be 50 percent HOI and 50 percent 01" at
greater than 12 pH (Snoeyink and Jenkins, 1980). However
the iodite ion (I0~) formed is of little biocidal
consequence because it is unstable and decomposes to iodide
(I") and iodate (103"). Gottardi (1981) reports that iodate
is formed extremely quickly in high pH waters (over pH 9).
He reports that at pH 9.5 , 0.03 M iodine is 3 0% transformed
into iodate in approximately one (1) minute. Iodate
formation is dependent upon iodide concentration. Iodine at
water disinfection concentrations (10~-^M) and pH greater
that 7, will form 100 percent iodate in less than one
minute. Gottardi (1983) and Chang (1958) report that iodate
does not have biocidal characteristics.
Disinfection experiments are typically one of two
types: halogen demand free or dynamic (reactive)
disinfection experiments. Halogen demand free disinfection
experiments are run under conditions where no side reactions
interfere with the pathogen inactivation process. In order
to prevent interferences, the halogen is introduced into a
demand free environment at the concentration desired and
then the pathogen is introduced into the aqueous solution.
In this way, any residual demand will have already reacted
and the halogen will only react with the microorganism.
Dynamic disinfection experiments are performed with the
halogen is introduced. In this way the disinfectant will
interact with the pathogen and any other constituents
present. Dynamic disinfection more closely models the real
world.
Iodine use as a water disinfectant was recorded as
early as 1915 (Pond and Willard, 1937). An early attempt at disinfection quantification was reported in 1937 (Pond and Willard). They reported that 2 drops of 7 percent iodine
tincture per liter of "stream, brook or river" water at 17°
C for 15 minutes contact was sufficient to inactivate
between 4 logs anti 6 logs of E. coli and Eb. typhosa, except in river water contaminated with organic matter. The river
water with organic contaminants showed a three log (99.9%)
reduction.
Chang and Morris (1953) reported on iodine disinfection
experiments performed over a wide range of water pH,
temperature and organic color on various pathogenic bacteria. Entamoeba histolytica and poliovirus.
Inactivation experiments were performed on E. coli, Sal. typhosa, Sh. dysenterae, Sal. schottmueller and V. cholorea. They used iodine concentrations of 7 to 8 p.p.m. at over 30
minutes of contact. The bacteria were inactivated
effectively (greater than 5 log reduction) over a wide pH range (4.5 to 10) and inorganic, organic and nitrogenous contaminants usually after 10 minutes. Reduced biocidal
activity was noted in low water temperature (2-3° C), high
amounts (165 to 245 p.p.m.) of loess or fine organic sands.
Chang and Morris suggested increasing iodine concentrations
to 14 to 16 p.p.m. and contact to 20 or more minutes to
allow for demand and reduced activity. Iodine inactivation
data for E. hitolytica cysts revealed that in clean, warm water with a pH less than 7.7, 3 0 cysts would be inactivated
in 10 minutes. As with their bacteria experiments,
increased dosage and contact time was necessary for waters
of low temperature and greater than 4 p.p.m. demand.
Poliovirus inactivation experiments were inconclusive
because of virus quantification limitations of that time.
However, they reported data suggesting that iodine at pH 9
had virucidal characteristics, but also that iodine inactivation was limited by demand from color.
Later experiments by Chang (1958) on coxsackie virus under wider pH ranges, indicated that hypoiodous acid was
less cysticidal than elemental iodine but more virucidal.
From this and previous research, Chang suggests that
globaline tablets be buffered between pH 6 and 7 in order to give a wide margin of safety for iodine•s cysticidal
activity and to minimize HOI instability and degradation.
He also suggests that the concentration be kept under 10
p.p.m. in order to maximize water palatability.
Berg et al. (1964) and Hsu (1964) reported research on
the mechanism of iodine inactivation of viruses. Berg,