Self-Reported Delays in Care Do not Predict Increased Mortality in a Cohort of Commnnity-Dwelling Elders.
By
Randall W. Rupper, MD
A Master's Paper submitted to the faculty of The University of North Carolina at Chapel Hill
In partial fulfillment of the requirements for The degree of Master of Public Health in
The Public Health Leadership Program.
Chapel Hill 2003
=
Abstract
Background: Self-reporting of delayed care is a common measure of access to healthcare. The relationship of such reports to worsened health outcomes is often assumed, but few studies have tested this longitudinal connection.
Objective: To determine whether self-reports of delayed care predict increased mortality among community-dwelling elderly.
Design: 3-year longitudinal retrospective cohort study. Setting: A five county area of North Carolina.
Participants: 4,162 randomly sampled individuals age 65 and older.
Measurements: The outcome was the proportional hazard ratio (HR) for death stratified by the factor of interest, baseline self-reports of delayed or foregone care. Control variables included predisposing, enabling, and need factors influencing care seeking and/or mortality.
Results: Of 3,964 eligible participants reporting, 61% never, 27% once in awhile, and 12% quite often delayed care. 13% of participants died during the study period. Older age, male gender, lower income, less education, lack of
significantly associated with more self-reported delays in care. In both an
unadjusted and fully adjusted survival model, 3-year mortality rates did not differ among cohorts reporting varying degrees of delayed care.
Background
Differential access to health care persists as a national concern for the public, lawmakers, and health care professionals1-4. Quantifying and tracking access
over time requires a measurable definition of access. Given the complexity of health care access, its measurement is methodologically challenging5.
Appreciating this difficulty, the Institute of Medicine (IOM) recommended the development of measures of health care access that can be easily understood and widely applied. In a major report on this subject, the IOM defined access to medical care as "the timely use of personal health services to achieve the best possible health outcomes3." Conceptually, this definition suggests that barriers to
access cause delays in seeking appropriate medical attention, and that these delays lead to worse health outcomes. The definition also implies that establishing the validity of measures of access requires longitudinal studl.
One common measure of access involves asking survey participants directly to report whether they have delayed necessary medical care. This question is contained in some form in nearly every major survey about access7• While this
direct questioning has face validity, few studies have explored the association between self-reported delays in care and undesirable health outcomes. Results of these studies have varied by setting. Delays in care as assessed at the time of hospitalization increase the length of hospital stays8• However, a community
burden, delays in care among the elderly may be especially problematic10• Elderly non-users of health care services have been shown to have higher mortality as compared to low-volume elderly health care users11• However, we are unaware of any previous longitudinal study that tests the association between self-reports of delayed or foregone care and mortality rates among the elderly. To answer this question, we used data collected prospectively from a cohort of community-dwelling elders. We hypothesized that reports of delay by these participants would be associated with an increased rate of mortality in the subsequent 3-year period.
Methods
Study population.
This study uses data from The Established Populations for Epidemiologic Studies of the Elderly (EPESE), a multi-site project initiated in the 1980s by the National Institute on Aging12.14• We used the North Carolina sample, which included
participants from five contiguous counties in the northern portion of the state, and which intentionally over-sampled African-Americans. The initial sample
listed their race as neither black nor white, due to lack of power for independent analysis.
Variables
In conceptualizing the potential role of independent variables, we followed the Anderson and Aday model of access, in which variables are categorized as being predisposing, enabling, or describing need for care15• 16. Variables were chosen
because of their known relationship with mortality rate and/or their previous utility in examining access, particularly in the elderly.
Factor of interest
Our factor of interest, self-reported delayed or foregone care, was defined in three categories based on the response to a single survey question, "How often do you put off or neglect going to the doctor when you feel that you really should go--never, once in awhile, or quite often?"
Outcome
Predisposing variables
Demographic information obtained at the time of the baseline interview included age, gender, race, marital status, and education (dichotomized at the median between the eighth and ninth grade).
Enabling variables
Annual income divided at $10,000 dollars, the presence or absence of supplemental insurance to Medicare, a reported usual site of health care (excluding emergency or urgent care clinics), and urban versus rural county residence were included as dichotomous variables. Social support was defined as having family or friends that the respondents could "count on in times of trouble" and with whom they could discuss their "deepest problems" as described in previous EPESE studies17• Satisfaction with care was included as a dichotomous variable "very satisfied"/"satisfied" versus "very dissatisfied"/"dissatisfied."
Need-for-care variables
Self-reported health was included as a categorical variable consisting of poor, fair, and a combined good and excellent category. An internally validated chronic disease index, developed by the EPESE study team, has been reported on previousli8• 19• This index creates a three level variable of chronic disease
Diabetes, Stroke, and Cancer. A depression score was calculated using a
modified version of the Center for Epidemiologic Studies-Depression scale (CES-D)17, and was included as a continuous variable. Current smoking was included
as a dichotomous variable.
Analysis
The descriptive analysis and initial model development were performed using Stata v7.0 software (Stata Corporation, College Station, TX). However, given the complex sampling strategy, SUDAAN v8.0 software (Research Triangle Institute International, Research Triangle, NC) was used to incorporate sample weights in
t
all Cox regression models.
I
Following a descriptive analysis of all of the variables, Cox proportional hazard models were fit to assess the mortality rate over a 3 year period due to self-reported delays, as well as to other risk factors. We then explored the potential for confounding by the predisposing, enabling, or need-for-care variables by examining the relationships between them and self-reports of delay using chi-square tests for categorical variables, and analysis of variance for continuous variables.
proportional hazards assumption was tested for all variables, both individually and as a group, that were included in the full modeL In addition, we examined interaction terms between delay and the other independent variables in the full modeL Likelihood ratio tests were used to assess the significance of the interaction terms. Variables were eliminated from the full model if their
elimination had only minimal effect on the hazard ratio associated with the delay variable and mortality rate. Adjusted Kaplan-Meier curves were plotted to assess the persistence of any noted associations over time.
The Committee on the Protection of the Rights of Human Subjects at the
t
i
University of North Carolina School of Medicine exempted this study from review because none ofthe individual patticipants were identifiable in the available data.
Results
Of the 4,162 participants in the baseline survey, 3,964 were eligible for analysis. The mean age of the participants was 73.3 years, and they were predominantly female (Table 1). The sampling strategy yielded relatively equal numbers of blacks and whites, as well as urban and rural participants. Notably, the average education level for participants was only eighth grade.
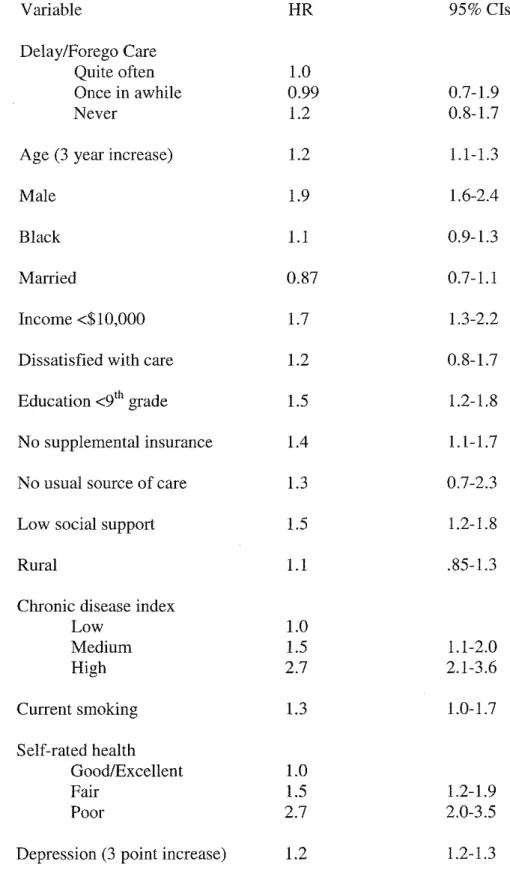
lower income, less education, lack of insurance (supplemental to Medicare), smoking and worse self-rated health were significantly associated with increased mortality. Higher scores on the depression scale, less reported social support, and more severe chronic disease were also significantly associated with increased mortality. Race was not associated with increased mortality, consistent with past findings demonstrating a "mortality cross-over" between blacks and whites that occurs at advanced age20
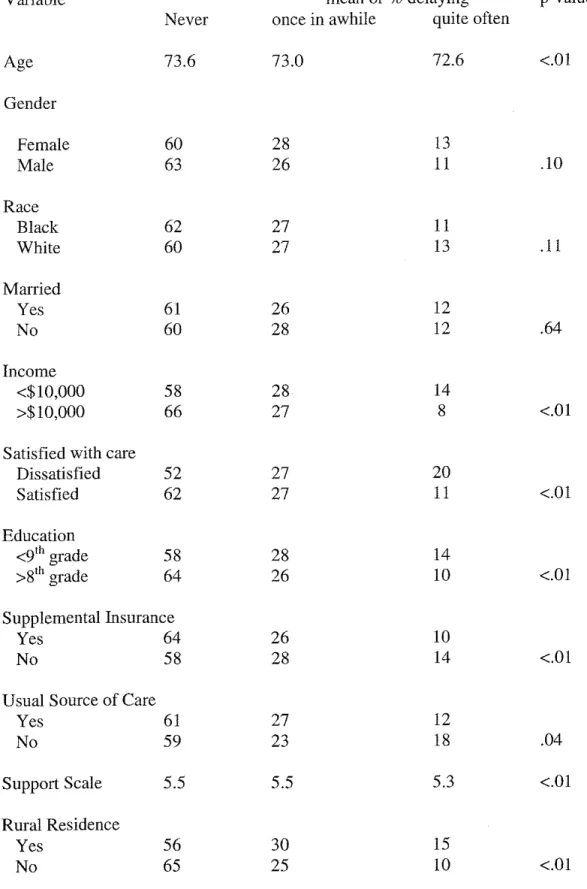
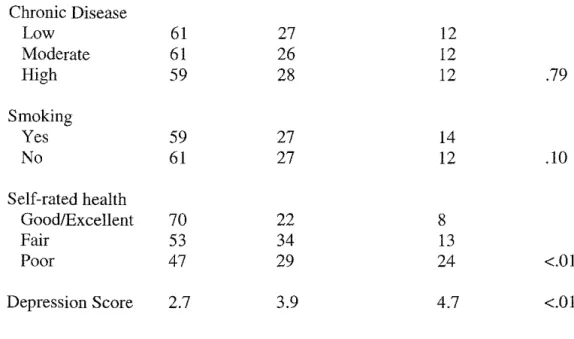
Younger age, lower income, less education, no supplemental insurance, less support, and higher depression scores were associated with reports of more delay (Table 3). A particularly strong association exists between self-rated health and self-reports of delay. Three times as many participants rating their health as poor report delaying care quite often as compared to those participants who rate their health as good or excellent. Among variables not associated with mortality, dissatisfaction with medical care, rural residence, and lack of a usual site of care were significantly associated with self-reported delays. The chronic disease index, gender, and smoking (all of which were related to mortality) had no significant relationship with reports of delay.
Based on our conceptual model and our preliminary analysis, we developed a Cox proportional hazards model adjusting for age, gender, education, lack of
not report their annual income, and because prior modeling in the subset of participants with income data demonstrated minimal effect of income on the HRs for mortality associated with reports of delay, income was not included in this full model. All models used the cohort reporting quite often delaying care as the referent group (Table 4). In the full model, the HR for the cohort reporting never delaying care was 1.4 (CI 0.95-2.1), while the HR for the cohort reporting once in a while delaying was 1.1 (CI 0.7-1.7). The full model can be reduced to a slightly more precise model adjusting only for the key confounder, self-rated health. In this reduced model the HR for the cohort reporting never delaying care was 1.5 (CI 1.0-2.2), with a HR of 1.2 (CI 0.8-1.7) for those once in a while delaying care.
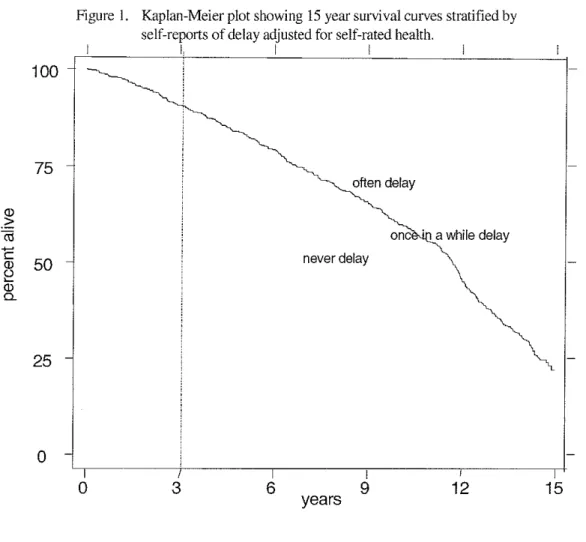
Using the National Death Index, we extended the mortality information for the cohorts through 200 I. By then, over 80% of the population was deceased. Given the long-time frame and high mortality rate, violation of the assumption of proportional hazards precludes Cox modeling over the entire period. Nevertheless, a Kaplan-Meier plot (Figure 1) graphically illustrates the persistence of the 3-year trends over time.
Discussion
Barriers that limit an individual's access to medical care are often believed to cause adverse health outcomes because they delay the timely receipt of
the connection between self-reported delays in care, and higher mortality rates has not been established. In a well-done study of community dwelling adults age 25 to 64, no association was found between mortality rates and self-reported
foregone care9. In this study, we examine the relationship between mortality and
self-reported delayed or foregone care in a population of community-dwelling participants age 65 and over. In this population, the lack of an unadjusted or fully-adjusted mortality association is punctuated by the surprising finding that in a reduced model adjusting for self-rated health, those participants who report never delaying or foregoing care die at a slightly, but significantly higher rate over the next three years when compared with those participants who report quite often delaying or foregoing care.
The reasons that self-reported delays in care fail to predict subsequent mortality are not obvious. One explanation may involve the respondent's interpretation of the question about access. Specifically, the single question about delaying care, implicitly requires a survey participant to answer at least two questions: 1) "Did you need care?'' 2) "Did you get care?'' Only an affirmative answer to the first question can lead to the conclusion that care was needed but not obtained. This disadvantaged elderly population may have found the assessment of medical need difficult. Ultimately, participants may have had better outcomes if they
Alternatively, the perception of need may not be equivalent to a physiologic presence of need. We note that while both self-rated health and the chronic disease index strongly predict mortality, self-rated health has an important association with self-reports of delay while the chronic disease index does not. These data may be a reflection of the lack of symptoms associated with many predictors of increased mortality in the elderly, such as hypertension or occult gastrointestinal bleeding.
Finally, we point out that resource use in our health care system continues to have a heavy concentration at the end of life21. This heightened care may lead the
sickest elders to answer that all of their medical needs are being met, but have questionable impact on their mortality. Although our study occurred in a community setting and attempted to adjust for health status, we cannot exclude this possibility.
This study does not measure any intermediate adverse outcomes that might be significantly associated with self-reported delays in care over the study period. These intermediate adverse outcomes could potentially provide early indicators of decline that would cause mortality differences to emerge over time. However, the Kaplan-Meier plot extends the mortality data for these cohorts for an additional 12 years beyond the initial study period. It does not suggest that additional time improves the capacity of self-reports of delayed care to predict mortality.
The percentage of people who respond that they lack access to care in cross-sectional studies is sensitive to survey methodology and question placement and phrasing5. The question about delayed or foregone care used in our study allowed
for three levels of response, and did not confine participants to a specific time frame. In addition to the geographic and demographic issues noted above, the lack of a uniform methodology in measuring access, including measuring delays in care, limits our ability to extrapolate findings from this study to other cross-sectional studies that measure delays in care in different ways.
financial burdens when they choose to seek care22, this study demonstrates the necessity of further studies that examine how people determine what their medical needs are and whether those needs are being met, and whether educational or other interventions can improve the ability of individuals to correctly perceive and act on their medical needs.
However, in conjunction with the work of others, this study calls into question the use of self-reports of delayed care or foregone care as a surrogate for measuring actual delays in care that lead to adverse health outcomes. These results
Acknowledgment
I would like to thank the following faculty members at UNC-Chapel Hill and Duke University who served as mentors and collaborators for this project: T. Robert Konrad, PhD; Joanne M. Garrett, PhD; William Miller, MD, PhD, MPH; Dan G. Blazer, MD, PhD. In addition, I thank Carol Q. Porter and Bruce M. Burchette for their advice and assistance in data management.
Grant Support
Table 1. Characteristics of the Study Population. (n=3,964) Variable Age (years) Female Black Currently married Income <$10,000 Dissatisfied with care Education (years)
No supplemental insurance No usual source of care Support scalet
Rural county
Chronic disease index Low
Moderate High Current smoking Depression score~
Self-rated health Excellent/Good Fair
Poor
Delay or Forego Care Quite often Once in awhile Never
Mean (s.d) or % Reporting 73.3 (6.5)
65
54 41
71
9
8.6 (4.1)
46 5
5.5 (.92)
44 46 29
25
17 3.2 (3.4) 53 33 14 12 27 61t
Support Scale ranges from 2 to 6 with higher numbers indicating more supportTable 2. Unadjusted Cox proportional hazard ratios for 3-year mortality rates. Variable
Delay/Forego Care Quite often Once in awhile Never
Age (3 year increase) Male
Black Married
Income <$10,000 Dissatisfied with care Education <91h grade
No supplemental insurance No usual source of care Low social support Rural
Chronic disease index Low Medium High Current smoking Self-rated health Good/Excellent Fair Poor
Depression (3 point increase)
HR 95% Cis
1.0
0.99 0.7-1.9
1.2 0.8-1.7
1.2 1.1-1.3
1.9 1.6-2.4
1.1 0.9-1.3
0.87 0.7-1.1
1.7 1.3-2.2
1.2 0.8-1.7
1.5 1.2-1.8
1.4 1.1-1.7
1.3 0.7-2.3
1.5 1.2-1.8
1.1 .85-1.3
1.0
1.5 1.1-2.0
2.7 2.1-3.6
1.3 1.0-1.7
1.0
1.5 1.2-1.9
2.7 2.0-3.5
Table 3. Association of self-reported delays in care with other factors.
Variable mean or % delaying p-value
Never once in awhile quite often
Age 73.6 73.0 72.6 <.01
Gender
Female 60 28 13
Male 63 26 II .10
Race
Black 62 27 II
White 60 27 13 .II
Married
Yes 61 26 12
No 60 28 12 .64
Income
<$10,000 58 28 14
>$10,000 66 27 8 <.01
Satisfied with care
Dissatisfied 52 27 20
Satisfied 62 27 11 <.01
Education
<9'h grade 58 28 14
>8'h grade 64 26 10 <.01
Supplemental Insurance
Yes 64 26 10
No 58 28 14 <.01
Usual Source of Care
Yes 61 27 12
No 59 23 18 .04
Support Scale 5.5 5.5 5.3 <.01
Rural Residence
Yes 56 30 15
Table 3 (cont.). Association of self-reported delays in care with other factors.
Chronic Disease
Low 61 27 12
Moderate 61 26 12
High 59 28 12 .79
Smoking
Yes 59 27 14
No 61 27 12 .10
Self-rated health
Good/Excellent 70 22 8
Fair 53 34 13
Poor 47 29 24 <.01
Table 4. Cox proportional hazard ratios with 95% Confidence Intervals stratified by self-reports of delayed or foregone care. The group that reports delaying quite often was used as the referent.
Model Never delay Once in awhile
Unadjusted 1.2 0.99
(0.8-1.7) (0.7 -1.5)
Adjusted for all potential 1.4 1.1
confounderst (0.95-2.1) (0.7-1.7)
Adjusted for self-rated 1.5 1.2
health only (1.0-2.2) (0.8-1.7)
100
75
50
25
0
Figure I. Kaplan-Meier plot showing 15 year survival curves stratified by self-reports of delay adjusted for self-rated health.
0
I, I I
often delay
3 6
never delay
years
I
9
one · a while delay
References
1. BrownE, Wyn R, Teleki S. Disparities in Health Insurance and Access to Care for Residents Across US Cities: The Commonwealth Fund and
UCLA Center for Health Policy Research; August 2000.
2. Fiscella K, Franks P, Doescher M, Saver B. Disparities in Health Care by Race, Ethnicity, and Language Among the Insured: Findings from a National Sample. Medical Care. 2002;40(1):52-59.
3. Millman M, ed. Access to Health Care in America. Washington, DC:
National Academy Press; 1993.
4. IOM, ed. Coverage Matters: Insurance and Health Care. Washington,
D.C.: National Academy Press; 2001.
5. Berk M, Schur C. Measuring Access to Care: Improving Information for Policymakers. Health Affairs. 1998;17(1):180-186.
6. Lurie N. Studying Access to Care in Managed Care Environments. Health Services Research. 1997;32:691-701.
7. Eden J. Part II: The Measurement of Access- Where Are We Now? HSR: Health Services Research. August 1998;33(3):685-707.
8. Weissman J, Stern R, Fielding S, Epstein A. Delayed Access to Health Care: Risk Factors, Reasons, and Consequences. Annals of Internal Medicine. 1991;114:325-331.
9. Franks P, Gold M, Clancy C. Use of Care and Subsequent Mortality: The Importance of Gender. HSR: Health Services Research. August
1996;31(3):347-363.
10. Branch L, Nemeth K. When Elders Fail to Visit Physicians. Medical Care.
1985;23(11):1265-1275.
11. Shapiro E, Roos N. Elderly Nonusers of Health Care Services. Medical Care. March 1985;23(3):247-257.
12. Cornoni-Huntley J, Blazer D, Lafferty M, Everett D, Brock DB, Farmer
M. Established Populations for Epidemiologic Studies of the Elderly:
Resource Data Book. Vol 2. Bethesda, MD: National Institute on Aging;
1990.
13. Cornoni-Huntley J, Brock DB, Ostfeld AM, Taylor JO, Wallace RB.
Established Populations for Epidemiologic Studies of the Elderly: Resource Data Book. Bethesda, MD: National Institute on Aging; 1986.
14. Blazer D, Burchett B, Service C, George L. The association of age and depression among the elderly: An epidemiologic exploration. Journal of Gerontology: Medical Sciences. 1991;46:M210- 215.
15. Anderson R. Revisiting the Behavioral Model and Access to Medical Care: Does It Matter? Journal of Health and Social Behavior. March
1995;36:1-10.
16. Aday L, Anderson R. The National Profile of Access to Medical Care: Where Do We Stand? American Journal of Public Health. December
1984;74(12): 1331-1339.
17. Hybels C, Pieper C, Blazer D. Sex Differences in the Relationship
of Older Adults. American Journal of Geriatric Psychiatry. May-June 2002; 10(3):283-291.
18. Fillenbaum G, Hanlon JT, Corder EH, Ziqubu-Page T, Wall WE, Brock D. Prescription and nonprescription drug use among black and white community-residing elderly. American Journal of Public Health.
1993;83: 1577-1582.
19.
20.
21.
22.
Bernard S. Racial Differences in Perceptions of Access to Health Care
Among the Elderly. New York/London: Garland Publishing, Inc; 1997.
Corti M, Guralnik J, Ferrucci L, et al. Evidence for a Black-White
Crossover in All-Cause and Coronary Heart Disease Mortality in an Older Population: The North Carolina Epese. American Journal of Public
Health. March 1999;89(3):308-315.
EmanuelE, Ashe A, Yu W, et al. Managed Care, Hospice Use, Site of Death, and Medical Expenditures in the Last Year of Life. Archives of
Internal Medicine. 2002; 162:1722-1728.