Original Article
A Comparative study on growth pattern of Low Birth Weight
and Normal Birth Weight neonates
Z. Abdeyazdan*, S. Ehsanpoor**, Z. Javanmardi***
Abstract
INTRODUCTION: Low birth weight (LBW, birth weight<2500g) is a significant health problem in children all around the
world. There is a direct relationship between low birth weight and infant mortality rate. One of the most important measures to prevent childhood morbidity is growth monitoring. The present study was planned to compare the growth rate of LBW neonates with those weighing 2500g and more at birth (normal birth weight (NBW)) during the first two years of life.
METHODS: This was a retrospective cohort study, which included 218 two years old infants (109 LBW, 109 NBW).
Data gathering tool was a questionnaire. Data were analyzed by descriptive analytic statistical methods (the t- test and the χ2 test).
RESULTS: Our findings revealed that there was a significant difference between the mean values of child weight, height
and head circumference from birth until 2 years of age between the two groups (the LBW group had lower values than the NBW group). Height by age, weight by age and weight by height indices also had significant difference between the two groups until 2 years of age. Growth curves in LBW group were upslope until 2 years old. Moreover, the weight percentile of the LBW children at 2 years of age was deeper than the NBW group.
DISCUSSION: In the present study, comparison of growth parameters until 2 chart years of age and growth of both
groups showed a better growth velocity in the LBW group. The LBW growth curve moved upslope and was more com-patible with standard percentiles throughout the growth curve. However, growth of the NBW group was not fine and more investigation is needed in this field.
KEY WORDS: Growth, low birth weight, normal birth weight, neonate
IJNMR 2007; 12(3): 106-110
ne of the most serious problems of child health in the entire world is Low birth weight (LBW) (1). According to
WHO studies, about 25 millions LBW neonates are born each year. It means that from each six neonates one is born with LBW (2) and 90% of
them belong to developing countries (3).
The birth weight is a highly important and useful factor in determining life expectancy of
children as well as their future health status. LBW can result in illnesses and health prob-lems and sometimes causes early death of child (2).LBW (as a result of preterm delivery
and/or intra uterine growth recardation) is a major determinant of both neonatal and infant mortality rates and childhood morbidity (4)
af-fects not only child’s health status, but also his/her family member’s mental health, as
* MD, Associate Professor, Department of Pediatric Nursing, School of Nursing & Midwifery, Isfahan University of Medical Sciences, Isfahan, Iran.
** MSc, Department of Midwifery, School of Nursing & Midwifery, Isfahan University of Medical Sciences, Isfahan, Iran. *** MSc, School of Nursing & Midwifery, Isfahan University of Medical Sciences, Isfahan, Iran.
Correspondence to: Zahra Abdeyazdan MD E-mail: [email protected]
Research Article of Vice Chancellor of Isfahan University of Medical Sciences, No: 79162.
parents are deeply concerned about long term complications such as growth and developmental delay and other general health issues of their children (5).
Fortunately, from many years ago, medical policy makers have paid more attention on health services than medical managements and they have done important activities in the field of child health like monitoring children growth patterns (3).
By definition of W.H.O, child physical growth is a good determinant for public health status (6).
Child physical growth is a determinant for public health status in WHO documents (8) and
medical policy makers consistently considered monitoring child growth patterns to prevent health problems (3).
Many studies have been carried out on growth and development patterns of LBW neonates worldwide, one of which, carried out in China in 1996. In this study, 132 LBW neo-nates were followed from birth until 3 years of age regarding their growth determinants. The results showed that values of growth parame-ters in LBW neonates were less than those in NBW group during that period (7).
In Iran, prevalence of LBW neonates is about 10%, but no studies have been carried out on these neonates growth so far (11). This
study compared the growth patterns of LBW neonates with NBW ones in Iran.
The objectives were:
1) Determining and comparing demographic characteristics of two groups of LBW and NBW neonates and their parents.
2) Determining and comparing mean values of weight, height, head circumference, weight by age, height by age and weight by height at 2nd, 4th, 8th, 12th, 18th and 24th months of age in the two groups.
3) Determining and comparing weight per-centile curves at the age of two years in the two groups.
Methods
This is a cross-sectional descriptive analytic, longitudinal retrospective study. The major variables were weight, height and head
cir-cumference increases, weight by age, height by age, and weight by height and their corre-sponding percentiles. Other variables were gender, gestational age, child’s rank among siblings, values of weight, height, and head circumference at the time of birth, birth spac-ing with previous child, family population, duration of breast feeding, type of milk (if not breast fed), the age of beginning supplemental food beginning age, job and educational level of parents, maternal age, mother’s parity status, mother’s weight at the last visit during pregnancy period and at the first visit after de-livery, type of delivery.
Samples were 218 children (109 LBW and 109 NBW) who were randomly chosen from health care centers in Isfahan and who all met the include criteria.
Include criteria were: birth weight < 2499g in LBW group and 2500 - 4000g for NBW group, single birth, regular and frequent visits to health care centers at 2nd, 4th, 8th, 12th, 18th, and 24th months of age, existence of nec-essary information in the family health file. Exclude criteria were: child’s apparent con-genital abnormality, history of severe diarrhea and\or acute respiratory infection recorded in the child’s health file, child’s history of hospi-talization, non- Iranian nationality and adopted child.
All necessary data were extracted from chil-dren’s health files and were then recorded in special forms.
Data were analyzed via using descriptive analytic statistical methods (t-test and chi-square test) by SPSS.
P values of less than 0.05 were considered as significant.
Results
Findings revealed that in the LBW group, birth weight value was mostly at the ranges of 2001-2499g (75.2%) and 1501-2000g (20.2%). Only 4.6% of them were VLBW. The mean values of birth weight, length, and head circumference were 2173g, 46.14cm and 32.33cm retrospec-tively. 86.2% of neonates were full term and 62.4% of them female.
In the NBW group the most frequency for birth weight was in the range of 3001-3500g, the means value of birth weight, length, and head circumference were 3176.35g, 49.65cm and 34.85cm retrospectively. 99% of neonates were full term and 41.2% were female.
Regarding child’s rank among sibling, the most frequency in the two groups was the first with the mean value of 1.69 in the LBW group and 1.84 in the NBW group.
In both groups, birth spacing was mostly more than 24 months, most babies were breast fed (57.8% LBW and 55.8% NBW), supplemen-tal food beginning time was mostly at the range of 4-6 months of age (LBW 79.8%, NBW 90.8%).
There were not statistical significant differ-ences between the two groups for birth spac-ing, type of milk, (chi- square test), and child’s rank among siblings (t test).
There were significant differences between the two groups for gestational age (χ2 p=0.0002), duration of breast feeding (t test p=0.03), and the age of starting supplemental food (t test p=0.02).
In the LBW group, the mean age of mothers at the neonates' birth time was 24.75 years old. The mean of maternal parity was 2.06, the mean value of mother’s weight in the last visit during pregnancy was 67.72kg, and family population had the mean value of 3.73. In the NBW group these values were 24.83, 1.95, 69.95kg and 3.84 retrospectively.
There were significant statistical differences between the two groups in father's educational status (χ2 p=0.02), and mother’s weight in the last visit during pregnancy (t test p=0.04). However, there were no significant differences between the two groups for other variables namely family population, educational level of mother, parents’ job, maternal age, maternal parity, mother’s weight in the first visit after delivery and type of delivery.
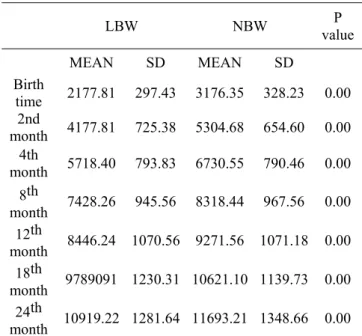
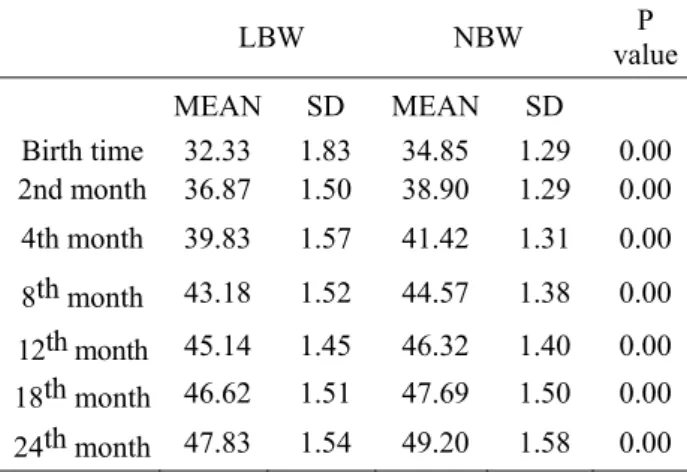
Comparing the mean values of birth weight, height, head circumference (p=0.00), the mean values of weight, height, and head circumfer-ence at 2nd, 4th, 8th, 12th, 18th and 24th months of age showed significant statistical
differences between the two groups (p=0.000) (table 1-3).
Comparing the differences in mean values of weight, length, and head circumference at birth and at two years old showed that during the first two years of age, the LBW neonates compensated approximately 20% of their weight, 50% of their length, and 40% of their head circumference (table 1-3).
Comparing weight by age, height by age, and weight by height indices revealed signifi-cant statistical differences between the two groups from birth to 2 years of age and their mean values were lower in the LBW group than the NBW group.
Weight percentiles of the two groups were statistically different at 2 years of age (p=0.02). Since there were significant differences regard-ing variables such as gestational age, duration of breast feeding and the age of beginning sup-plemental food between the two groups. Since these factors could affect on post natal growth, another statistical analysis was done to delete them. This analysis showed that the mean val-ues of differences in weight, height and head circumference between the two groups were significant, too.
Table 1. the mean value of weight in the two groups
LBW NBW value P
MEAN SD MEAN SD Birth
time 2177.81 297.43 3176.35 328.23 0.00 2nd
month 4177.81 725.38 5304.68 654.60 0.00 4th
month 5718.40 793.83 6730.55 790.46 0.00 8th
month 7428.26 945.56 8318.44 967.56 0.00 12th
month 8446.24 1070.56 9271.56 1071.18 0.00 18th
month 9789091 1230.31 10621.10 1139.73 0.00 24th
Table 2. the mean value of length in the two groups
LBW NBW P value
MEAN SD MEAN SD
Birth time 46.14 2.83 49.65 1.92 0.00 2nd month 53.25 2.87 57.11 2.50 0.00 4th month 58.80 2.94 62.38 2.54 0.00 8th month 66.42 2.86 68.96 2.63 0.00 12th month 72.02 2.87 74.2 2.96 0.00 18th month 78.32 3.7 80.30 2.8 0.00 24th month 83.89 3.98 85.60 3.17 0.00
Table 3. the mean of head circumference in the two groups
LBW NBW valueP
MEAN SD MEAN SD
Birth time
32.33 1.83 34.85 1.29 0.00 2nd month
36.87 1.50 38.90 1.29 0.00 4th month
39.83 1.57 41.42 1.31 0.00 8th month 1.5243.18 44.57 1.38 0.00 12th month 1.4545.14 46.32 1.40 0.00 18th month 1.5146.62 47.69 1.50 0.00 24th month 1.5447.83 49.20 1.58 0.00
Discussion
Attention to children’s growth and develop-ment is an important factor in preventing childhood mortality and it is also an important factor in preventing further psychological and somatic diseases (8). This study showed that
there are significant statistical differences be-tween LBW and NBW neonates in values of weight, height, and head circumference during the first two years of age, as the means of these values were lower in the LBW group than the NBW group, Atkinson (9), Ford et al. (10),
Finn-strom et al. (11), and Arifeen et al. (12) had also
reached similar results.
In the LBW group, the means of weight was about 2.5 times of the birth time in the 4th month of age, 4 times in one year old and ap-proximately 5 times in 2 years old; whereas in the NBW group these values were 2, 3 and 3.5 times retrospectively.
The reason for the fine weight gain in the LBW group may be that 95.4% of them were
moderately low birth weight (MLBW). In addi-tion, the emotional status of parents, who probably provide special care for LBW neo-nates compared to NBW, may be responsible for that (5).
In the LBW group, the length had been in-creased 26cm during the first year and 11.9cm during the second year but in the NBW group 24.5cm during the first and 11.4cm during the second year of age. The expected length-increasing rate is about 25.5cm during the first year and 12.7cm during the second year (13). By
1st year of age, length has increased by almost
so (14) the LBW group had better length growth
pattern than the NBW group. In the LBW group head circumference had been increased approximately 13cm during the first and 2.7cm during the second year of life and in the NBW group 11.5 during the first and 2.7cm during the second year of life. Comparing these values with the expected mean value increase of 10cm for the first year and 2.5 cm for the second year (15), we can say, this growth parameter in
the LBW group is better than the NBW group during the first year of life. Since head circum-ference is a determinant for brain size, it is necessary to do further studies on develop-mental aspects in the LBW neonates.
Comparing indices of weight by age, height by age, and weight by height until 2 years of age and also weight percentile at 2 years of age showed that the LBW group had lower values than the NBW group. Although majority of children in both groups were weighted be-tween 3 and 50 percentiles, the absolute num-ber of Children who were under 3 percentile in the LBW group (7 child) was more than those in the NBW group (1 child). Hirta (16), Ferrari
et al. (17), Orozco et al. (18), Sandler and Cooper (19)
in their studies had the same results.
In the present study comparison between growth parameters until 2 years of age and growth chart of the two groups showed a bet-ter growth velocity in the LBW group, their growth curve moved upslope and was more compatible to standard growth curve percen-tiles throughout the period. However, the growth of NBW group was not fine and more investigation is needed in this field.
References
1. Karshenas N. Most of neonatal mortality is preventable. Behdasht e jahan 1979; 13(2):49.
2. Hasan M. Correlation between mother's weight in pregnancy period with fetal growth and his post natal health. Behdasht-e jahan 1978; 12(3):18.
3. Bahrami M. General review on neonatal problems. Iranian Pediatric Disease 1993; 5(4):276.
4. Behrman R E, Kliegman R M, Jenson H B. Nelson Textbook of pediatrics. 16th ed. W.B. Saunders c; 2004. P. 520. 5. Fox J . Primary health care of children. St.Louis: Mosby; 1997. P. 141-2.
6. Pasdar Khoshknab Y. Growth pattern of school age children in Kermanshah Behbood (Journal of Nursing and Mid-wifery School of Kermanshah) 1996; 2(1):9.
7. Li HR, Feng LY, Zheng MS. [A longitudinal study of growth and development of low birth weight infants]. Zhonghua Hu Li Za Zhi 1996; 31(2):63-67.
8. Mehryar AH, Zanjani H, Shadpour K, Mirzaei M. Population, Development and Reproductive Health. 1st ed. Tehran: Nashr and Tablighe Boshra; 1991. P. 151.
9. Atkinson SA, Randall-Simpson J. Factors influencing body composition of premature infants at term-adjusted age. Ann N Y Acad Sci 2000; 904:393-399.
10. Ford GW, Doyle LW, Davis NM, Callanan C. Very low birth weight and growth into adolescence. Arch Pediatr Adolesc Med 2000; 154(8):778-784.
11. Finnstrom O, Otterblad OP, Sedin G, Serenius F, Svenningsen N, Thiringer K et al. Neurosensory outcome and growth at three years in extremely low birthweight infants: follow-up results from the Swedish national prospective study. Acta Paediatr 1998; 87(10):1055-1060.
12. Arifeen SE, Black RE, Caulfield LE, Antelman G, Baqui AH, Nahar Q et al. Infant growth patterns in the slums of Dhaka in relation to birth weight, intrauterine growth retardation, and prematurity. Am J Clin Nutr 2000;
72(4):1010-1017.
13. Novak JC, Broom BL. Ingalls and Salerno’s maternal and child health nursing. 9th ed. Mosby; 1999. P. 480. 14. Hockenberry MJ, Wilson D, Jackson C. Wong’s nursing care of infants and children. 8th ed. Mosby; 2006. P. 500.
By 1st year of age, length has increased by almost Soy.
15. Opperman CS, Cassandra KA. Contemporary Pediatric Nursing, Study Guide. 1st ed. C.V. Mosby; 1998. P. 56. 16. Hirata T, Bosque E. When they grow up: the growth of extremely low birth weight (< or = 1000 gm) infants at
ado-lescence. J Pediatr 1998; 132(6):1033-1035.
17. Ferrari AA, Solymos GM, Castillo RM, Sigulem DM. Risk factors for protein-energy malnutrition in pre-school shantytown children in Sao Paulo, Brazil. Sao Paulo Med J 1998; 116(2):1654-1660.
18. Cooper PA, Sandler DL. Outcome of very low birth weight infants at 12 to 18 months of age in Soweto, South Af-rica. Pediatrics 1997; 99(4):537-544.
19. Orozco M, Martinez H, Reyes H, Guiscafre H. A scale without anthropometric measurements can be used to iden-tify low weight-for-age in children less than five years old. J Nutr 1998; 128(12):2363-2368.