of the Effects of Electronic Cigarettes
Grace Nipp
Honors Thesis ENHS
Department of Environmental Sciences and Engineering Gillings School of Global Public Health
The University of North Carolina at Chapel Hill April, 2019
Approved
:________________________________ Dr. Ilona Jaspers (Advisor) UNC Department of Pediatrics
________________________________ Dr. Jason Surratt (Advisor/Reader)
Acknowledgements
This research is funded by R01 HL139369-01 in addition to T32 ES007126. Research reported
in this thesis was in part supported by NIH and the FDA Center for Tobacco Products. The
content is solely the responsibility of the author and does not necessarily represent the official
views of the National Institutes of Health or the Food and Drug Administration.
Additional funding was provided by William W. and Ida W. Taylor Undergraduate Research
Fellowship.
In Vitro exposures and analysis were completed with the aid of Yael Escobar, and chemical
analysis was completed with the help of Tianqu Cui, both of whom deserve much thanks and
Table of Contents
1. Abstract...4
2. List of Tables...5
3. List of Figures...5
4. Introduction...6
4.1 Background...6
4.2 Navigating the E-Cig Market...6
4.3 Existing Methods Regarding E-cig Aerosol Exposures...7
4.4 Chromatographic Techniques for Analyzing Aerosol...8
4.5 Using in vitro Exposure to Understand E-Cig Toxicity...9
4.6 Objectives...10
5. Methods...10
5.1 Chamber and Basic Exposure Parameters...10
5.2 Measuring Aerosol Deposition...11
5.3 Cell Culture...13
5.4 In Vitro Exposure...14
5.5 Gene Transcript Analysis...14
5.6 Protein Analysis...15
5.7 Statistical Analysis...15
5.8 Chemical Analysis...15
5.8.3 Standards Preparation...17
5.8.4 LC/MS Operation...17
6. Results and Discussion...20
6.1 Uniform and Substantial Aerosol Deposition...20
6.2 Increased Pro-Inflammatory Transcript and Protein Levels in response to PG...23
6.3 Propylene Glycol and Glycerin as Major Components of Collected Aerosol...25
7. Conclusions and Future Directions...28
8. References...29
1. Abstract
Use of electronic cigarettes (e-cigs) has proliferated in recent years. However, there
remains little consensus on e-cigs’ health effects. With the plethora of devices, e-liquids, and
flavorings available, a controlled yet flexible exposure system is needed, allowing for
comparisons between e-cig devices at varying settings. This study developed and optimized a
versatile e-cig exposure system and performed initial exposures to determine biological effects
associated with specific e-cig chemical constituents. Mock exposures using a fourth-generation
e-cig device were performed to determine exposure chamber parameters, which yield
homogeneous aerosol deposition. Initial exposures of human bronchial epithelial cells to vaped
propylene glycol (PG) and glycerin (GLY) were conducted at PG:GLY ratios of 100:0, 55:45,
and 0:100. IL-6 and IL-8 transcript and protein levels were analyzed following acute exposure.
Results indicate that this exposure system will allow for a controlled, replicable exposure to
2. List of Tables
Table 1. Chemical characterization of collected condensate from e-cig aerosol created at 85 W and 40 W.
Characterization completed using HILIC/ESI(–)-HR-QTOFMS_________________________________________25
Table 2. Solvent Volume and Mass Collected for 40W Samples_________________________________________32
Table 3. Solvent Volume and Mass Collected for 85W Samples_________________________________________32
3. List of Figures
Figure 1. Depiction of the aerosol exposure chamber_________________________________________________11
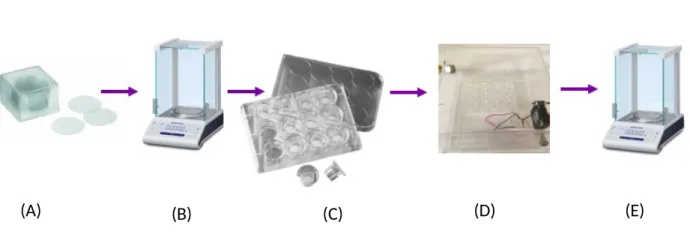
Figure 2. Procedure for collecting and measuring aerosol condensate_____________________________________12
Figure 3. Schema for labeling transwells and tissue culture plate placement_______________________________12
Figure 4. Mass deposited onto each coverslip (Area = 0.503 cm2) after exposure to vaporized E-liquid with different
chamber permutations. n=3, mean ± SD.____________________________________________________________20
Figure 5. Mass deposited onto each coverslip (Area = 0.503 cm2) after 40W exposure to vaporized (A) PG, (B)
GLY and (C) 55:45 PG/GL. n=3, mean ± SD._______________________________________________________20
Figure 6. Mass deposited onto each coverslip (Area = 0.503 cm2) after 80W exposure to vaporized (A) PG, (B) GLY and (C) 55:45 PG/GLY, n=3, mean ±SD.______________________________________________________21
Figure 7. IL-6 transcript levels 2 hours post-exposure in 16HBE cells exposed to e-cig aerosol produced at (A) 40W and (B) 85W. n=3. Mean ± SD. One-Way ANOVA, Dunnett post hoc test *p < 0.05, **p < 0.01, ***p < 0.001, ****p < 0.0001_______________________________________________________________________________22
Figure 8. IL-8 transcript levels in 2 hours post-exposure in 16HBE cells exposed to e-cig aerosol produced at (A) 40W and (B) 85W. n=3. Mean ± SD. One-Way ANOVA, Dunnett post hoc test *p < 0.05, **p < 0.01, ***p < 0.001, ****p < 0.0001__________________________________________________________________________23
Figure 9. IL-6 protein levels (pg/mL) 24 hours post-exposure in 16HBE cells exposed to e-cig aerosol produced at (A) 40W and (B) 85W. n=3. Mean ± SD. One-Way ANOVA, Dunnett post hoc test *p < 0.05, **p < 0.01, ***p < 0.001, ****p < 0.0001__________________________________________________________________________23
Figure 10. IL-8 protein levels (pg/mL) 24 hours post-exposure in 16HBE cells exposed to e-cig aerosol produced at (A) 40W and (B) 85W. n=3. Mean ± SD. One-Way ANOVA, Dunnett post hoc test *p < 0.05, **p < 0.01, ***p < 0.001, ****p < 0.0001__________________________________________________________________________24
Figure 11. Chemical characterization of collected condensate from e-cig aerosol created at 40W and 85W.
4. Introduction
4.1 Background
E-cigs were introduced to U.S. markets in 2007 as nicotine-delivery products and were
marketed as a safe alternative to traditional tobacco use (Besaratinia et al, 2014). However, there
is no scientific consensus that e-cigs are indeed safe (CDC, 2019, Besaratinia et al, 2014). E-cig
popularity has nevertheless skyrocketed, despite decades of decline in tobacco use (CDC, 2018,
Besartinia et al., 2014). E-cigs are becoming particularly popular among U.S. youth. Between
2011 and 2015, e-cig use grew by 900% among U.S. youth (Murphy 2016). Between 2017 and
2018, the CDC reported that the number of U.S. youth using e-cigs increased by 1.5 million
(CDC, 2019). In 2018, while conventional cigarette smoking dropped to less than 8.1% among
U.S. youth, 20.8% of U.S. high school students and 4.9% of middle school students reported
having used e-cig devices in the last thirty days (Cullen et al, 2018). Given the prevalence and
proliferation of e-cig use among youth, research is urgently needed to assess potential health
consequences of their usage.
4.2 Navigating the E-Cig Market
E-cigs operate by rapidly heating a mixture of propylene glycol (PG), glycerol (GLY),
nicotine, and flavoring up an atomizing coil. The mixture (e-liquid) is vaporized under intense
heat, and then cooled quickly into the aerosol particle phase. A third generation of e-cigs called
“Advanced Personal Vaporizers” (APVs) was released to the U.S. market in 2014. These APVs
allow the user to manually control the wattage, voltage, and air flow of the e-cig device, and
have much higher wattage potential than prior generations, allowing wicking materials, metal
heating coils, and e-liquids to be heated to much higher temperatures. For example, Sigelei’s
at much lower wattages of less that 10 W (Protano et al. 2018). Those who are experienced e-cig
users frequently choose APVs as they offer greater control over device settings and deliver larger
“vapor” plumes, while also providing a stronger “throat hit” (McQueen et al. 2011).
4.3 Existing Methods Regarding E-cig Aerosol Exposures
Aerosol chemistry and physics vary with particle size, ambient humidity, and
temperature. As such, aerosol production can be affected by the composition of the e-liquid and
temperature of the atomizing coil. There is concern that, with the greater heating capacity seen in
APVs, thermal decomposition of e-liquid components will occur, forming more toxic thermal
decomposition products. The Surgeon General reported in 2016 that “the detection and level of
carcinogens [in e-cig aerosol] depend on several factors, including the concentration of e-liquid
and the strength of the heating device” (Murphy 2016). While previous studies have shown that
e-cig aerosol particles may contain carbonyls (e.g., formaldehyde, acetylide, and acrolein),
gas-phase metals from the coil, and other uncharacterized, potentially toxic organic compounds, few
studies have been published which assess particle phase constituents as a factor of wattage under
standardized exposure conditions (Sleiman et al. 2016, Goniecwiz et al. 2014, Kosmider et al.
2014).
Despite the increasingly urgent need for conclusive research regarding both the chemical
composition of e-cig aerosol and its health effects, there remains a gap in the literature regarding
a replicable exposure chamber allowing for both in vitro exposure and chemical characterization
while not compromising or influencing the natural behavior of the aerosol. One method of
exposure is to “trap” liquid aerosol and to then expose cells to the condensate via conditioned
media (Bengalli et al. 2017). This method, however, completely separates the e-cig aerosol from
aerosol are an important facet of e-cig exposure. Another established exposure method is the
Vitrocell® exposure system, which was designed for traditional cigarette exposures and has been
retrofitted for e-cig exposure experiments. It is a method preferred by many because of its
ability to expose in vitro cells to aerosol at an air-liquid interface without separating or removing
the gas-phase chemical components (Lucci et al. 2018). When using systems such as the
Vitrocell® or others like it (Cultex®, XposeALI®, P.R.I.T® ExpoCube®, or Gillings Sampler)
for e-cig exposures, however, the e-cig aerosol is greatly diluted such that the cells are only
exposed to a fraction of the original aerosol, yielding a low deposition efficiency of around
15-30% (Lucci et al. 2018, Zavala et al. 2014, Thorne and Adamson 2013). The dilution built into
these systems was necessary to mimic traditional cigarette smoking profiles, but may disrupt the
chemistry of e-cig aerosol, thus not producing accurate exposures. Additionally, these systems
all feature high amounts of tubing through which the aerosol must travel. This is not ideal, as it
enhances wall losses and is not easily cleaned (Liu et al. 1985).
4.4 Chromatographic Techniques for Analyzing Aerosol
There has been extensive research into the chemical character of the e-liquid sold on the
open market. Many researchers have found that the concentrations of PG and GLY in these
mixtures match the advertised percentages (Beauval et al. 2017). Sleiman et al. (2016) analyzed
the composition of an e-liquid in addition to the volatile phase of phase of the vaped e-liquid
using gas chromatography coupled to mass spectrometry (GC/MS), and were able to aldehydes
and carbonyls such as acrolein, glycidol, and formaldehyde, which are known carcinogens also
found in cigarette smoke. Sleiman et al.’s (2016) results are additionally supported by other
findings (Goniewicz et al. 2013, Uchiyama et al. 2013). Furthermore, Sleiman et al. found that
Despite these chemical studies, there is a gap in the literature in regards to potentially harmful
oligomers formed as a byproduct of e-cig operation. Whereas most e-cig studies make use of
GC/MS, the GC/MS operates at too high a temperature to study oligomers without concern of
fragmenting these potentially large compounds (Sleiman et al. 2016, Cui et al. 2018). Liquid
chromatography coupled to mass spectrometry (LC/MS) is thus favored, and utilized in these
studies as a method to analyze potential oligomers formed from propylene glycol and glycerin
during vaping because it operates at a lower temperature (Cui et al. 2018).
4.5 Using in vitro Exposure to Understand E-Cig Toxicity
Airway epithelial cells represent the first natural line of defense when humans are
exposed to airborne toxicants, like e-cigs. In response to challenges, epithelial cells produce
cytokines ultimately resulting in inflammatory and immune cells, which comprise the initial
innate immune response (Boris et al. 2017). E-cig use in particular has been shown to induce an
inflammatory innate immune response in humans (Reidel et al. 2018, Lerner et al. 2015).
Chronic inflammation induced by continual exposure to airborne toxicants may cause
irreversible scarring and damage lung fibroblasts and the lung cells (Gerloff et al. 2017,
Rubenstein et al. 2015). While there has been previous research assessing human lung epithelial
cell inflammation in response to flavorings (Gerloff et al. 2017, Begnalli et al. 2017), there is not
an abundance of research characterizing airway responses to only PG, GLY, or a mixture
thereof. As such, an exposure system is needed which allows for airway epithelial cell exposure,
more accurately mimicking e-cigarette use profiles, and permitting the analysis of inflammatory
4.6 Objectives
Ultimately, we aim to describe our newly developed unique system, which allows for
easy exposure to e-cig aerosol, minimizes loss or disruption of aerosol and its gas-phase
chemical constituents, and produces homogenous aerosol deposition for in vitro exposures and
chemical analysis. Our interdisciplinary approach of analyzing the aerosol particles produced by
e-cigs produces a comprehensive analysis of aerosol-phase components of the vaped e-liquid,
which, in addition to in vitro inflammatory responses, allow us to demonstrate the merits and
versatility of our proposed exposure system.
5. Methods
5.1 Chamber and Basic Exposure Parameters
As shown in Figure 1, a 7.6 cm by 7.0 cm by 4.0 cm Plexiglas chamber was used for
e-cig exposures. The chamber was sealed using vacuum grease (Dow Corning®). At the front-right
corner of the chamber, an inlet port was constructed into which the e-cig device is inserted and
can be operated to mimic vaping. The inlet is sealed with a rubber stopper when the e-cig is not
being operated. Within the chamber, in front of the inlet, hangs a YaKoo® DC Brushless fan
(Model DC12V), used to circulate the incoming e-cig aerosol. The fan can be turned on and off
from outside the chamber. At the back-left corner of the chamber, and outlet was constructed, to
which a vacuum line was attached.
To conduct an exposure, cells were placed in the chamber, the e-cig was inserted into the
inlet and the vacuum line was attached. The e-cig device used for all exposures was a 3rd
generation DNA 200 Lava Box with a SMOK TFV4 mini tank with a TF-S6 sextuple (Kanthal)
coil. It was operated at 85W and 40W, which are representative of the high and low wattage
second inter-puff period during which the chamber was sealed. Each exposure lasted 10 minutes,
with a total of 20 puffs per exposure. The vacuum flow rate was set to 2.5 liters per minute using
a flowmeter (Dwyer, Inc.). A HEPA capsule filter (Product No. 12144, Gelman Sciences) and
water trap were implemented upstream of the flow meter to keep outgoing e-cig aerosol from
clogging the flow meter.
Figure 1. Depiction of the aerosol exposure chamber featuring the fan, vacuum, filters, and flow meter.
5.2 Measuring Aerosol Deposition
In order to confirm even and sufficient aerosol deposition, 12-mm glass cover slips were
first weighed using a Precision Balance (Sartorius), then inserted into a 12-well transwell cell
culture plate (Costar, Corning, NY). The cover slips and plate were then placed in the chamber
and an exposure was completed using a 3rd generation DNA 200 Lava Box with a SMOK TFV4
six coil mini tank filled with GLY and set to 85W. The puff and exposure parameters described
in 5.1 were utilized. Following the exposures, the cover slips were removed from the cell culture
subtracting the pre-exposure coverslip weight from the post-exposure coverslip weight (Figure
2). The 85W exposures were repeated, placing the tissue culture plate in each of the 4 corners of
the chamber (Figure 3). At each corner, the following permutations were tested: (1) fan and
vacuum on for entire 10-minute exposure; (2) Fan off, vacuum always on during full 10-minute
exposure; and (3) Fan and vacuum on only during the 4 second puff and off during each 26
second inter-puff interval, of the 10-minute exposure.
Further deposition experiments were conducted to ascertain aerosol mass deposition
using a more sensitive microbalance (Mettler Toledo) and utilizing 8-mm glass coverslips. These
exposures were performed similar to above, but utilized only permutation (3) and used all three
PG:GLY mixtures (100:0, 0:100, and 55:45) at both 85 and 40W.
Figure 2. 12-mm glass cover slips (A), were weighed pre-exposure on a microbalance (B), they were then inserted into a 12-mm insert transwell cell culture plate (C), the culture plate and coverslips were then placed in our exposure chamber (D), we ran the exposure and the cover slips were removed from the chamber and culture plate and weight post-exposure on the microbalance (E). Exposure condensate was then calculated by subtracting the pre-exposure coverslip weight from the post-exposure coverslip weight.
Inlet
Back
Left
Back
Right
Front
Left
Front
Right
Vacuum
1 2 3 4
A
B
C
Figure 3. Schema for labeling transwells and tissue culture plate placement within the exposure chamber.
5.3 Cell Culture
16HBE14o (16HBE) cells, an SV-40-transformed human male bronchial epithelial cell
line and gift from Dr. D. C. Gruenert (University of California at San Francisco), were used in
these experiments. They were grown in minimal essential media (MEM) (Gibco) with 10% Fetal
Bovine Serum (FBS), 1% penicillin-streptomycin, and 1% L-glutamine (Life Technologies, Inc.)
and subcultured in T-75 flasks with care being taken that they did not become overly confluent.
Subcultured 16HBE cells were plated onto 12-mm insert transwells (Costar, Corning, NY).
Flasks and transwells were coated with a Fibronectin solution (Medium (Life Technologies,
Inc.), 0.01% BSA (Sigma), 1% Vitrogen (Advanced Bio Matrix, San Diego), and 1% human
fibronectin (BD Biosciences)) to encourage adherence of the cells. Two days prior to exposure,
the apical medium covering the cells grown on Transwells was removed to establish air-liquid
interface (ALI). One day prior to exposure, the cells were serum starved using MEM media with
2% FBS. Immediately prior to exposures, the apical side of the cells was washed with DPBS and
the basolateral media changed using 2% FBS media. Further details regarding cell culture
5.4 In Vitro Exposure
Cultured cells were exposed to PG:GLY mixtures universal to all e-cig devices: 100:0,
0:100, and 55:45. For in vitro exposures, samples were collected at four time points following
cell exposure: 10 minutes, 2 hours, 8 hours, and 24 hours. At each time point, the apical wash,
basolateral supernatant, and cell lysate were collected. For each time point, there were three
technical replicates, and for each endpoint, there were three biological replicates. As such, we
repeated our 85W exposures and 40W exposures on three separate days each.
5.5 Gene Transcript Analysis
Quantitative Polymerase Chain Reaction (qPCR) was used to determine gene expression
of Interleukin-6 (IL-6) and Interleukin-8 (IL-8) relative to -actin. Total RNA was extracted
using 1% BME in Ambion Pure-LinkTM Lysis Buffer according to the manufacturer’s protocol
(Life Technologies, Inc.). cDNA was prepared using the Ambion Pure-LinkTM kit
(Thermo-Fischer). Real-time polymerase chain reaction (RT-PCR) using quantitative fluorogenic
amplification of first strand cDNAs was performed using the ABI Prism 7700 Sequence Detector
System (PE Biosystems, Foster City, CA), TaqMan Universal PCR Master Mix (PE
Biosystems), and primers and fluorophore-labeled probes.
Real-time measurements of fluorescence were taken and used to determine the threshold
intensity (Ct) for each amplification by calculating the number of cycles required to reach a
fluorescence intensity of 10 standard deviations greater than baseline fluorescence intensity
(Jaspers, 2001). Threshold intensity of the gene of interest was compared to the threshold
intensity of a constitutively expressed gene transcript (-actin) generated from the same sample.
This comparison determines Ct. The Ct from the sample was then compared to the Ct of a
2-Ct and averaged in three biological replicates, each with three technical replicates. This
process was used to analyze relative gene expression for both IL-6 and IL-8.
5.6 Protein Analysis
Enzyme-linked immunosorbent assays (ELISAs) were used to assess relative abundance
of proinflammatory cytokines IL-6 and IL-8 in basolateral supernatant collected from ALI
cultures post-exposure. Protein isolation and antibody detection were performed according to
manufacturer’s protocol (BD OptEIATM). The capture antibody was an Anti-Human IL-8
monoclonal antibody, the detection antibody was a Biotinylated Anti-Human IL-8 monoclonal
antibody, and the enzyme reagent was Streptavidin-horseradish peroxidase conjugate
(SAv-HRP). Standards were created using lyophilized recombinant human IL-8 and IL-6. Total protein
concentration in samples is reported in pg/mL.
5.7 Statistical Analysis
Data are presented as mean standard deviation (SD). Triplicate technical replicates
(n=3) were averaged and then compared to their corresponding biological replicates (n=3).
Statistical analyses comparing the biological replicates were completed using One-Way
ANOVAs against air control samples using Dunnett’s Post-Hoc tests. Significance is indicated
as: *p < 0.05, **p < 0.01, ***p < 0.001, ****p < 0.0001.
5.8 Chemical Analysis
5.8.1 Sterilization and Sample Collection
12-mm insert transwells (Costar, Corning, NY) and 8-mm diameter glass coverslips were
sonicated in 50:50 Methanol and water for 10 minutes and then dried using house air. Coverslips
were then weighed as described previously (Section 5.3) and returned to the transwells for
ten-minute exposure, the 8-mm glass coverslips were carefully removed from the transwell and
weighed in the microbalance. Care was taken to not push the glass coverslip around in the
transwell and the coverslip was transferred and weighed exposure-side-up. This was to limit
unintended mass gain or loss. Following weighing, the glass coverslip was transferred to an
empty, clean 20 mL borosilicate vial and stored until extraction.
5.8.2 Sample Extraction and Preparation
Two high performance liquid chromatographic methods coupled to electrospray
ionization high-resolution quadrupole time-of-flight mass spectrometry (ESI-HR-QTOFMS)
were used for the chemical analysis of e-cig aerosol collected: (1) reverse-phase liquid
chromatography (RPLC) operated in the positive (+) ion mode of ESI
(RPLC/ESI(+)-HR-QTOFMS) and hydrophilic interaction liquid chromatography operated in the negative (–) ion
mode of ESI (HILIC/ESI(–)-HR-QTOFMS). For e-cig aerosol samples analyzed via
RPLC/ESI(+)-HR-QTOFMS, methanol (LC-MS Chromasolv®, 99.9%, Fisher) and Milli-q
water (18.2 M) in a 50:50 (v/v) solution were added to the samples. For the samples analyzed
via HILIC/ESI(–)-HR-QTOFMS, a solution of 95:5 (v/v) of acetonitrile (Sigma Aldrich) and
Milli-q water (18.2 M) was added to the samples. Following addition of the solvent, the
samples were sonicated for 10 minutes to extract the collected aerosol mass into solution. Three
samples each were prepared for analysis by both RPLC/ESI(+)-HR-QTOFMS and
HILIC/ESI(–)-HR-QTOFMS. The volume of solvent varied by mass collected. For 40W, 5mL
and 2 mL of solvent was used and for 85W, 10mL of solvent was used. This was done to
For analysis of the 40W samples by RPLC/ESI(+)-HR-QTOFMS, the samples were
additionally diluted such that there would be a mass concentration of only 50 ppm in the
solution, which help to avoid saturating the detector and allowing for better quantification of PG
and GLY.
5.8.3 Standards Preparation
RPLC/ESI(+)-HR-QTOFMS:
For analysis of the 85W samples in RPLC/ESI(+)-HR-QTOFMS, one set of standards
containing masses of PG and GLY from the same stock of PG and GLY used in the e-cig device.
The standards were prepared at 500, 100, 10 and 1 ppm of GLY and 615, 123, 12.3 and 1.26
ppm PG (R2 = 0.9999 for GLY and R2 = 0.9984 for PG). For analysis of the 40W samples in
RPLC/ESI(+)-HR-QTOFMS, standards were diluted to 50 ppm from the measured collected
mass. Separate standards were created for PG and GLY. Both sets of standards were 25, 10, 2.5,
1 and 0.25 ppm PG and GLY, respectively (R2 = 0.9983 for GLY and R2 = 0.9991 for PG).
HILIC/ESI(–)-HR-QTOFMS:
For analysis of the 85W samples using the HILIC/ESI(–)-HR-QTOFMS method, we
created one set of standards containing PG and GLY at a concentrations of 7400, 740, 74, and
7.4 ppm and 1000, 100, 10, and 1 ppm, respectively. R2= 1.0 for the GLY standards, but there
was no response for PG using the HILIC method. For the 40W standards, we created one set of
standards containing only GLY at concentrations of 1, 2.5, 10, 25, 100 and 500 ppm (R2 =
0.9991).
5.8.4 LC/MS Operation
The chromatographic separations were carried out using a Waters ACQUITY UPLC HSS
(high-strength silica) column (2.1×100 mm, 1.8 µm particle size) at 45°C. The mobile phases
consisted of eluent (A) 0.1% acetic acid in water (LC-MS ChromaSolv-Grade, Sigma-Aldrich)
and eluent (B) 0.1% acetic acid in methanol (LC-MS ChromaSolvGrade, Sigma-Aldrich). The
applied 15 min gradient elution program was as follows: the concentration of eluent B was 100%
for the first 2 min, decreased to 10% from 2 to 10 min, held constant at 10% between 10-11 min,
then increased to 100% from 11 to 15 min, and held at 100% during a 5-min post run. The flow
rate and sample injection volume were 0.3 mL min−1 and 25-50 µL, respectively. Data were
acquired and analyzed by Mass Hunter Version B.03.01 Build 3.1.346.0 software. At the
beginning of each analysis period, the Q-TOFMS instrument was calibrated using a
commercially available ESI-L low concentration tuning mixture (Agilent Technologies), which
was composed of a 95:5 (v/v) solvent mixture of acetonitrile and water. This external calibration
was done in the low mass-to-charge ratio (m/z) range. Six specific ions were used from the
commercial tuning mixture during calibration, and include 68.9958, 112.9856, 301.9981,
601.9790, 1033.9881, 1333.9689, and 1633.9498 m/z. During the chromatographic runs, the
Q-TOFMS was continually calibrated by the constant injection of the following reference
compounds in the ESI source: purine, leucine enkephalin, and HP-0921 acetate adduct (Agilent
Technologies) (Cui et al. 2018).
HILIC/ESI(–)-HR-QTOFMS
An Agilent 6520 Series Accurate Mass Q-TOFMS instrument interfaced to an Agilent
6500 Series UPLC system, equipped with an ESI source operated in the negative (−) ion mode,
was used to chemically characterize PG and GLY standards, as well as the generated samples.
out using a Waters ACQUITY UPLC BEH Amide column (2.1 × 100 mm, 1.7 μm particle size,
Waters) at 35 °C. The mobile phases consisted of eluent (A) 0.1% ammonium acetate in water,
and eluent (B) 0.1% ammonium acetate in a 95 : 5 (v/v) ACN (HPLC Grade, 99.9%, Fisher
Scientific)/Milli-Q water. Both eluents were adjusted to a pH of ∼9.0 with NH4OH (Hettiyadura
et al. 2015). The gradient elution program was eluent A, 0% for 4 min, increasing to 15% from 4
to 20 min, constant at 15% between 20 and 25 min, decreasing to 0% from 25 to 26 min, and
constant at 0% from 26 to 30 min and during a 5-minute post-run. The flow rate and sample
injection volume were 0.3 mL min−1 and 5 μL, respectively. Data were acquired and analyzed by
Mass Hunter Version B.06.00 Build 6.0.633.0 software (Agilent Technologies). At the beginning
of each analysis period, the mass spectrometer was calibrated using a commercially available
ESI-L low-mass concentration tuning mixture (Agilent Technologies) in a 95:5 (v/v)
ACN/Milli-Q water. Instrument mass axis calibration was conducted in the low-mass range (m/z 50–1700).
Seven masses were used for calibration: m/z 68.9958, 112.9856, 301.9981, 601.9790, 1033.9881,
1333.9689, and 1633.9498. The adduct of hexakis (1H,1H,3H-tetrafluoropropoxy) phosphazene
+ acetate, purine, and leucine enkephalin were continuously infused for real-time mass axis
correction. The mass resolution of the ESI-HR-QTOFMS was approximately 8000–12300 from
6. Results and Discussion
6.1 Uniform and Substantial Aerosol Deposition
Figure 4. Mass deposited onto each coverslip (Area = 1.131 cm2) (Figure 3) after exposure to
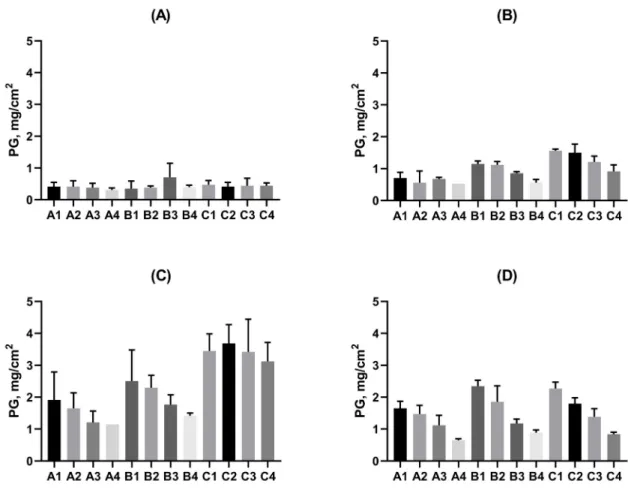
Figure 5. Mass deposited onto each coverslip (Area = 0.503 cm2) after 40W exposure to
vaporized (A) PG, (B) GLY and (C) 55:45 PG/GLY. n=3, Mean ± SD.
Figure 6. Mass deposited onto each coverslip (Area = 0.503 cm2) after 85W exposure to
vaporized (A) PG, (B) GLY and (C) 55:45 PG/GLY, n=3, Mean ±SD.
Our initial deposition experiment, permutation 1 (Figure 4A) at 85W, yielded even
deposition averaging 0.43mg (SD 0.098) (Figure 4A). However, constitutively running the fan
introduces a potential disruption to the normal aerosol nucleation and partitioning and also
increases potential wall loss. In order to address these concerns, we next ran deposition
experiments at the back right, back left, and front left corners of our chambers without running
the fan, while still operating the vacuum for the entire exposure (Permutation 2). Yet, the
deposition was clearly uneven and variable across the tissue culture plate at every corner of the
As a compromise, we decided to run the fan and the vacuum only for the four-second
puffs during our exposure (Permutation 3). Deposition experiments were conducted at both 85W
and 40W using this permutation, and the deposited condensate was measured using a
microbalance, allowing for a more precise understanding of the deposition in our different
exposures (Figures 5 and 6, respectively). There were no statistical differences in condensate
between any of the wells of the plates, indicating homogenous aerosol deposition (Figures 5 and
6). Furthermore, deposition was found to be on the scale mg/cm2, which is approximately 3
orders of magnitude greater than mass deposition seen in other systems such as the Vitrocel®
and Gillings Sampler, which saw deposition on the scale of g/cm2 (Lucci et al. 2018, Zavala et
al. 2014, Delaval et al. 2019). Such a large magnitude of deposition allows for assessment of
more acute exposures to the e-cig aerosol, which may allow for detection of in vitro responses
that might only be seen at these higher exposure levels. Additionally, the e-cig aerosol generated
using this exposure system travels through zero tubing prior to its entry into the chamber. This
allows for a direct exposure of cells to the e-cig aerosol and minimizes loss of aerosol to the
6.2 Increased Pro-Inflammatory Transcript and Protein Levels in response to PG
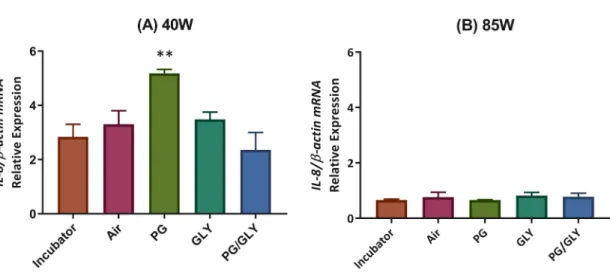
Figure 7. IL-6 transcript levels 2-hours post-exposure in 16HBE cells exposed to e-cig aerosol produced at (A) 40W and (B) 85W. n=3. Mean ± SD. One-Way ANOVA, Dunnett’s post hoc test *p < 0.05, **p < 0.01
Figure 9. IL-6 protein levels (pg/mL) 24-hours post-exposure in 16HBE cells exposed to e-cig aerosol produced at (A) 40W and (B) 85W. n=3. Mean ± SD. One-Way ANOVA, Dunnett’s post hoc test *p < 0.05, **p < 0.01, ***p < 0.001
Figure 10. IL-8 protein levels (pg/mL) 24-hours post-exposure in 16HBE cells exposed to e-cig aerosol produced at (A) 40W and (B) 85W. n=3. Mean ± SD. One-Way ANOVA, Dunnett’s post hoc test.
Proinflammatory cytokines IL-6 and IL-8 were assessed as a measure of inflammatory
innate immune response. Transcript levels of IL-6 (Figure 7) and IL-8 (Figure 8) in the cells
exposed to PG, GLY, and PG/GLY at 40 and 85W were compared to their respective air controls
transcript levels. However, only IL-6 protein levels were significantly increased at 40W 24-hours
after 100% PG exposure. At 85W, cells exposed to 100:0 PG and 100:0 GLY had significantly
increased IL-6 transcript levels, but no increase in IL-8 transcripts. The protein data for IL-6 and
IL-8 followed these trends (Figures 9 and 10, respectively), with a significant increase in IL-6
protein levels for the PG and GLY exposures 24-hours post-exposure.
These results provide evidence for a proinflammatory response due to exposure to vaped
humectants, particularly PG at both 40 and 85W exposures.
6.3 Propylene Glycol and Glycerin as Major Components of Collected Aerosol
PG GLY PG/GLY 0% 25% 50% 75% 100% 77% 29% 59% 36%
(A) 40W
M as s Fr ac ti o nPG GLY PG/GLY 0% 25% 50% 75% 100% 24% 5% 90% 70%
(B) 85W
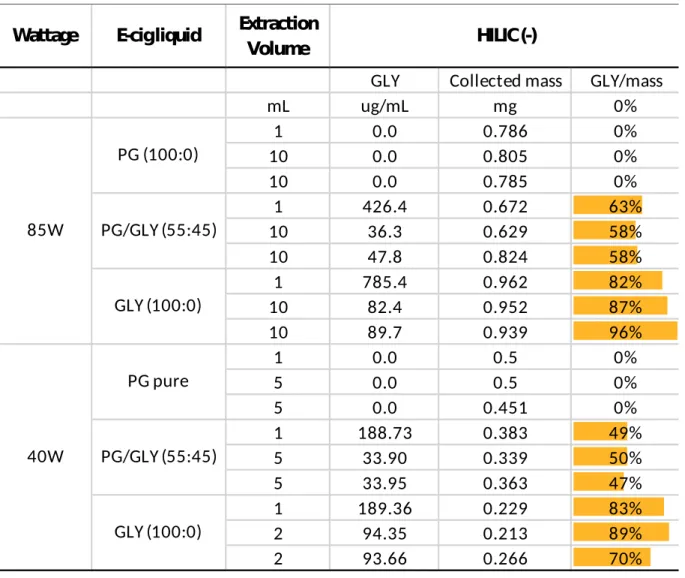
Unknown GLY PGTable 1. Chemical characterization of collected condensate from e-cig aerosol created at 85 W and 40 W. Characterization completed using HILIC/ESI(–)-HR-QTOFMS
Wattage E-cig liquid Extraction Volume
GLY Collected mass GLY/mass
mL ug/mL mg 0%
1 0.0 0.786 0%
10 0.0 0.805 0%
10 0.0 0.785 0%
1 426.4 0.672 63%
10 36.3 0.629 58%
10 47.8 0.824 58%
1 785.4 0.962 82%
10 82.4 0.952 87%
10 89.7 0.939 96%
1 0.0 0.5 0%
5 0.0 0.5 0%
5 0.0 0.451 0%
1 188.73 0.383 49%
5 33.90 0.339 50%
5 33.95 0.363 47%
1 189.36 0.229 83%
2 94.35 0.213 89%
2 93.66 0.266 70%
HILIC (-) 40W PG pure PG/GLY (55:45) GLY (100:0) 85W PG (100:0) PG/GLY (55:45) GLY (100:0)
Offline Liquid Chromatography coupled to Mass Spectrometry was utilized in order to
chemically characterize the aerosol condensate collected in the wells of the tissue culture plate.
The RPLC/ESI(+)-HR-QTOFMS method was used in order to isolate water soluble compounds,
while the HILIC/ESI(–)-HR-QTOFMS was used in order to isolate extremely water-soluble
compounds. As compared to the RPLC/ESI(+)-HR-QTOFMS method, the
HILIC/ESI(–)-HR-QTOFMS method provides more sensitive measurements and quantifications. However, the
HILIC/ESI(–)-HR-QTOFMS method could only resolve GLY, leaving PG undetectable. This
Because of this, RPLC/ESI(+)-HR-QTOFMS was useful for comparing relative amounts of PG
and GLY, while HILIC/ESI(–)-HR-QTOFMS may be more useful for indicating precise
measurements of GLY and also allowing the identification of other, less abundant products in the
samples.
Chromatographs isolated from RPLC/ESI(+)-HR-QTOFMS corresponding to PG (m/z
99.0417, RT = 2.2 min) and GLY (m/z 115.0366, RT=2.1 min) indicate that PG and GLY
account for a large fraction of collected aerosol condensate. While we hypothesized that at
higher wattages there would be a corresponding increase in thermal degradation of the vaped
humectants, this does not appear to hold true for both PG and GLY. Interestingly, PG appears to
undergo greater degradation at higher wattages than GLY does: PG was 77% of the mass
fraction at 40W, while only 24% of the mass fraction at 85W in the PG samples (Figure 11).
However, there is an abundance of unknown mass collected in our RPLC/ESI(+)-HR-QTOFMS
samples, and further analysis is needed in order to identify this mass.
At 85W we were able to isolate responses from PG and GLY using a single set of
standards containing both PG and GLY. However, at 40W, we discovered that it was necessary
to create two separate standards for PG and GLY. It is also likely that at 40W there was a greater
relative abundance of PG and GLY, such that the detector was saturated and the differential
ability of PG and GLY to cluster sodium ions became more apparent. It was thus additionally
necessary to dilute the 40W samples down to 50 ppm and also increase the concentration of
sodium in the eluent. More analyses need to be completed using the latter procedure to better
control for the competition effect between PG and GLY during LC/ESI-MS. Encouragingly, the
HILIC/ESI(–)-HR-QTOFMS quantification of GLY largely corresponds to the percentage of
HILIC/ESI(–)-HR-QTOFMS to be a useful check on quantification via
RPLC/ESI(+)-HR-QTOFMS.
The aerosol concentration inside the chamber, following operation of the e-cig, far
exceeded the capacity of the differential mobility analyzer (DMA, BMI) coupled to a mixing
condensation particle counter (MCPC, Model 1710, BMI). As such, the size distribution of the
e-cig aerosol particles in the exposure system remain unknown.
7. Conclusions and Future Directions
The described exposure system provided substantial and significant deposition across the
tissue culture plate while also minimizing necessary tubing, demonstrating that it is suitable for
in vitro exposures and chemical analysis. Subsequent in vitro exposures demonstrated a robust
proinflammatory response through elevated IL-6 transcript and protein levels due to exposure to
vaped 100:0 PG. Chemical analysis shows that PG and GLY remain a substantial fraction of the
e-cig condensate at both high and low wattages, though there remains an uncharacterized mass
which though which may contain unique oligomers derived from these humectants.
Further chemical analysis will identify and quantify potential oligomers in the unknown
fraction of aerosol condensate. Additionally, gas-only in vitro exposures will be conducted in
order to assess whether the cellular proinflammatory effects are gas-phase or particle-phase
dependent. This will be accomplished by filtering out the e-cig aerosols’ particles prior to their
8. References
Beauval, N., Antherieu, S., Soyez, M., Gengler, N., Grova, N., Howsam, M., … Garat, A. (2017). Chemical Evaluation of Electronic Cigarettes: Multicomponent Analysis of Liquid Refills and their Corresponding Aerosols. Journal of Analytical Toxicology, 41(8), 670–678. https://doi.org/10.1093/jat/bkx054
Bengalli, R., Ferri, E., Labra, M., & Mantecca, P. (2017). Lung Toxicity of Condensed Aerosol from E-CIG Liquids: Influence of the Flavor and the In Vitro Model Used. International Journal of Environmental Research and Public Health; Basel, 14(10), 1254.
http://dx.doi.org.libproxy.lib.unc.edu/10.3390/ijerph14101254
Besaratinia A, Tommasi S. Electronic cigarettes: the road ahead. Prev Med. 2014; 66:65-67. CDC Tobacco Free. (2019). Youth and Tobacco Use. Retrieved April 3, 2019, from Centers for
Disease Control and Prevention website: https://www.cdc.gov/tobacco/data_statistics/fact _sheets/youth_data/tobacco_use/index.htm
Cui, T., Zeng, Z., Santos, E. O. dos, Zhang, Z., Chen, Y., Zhang, Y., … Surratt, J. D. (2018). Development of a hydrophilic interaction liquid chromatography (HILIC) method for the chemical characterization of water-soluble isoprene epoxydiol (IEPOX)-derived
secondary organic aerosol. Environmental Science: Processes & Impacts, 20(11), 1524– 1536. https://doi.org/10.1039/C8EM00308D
Cullen, K. A., Ambrose, B. K., Gentzke, A. S., Apelberg, B. J., Jamal, A., & King, B. A. (2018). Notes from the Field: Use of Electronic Cigarettes and Any Tobacco Product Among Middle and High School Students — United States, 2011–2018. Morbidity and Mortality Weekly Report, 67(45), 1276–1277. https://doi.org/10.15585/mmwr.mm6745a5
Delaval, M., Egli, D., Schüpfer, P., Benarafa, C., Geiser, M., & Burtscher, H. (2019). Novel instrument to generate representative e-cigarette vapors for physicochemical particle characterization and in-vitro toxicity. Journal of Aerosol Science, 129, 40–52. https://doi.org/10.1016/j.jaerosci.2018.11.011
Gentzke, A. S. (2019). Vital Signs: Tobacco Product Use Among Middle and High School Students — United States, 2011–2018. MMWR. Morbidity and Mortality Weekly Report, 68. https://doi.org/10.15585/mmwr.mm6806e1
Gerloff, J., Sundar, I. K., Freter, R., Sekera, E. R., Friedman, A. E., Robinson, R., … Rahman, I. (2017). Inflammatory Response and Barrier Dysfunction by Different E-Cigarette
Flavoring Chemicals Identified by Gas Chromatography–Mass Spectrometry in e-Liquids and e-Vapors on Human Lung Epithelial Cells and Fibroblasts. Applied In Vitro
Toxicology, 3(1), 28–40. https://doi.org/10.1089/aivt.2016.0030
Gillman, I. G., Kistler, K. A., Stewart, E. W., & Paolantonio, A. R. (2016). Effect of variable power levels on the yield of total aerosol mass and formation of aldehydes in e-cigarette aerosols. Regulatory Toxicology and Pharmacology, 75, 58–65.
Business, D. G., CNN. (n.d.). As smoking falls out of favor, Altria looks beyond tobacco. Retrieved April 1, 2019, from CNN website:
https://www.cnn.com/2018/12/19/business/altria-juul/index.html
Goniewicz, M. L., Knysak, J., Gawron, M., Kosmider, L., Sobczak, A., Kurek, J., … Benowitz, N. (2014). Levels of selected carcinogens and toxicants in vapour from electronic cigarettes. Tobacco Control, 23(2), 133–139.
Hettiyadura, A. P. S., Stone, E. A., Kundu, S., Baker, Z., Geddes, E., Richards, K., & Humphry, T. (2015). Determination of atmospheric organosulfates using HILIC chromatography with MS detection. Atmospheric Measurement Techniques, 8(6), 2347–2358.
https://doi.org/10.5194/amt-8-2347-2015
Jaspers, I., Samet, J. M., & Reed, W. (1999). Arsenite Exposure of Cultured Airway Epithelial Cells Activates κB-dependent Interleukin-8 Gene Expression in the Absence of Nuclear Factor-κB Nuclear Translocation. Journal of Biological Chemistry, 274(43), 31025– 31033. https://doi.org/10.1074/jbc.274.43.31025
Jaspers, I., Zhang, W., Fraser, A., Samet, J. M., & Reed, W. (2001). Hydrogen Peroxide Has Opposing Effects on IKK Activity and I κ B α Breakdown in Airway Epithelial Cells. American Journal of Respiratory Cell and Molecular Biology, 24(6), 769–777.
https://doi.org/10.1165/ajrcmb.24.6.4344
Lerner, C. A., Sundar, I. K., Yao, H., Gerloff, J., Ossip, D. J., McIntosh, S., … Rahman, I. (2015). Vapors Produced by Electronic Cigarettes and E-Juices with Flavorings Induce Toxicity, Oxidative Stress, and Inflammatory Response in Lung Epithelial Cells and in Mouse Lung. PLoS One; San Francisco, 10(2), e0116732.
Libermann, T. A., & Baltimore, D. (1990). Activation of interleukin-6 gene expression through the NF-kappa B transcription factor. Molecular and Cellular Biology, 10(5), 2327–2334. Liu, B. Y. H., Pui, D. Y. H., Rubow, K. L., Szymanski, W.W. (1985). Electrostatic Effects In
Aerosol Sampling And Filtration. The Annals of Occupational Hygiene, 29(2), 251–269. Lucci, F., Castro, N. D., Rostami, A. A., Oldham, M. J., Hoeng, J., Pithawalla, Y. B., & Kuczaj,
A. K. (2018). Characterization and modeling of aerosol deposition in Vitrocell® exposure systems - exposure well chamber deposition efficiency. Journal of Aerosol Science, 123, 141–160. https://doi.org/10.1016/j.jaerosci.2018.06.015
Kosmider L, Sobczak A, Fik M, et al. Carbonyl compounds in electronic cigarette vapors: effects of nicotine solvent and battery output voltage. Nicotine & Tobacco Research. 2014; 16(10):1319-1326
McQueen, A., Tower, S., & Sumner, W. (2011). Interviews With “Vapers”: Implications for Future Research With Electronic Cigarettes. Nicotine & Tobacco Research, 13(9), 860– 867. https://doi.org/10.1093/ntr/ntr088
Murphy, V. H. E-Cigarette Use Among Youth: A Report of the Surgeon General; U.S. Department of Health and Human Services, 2016.
Journal of Respiratory and Critical Care Medicine; New York, 197(4), 492–501. http://dx.doi.org/10.1164/rccm.201708-1590OC
Rubenstein, D. A., Hom, S., Ghebrehiwet, B., & Yin, W. (2015). Tobacco and e-cigarette products initiate Kupffer cell inflammatory responses. Molecular Immunology, 67(2, Part B), 652–660. https://doi.org/10.1016/j.molimm.2015.05.020
Sleiman, M., Logue, J. M., Montesinos, V. N., Russell, M. L., Litter, M. I., Gundel, L. A., & Destaillats, H. (2016). Emissions from Electronic Cigarettes: Key Parameters Affecting the Release of Harmful Chemicals. Environmental Science & Technology, 50(17), 9644– 9651. https://doi.org/10.1021/acs.est.6b01741
Smoking is down, but almost 38 million American adults still smoke | CDC Online Newsroom | CDC. (2018, September 27). Retrieved February 23, 2019, from
https://www.cdc.gov/media/releases/2018/p0118-smoking-rates-declining.html Speen, A. M., Kim, H.-Y. H., Bauer, R. N., Meyer, M., Gowdy, K. M., Fessler, M. B., …
Jaspers, I. (2016). Ozone-derived Oxysterols Affect Liver X Receptor (LXR) Signaling A Potential Role For Lipid-Protein Adducts. Journal of Biological Chemistry, 291(48), 25192–25206. https://doi.org/10.1074/jbc.M116.732362
Thorne, D., & Adamson, J. (2013). A Review Of In Vitro Cigarette Smoke Exposure Systems. Experimental and Toxicologic Pathology, 65(7), 1183–1193.
https://doi.org/10.1016/j.etp.2013.06.001
Uchiyama, S., Ohta, K., Inaba, Y., & Kunugita, N. (2013). Determination of Carbonyl Compounds Generated from the E-cigarette Using Coupled Silica Cartridges
Impregnated with Hydroquinone and 2,4-Dinitrophenylhydrazine, Followed by High-Performance Liquid Chromatography. Analytical Sciences, 29(12), 1219–1222. https://doi.org/10.2116/analsci.29.1219
9. Appendix
Table 2. Solvent Volume and Mass Collected for 40W Samples
Method
Exposure Solvent Volume Solvent
Mass of Condensate (mg)
PG 95:5 ACN 1 mL 0.500
HILIC PG 95:5 ACN 5 mL 0.550
PG 95:5 ACN 5 mL 0.451
RPLC PG 50:50 MeOH 5 mL 0.507
PG 50:50 MeOH 5 mL 0.516
PG/GLY 95:5 ACN 1 mL 0.383
HILIC PG/GLY 95:5 ACN 5 mL 0.339
PG/GLY 95:5 ACN 5 mL 0.363
RPLC PG/GLY 50:50 MeOH 5 mL 0.414
PG/GLY 50:50 MeOH 5 mL 0.394
GLY 95:5 ACN 1 mL 0.229
HILIC GLY 95:5 ACN 2 mL 0.213
GLY 95:5 ACN 2 mL 0.266
RPLC GLY 50:50 MeOH 2 mL 0.232
GLY 50:50 MeOH 2 mL 0.197
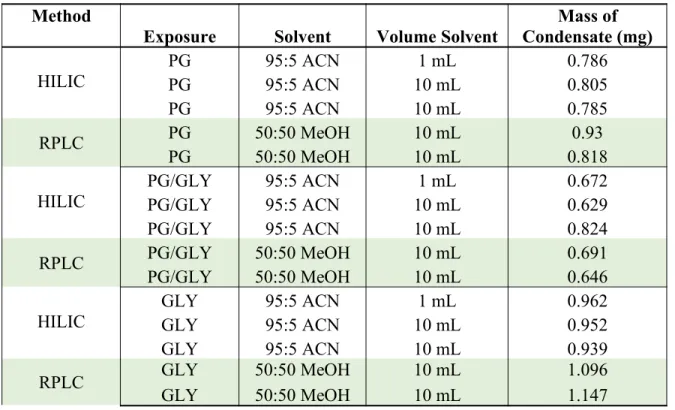
Table 3. Solvent Volume and Mass Collected for 85W Samples
Method
Exposure Solvent Volume Solvent Condensate (mg)Mass of
PG 95:5 ACN 1 mL 0.786
HILIC PG 95:5 ACN 10 mL 0.805
PG 95:5 ACN 10 mL 0.785
RPLC PG 50:50 MeOH 10 mL 0.93
PG 50:50 MeOH 10 mL 0.818
PG/GLY 95:5 ACN 1 mL 0.672
HILIC PG/GLY 95:5 ACN 10 mL 0.629
PG/GLY 95:5 ACN 10 mL 0.824
RPLC PG/GLY 50:50 MeOH 10 mL 0.691
PG/GLY 50:50 MeOH 10 mL 0.646
GLY 95:5 ACN 1 mL 0.962
HILIC GLY 95:5 ACN 10 mL 0.952
GLY 95:5 ACN 10 mL 0.939
RPLC GLY 50:50 MeOH 10 mL 1.096