R E S E A R C H
Open Access
The moderating role of food cue sensitivity
in the behavioral response of children to
their neighborhood food environment: a
cross-sectional study
Catherine Paquet
1,2*, Luc de Montigny
3, Alice Labban
4, David Buckeridge
5, Yu Ma
6, Narendra Arora
7and Laurette Dubé
6Abstract
Background:Neighborhood food cues have been inconsistently related to residents’health, possibly due to variations in residents’sensitivity to such cues. This study sought to investigate the degree to which children’s predisposition to eat upon exposure to food environment and food cues (external eating), could explain differences in strength of associations between their food consumption and the type of food outlets and marketing strategies present in their neighborhood.
Methods:Data were obtained from 616 6–12 y.o. children recruited into a population-based cross-sectional study in which food consumption was measured through a 24-h food recall and responsiveness to food cues measured using the external eating scale. The proportion of food retailers within 3 km of residence considered as“healthful” was calculated using a Geographical Information System. Neighborhood exposure to food marketing strategies (displays, discount frequency, variety, and price) for vegetables and soft drinks were derived from a geocoded digital marketing database. Adjusted mixed models with spatial covariance tested interaction effects of food environment indicators and external eating on food consumption.
Results:In children with higher external eating scores, healthful food consumption was more positively related to vegetable displays, and more negatively to the display and variety of soft drinks. No interactions were observed for unhealthful food consumption and no main effects of food environment indicators were found on food
consumption.
Conclusions:Children differ in their responsiveness to marketing-related visual food cues on the basis of their external eating phenotype. Strategies aiming to increase the promotion of healthful relative to unhealthful food products in stores may be particularly beneficial for children identified as being more responsive to food cues.
Keywords:Food environment, Food marketing, External eating, Children, Food consumption
* Correspondence:[email protected]
1Centre for Population Health Research, Sansom Institute for Health Research, School of Health Sciences, University of South Australia, GPO Box 2471, Adelaide, South Australia 5001, Australia
2Research Centre of the Douglas Mental Health University Institute, 6875 LaSalle Boulevard, Montreal, Québec H4H 1R3, Canada
Full list of author information is available at the end of the article
Background
The ubiquitous presence of calorie-dense food and food cues in urban environments, be it in the absolute or in relation to healthier options, has been repeatedly blamed for the rising trends in overconsumption and associated obesity over the last few decades [1, 2]. For instances, within- and cross-country analyses have linked increases in the share of the population diet taken up by modern processed food typically rich in calories, fats and sugars with increases in obesity prevalence [3–5]. Beyond food per se, observational studies have linked changes in mar-keting practices, such as food advertising [6–8] and prices [9], to an obesogenic shift in consumption pat-terns. Other practices such as product packaging and portion sizes have similarly been associated with un-healthful diets [10–12].
Further evidence for the relationship between caloric excess/obesity and environmental exposure conditions comes from studies assessing the absolute or relative availability of food access points typically considered as
unhealthful (e.g., fast food restaurants, convenience store) orhealthful(e.g., supermarket, fresh food outlets) [13]. These studies tend to use geo-referenced store lo-cations to determine the availability of food stores, most commonly within one’s neighborhood, be it defined using administrative units like census tracts, or unique geographical areas around the individual’s residence (or other reference points) using a pre-defined distance (e.g. 1-km or 1-mile radius). These studies have provided some evidence for associations between availability of fast-food stores or supermarkets and dietary and weight outcomes; however, null and unexpected findings are also common, especially in children (for reviews, see [14–18]). Most of these studies rely on the assumption that the presence of certain types of food outlets (e.g. su-permarkets or fast food restaurants) is a reasonable proxy for availability of predominantly healthful or un-healthful food. It is however important to acknowledge that variation may exist in the type of food available within similar types of food outlets. For instance, some supermarkets may carry as much, if not more unhealth-ful food products, compared to healthunhealth-ful alternatives. A few studies have captured attributes of food products sold within outlets that are expected to influence pur-chase behaviors, such as shelf space, displays, price or promotions, and their associations with dietary and weight outcomes [19–21], which may provide a more ac-curate and comprehensive picture of neighborhood food cues than access-only models. These studies have mostly relied on store audits, with few capitalizing on the rich information available from digital marketing databases, which can provide a thorough, dynamic and comprehen-sive assessment of local food environment cues [22]. Only a minority of these studies have been conducted in
children, with some evidence that children’s food con-sumption is related to fast-food and fruit and vegetable prices [23, 24]. Food marketing research has been mostly focused on television advertising with calls for more re-search on the impact of non-television food marketing [25], including sales promotions of energy-dense nutri-tion poor foods [26].
It is possible that the inconsistent findings on the rela-tionship between neighborhood food environment and obesity at the population level are tied to the lack of consideration to putative individual differences that exist in one’s responsiveness to external exposure to food and food cues. Some evidence for individual differences in food responsiveness can be found in the neuroscience literature, especially from studies related to the dopa-mine pathways, which are thought to be key in guiding eating and other motivated behaviors in response to pre-vailing internal states and external cues, such as food pictures [27] and food advertisement [28, 29]. For in-stance, when comparing obese to lean adults or children, research demonstrated heightened response to food cues in“hedonic” regions receiving strong dopaminergic pro-jections, such as the striatum, insula, amygdala, hippo-campus and the orbitofrontal cortex, as well as altered response (often heightened) in prefrontal and cingulate cortices [30, 31], and altered feeding-related modulation of hedonic and executive region responses [32]. Lean youth at risk for future obesity by virtue of parental obesity have shown hyper-responsivity of reward regions to palatable food receipts [33]. Weight gains have been associated with hyper-responsivity to food intake [34], food images [35], and food commercials [36]. Laboratory studies examining eating behavior in children in re-sponse to controlled food environments (snack test) have also found similar results using either genetic markers or neurocognitive tasks related to differential dopamine signaling [37, 38]. Finally, a population-based observational study reported that a positive as-sociation between fast food consumption and neigh-borhood exposure to fast-food restaurants was only observed in adult participants with a high behavioral approach response [39], as measured by the behav-ioral approach system scale (BAS; [40]), a psycho-logical scale reflecting one’s predisposition to incentives and appetitive stimuli, which has been linked to neural responses to food cues [41].
individual difference in neurobehavioral environment re-sponsiveness. External eating is a psychological measure that reflects one’s predisposition to eat upon exposure to environment food and food cues. This food-specific index of environment responsiveness has been associated with greater attentional bias and more positive evaluation of food cues [45], food cravings [46], and greater food consumption in response to food (vs neutral) commercials [47].
The aim of the study was to determine the degree to which external eating modifies the associations between measures of the food environment and food behavior in children, examining its effect on the consumption of both unhealthful food (i.e., nutrient poor, high fat/sugar/ cal food) and healthful alternatives. It is hypothesized that healthful and unhealthful environmental cues re-lated to the type of food outlets available within neigh-borhoods and to marketing strategies used within local stores (promotional activities and variety) would be more strongly associated with consumption in children with a higher sensitivity to external food cues.
Methods
Overview
Data for this cross-sectional study were obtained from a larger study (the “Brain-to-Society” study) which is examining multi-level (neighborhood, household, indi-vidual) drivers of childhood obesity. Parallel data collec-tions targeting families with children age 6–12 were undertaken in Canada and India. This study focuses on the Canadian sample, which consisted of a convenience sample of households from the Montreal Metropolitan area. Recruitment and data collection was undertaken by an independent research marketing firm on behalf of the research team. Participants were randomly selected from a pre-established database of households identified as likely to have children in the target age group, and who had indicated their willingness to participate in academic research. This frame was provided by the research mar-keting firm.
A total of 4947 potential households were initially con-tacted by telephone and asked about their willingness to complete a survey about children’s eating and lifestyle habits. Of those, 813 were non-residential records and 633 were not eligible. A further 2352 had unknown eligibility. Of those eligible, 69 only partially completed the interview, 355 refused, 99 could not be recontacted, 10 were excluded due to gender quota and 616 completed the interviews for an estimated response rate of 23%, which accounts for a proportion of the unknown eligibility group that may be eligible. Additional information on sample and recruitment can be found in Electronic Additional file 1.
After confirming whether any child aged between 6 and 12 years old lived in the household, interviewers asked to speak with a parent/guardian with the best
knowledge of the child’s daily habits, who was then asked to answer a series of questions regarding their child. When more than one eligible child lived in the household, the child with the next birthday was selected. Interviews were conducted between March and August 2013 and had a duration of 50 min. Participants received a CAD$10 incentive for their participation. Verbal con-sent was obtained from all participants included in the study, and ethical approval was obtained from McGill University’s Institutional Research Board.
Measures
Food consumption was measured using a selective 24-h food recall in which parents/guardians were asked to identify the number of times their child consumed se-lected food items the day prior to the interview, from the time the child woke up to bed time. A selective 24-h recall was chosen to provide a time-efficient way to ob-tain an initial assessment of dietary intake during the phone interview, during which a range of measures was administered. A more complete 24-h recall was used in a follow up data collection on a reduced sample. The food items consisted of 15 food items and 12 drink op-tions. Items were selected for their representativeness of children’s healthful and unhealthful dietary intake [48– 50] in addition to cover food categories commonly tar-geted by health promotion and marketing activities and are provided in Electronic Additional file 2.
Two intake variables were created to capture the child’s consumption of healthful foods and unhealthful foods based on items expected to be sold in food stores. Healthful food consumption was based on the sum of the reported frequency of consumption of (1) whole grain foods, (2) fruits, (3) green vegetables, (4) other vegetables, and (5) water. Unhealthful food consumption was based on the sum of the reported frequency of con-sumption of (1) soft drinks, (2) salty snacks (e.g. chips, nachos, buttered popcorn), (3) candy package or choc-olate bar, (4) cake, pie, cookies, doughnut, brownie, or other baked sweets, and (5) ice cream, ice cream bar, frozen yogurt, or popsicle. The two intake variables were compared to nutrient intake values computed from the more extensive 24-h dietary recall collected from a sub-set of the sample (n = 276). The healthful food con-sumption variable was correlated with fiber (r = 0.15,
p = 0.01) and water (r = 0.12,p = 0.04) intake and the unhealthful food consumption variable was correlated with sucrose (r = 0.17, p = 0.006), carbohydrate (r= 0.12,p= 0.04), and fatty acid (r= 0.15,p= 0.01).
instance, the term delicious was replaced for yummy and food sources like cafes replaced for corner stores (‘dépanneur’). The number of response options were also changed from five to three consistent with previous ad-aptations of the scale for children [51]. Internal consistency of this scale for the sample, assessed follow-ing the approach recommended by Gadermann and col-leagues [52] for estimating reliability coefficients for ordinal data, was found to be within the acceptable range, although not excellent (Cronbach’s alpha = 0.77).
Food environment
In order to provide a more comprehensive assessment of neighborhood food cues and consistent with calls for multi-dimensional measures of the neighborhood food environment that not only include access but also in-store food measures [53], two types of food environment measures were used in this study: the type of food re-tailers locally available and the marketing strategies used within local outlets. The types of food outlets locally available were measured using the modified Retail Food Environment Index (mRFEI), an index representing the proportion of food retailers classified as healthful devel-oped by the Centers for Disease Control and Prevention (CDC) and used to standardize reports on community food environment [54]. The choice of a retail food envir-onment index over availability of specific types of food stores is supported by evidence that combined indices are more robustly related to weight-related outcomes than individual food store availability measures [15]. Food outlets in the Montreal Census Metropolitan Area were identified using the Expanded Points of Interest (DMTI) database (2013). Field validation of this database has shown acceptable “representativity” of food outlets in the same city as the present study [55]. As per the CDC definition, supermarkets, grocery stores, fruit and vegetable stores, and supercenters were classified as “healthful”, and convenience stores and fast-food restau-rants as“less healthful”. More information on the identi-fication of food retailers can be found in Electronic Additional file 3. Food outlets and their locations were integrated into a Geographic Information System to identify all food outlets located within 3 km of each par-ticipant’s residence. The number of outlets was expressed using kernel density estimates (KDE; a distance-decay function weighing businesses closer to participants’ residence more heavily than those farther away) based on a 3-km circular buffer. A 3-km radius was selected based on results from a pilot analysis show-ing that over 99% of cohort home locations had one or more food outlets within this distance. The mRFEI was then calculated by dividing KDE value for “healthful” food outlets by the sum of the KDE values for“healthful” and “less healthful” food outlets. This proportion was
then multiplied by 100 to obtain a percentage of outlet density categorized as healthful.
Food marketing strategies
It is well known from the consumer behavior literature (for a review [56]) that business practices grouped under the umbrella of the four “P’s” of marketing (Product/ Place/Price/Promotion) impact behavior in general, in-cluding food consumption. While the above mRFEI measure taps into the type and location of products at the community level, it fails to address price and promo-tion strategies as well as the range of products available. We therefore investigated two types of promotional ac-tivity (frequency of price-promotion and food displays), regular price, and variety of food products available within selected healthful and unhealthful food categor-ies. Promotional activities and variety were expected to act as visual food-related environmental cues. Regular price was included as a strategy that would not necessar-ily be expected to act as visual food cue and was in-cluded as control strategy.
These measures were derived from a digital marketing database and have been described elsewhere [22]. In short, data for every single Universal Product Code (UPC) within target categories sold within stores located in the province of Québec, Canada were obtained from data on weekly purchases and marketing activities re-lated to consumer packaged goods in stores (ScanTrack) purchased from the Nielsen Corporation for the period of 2008–2013. Retailers consisted of grocery stores, mass merchandisers and convenience stores. Their locations were represented using forward sortation areas (FSA), which are geographic regions defined by the first three digits of Canadian postal codes, and linked to partici-pants based on their residential postal code. For each UPC, the following information was available: weekly price and in-store promotion, item description, brand name, package size, and the number of individual items within the pack. Food and Drug Administration (FDA) data on average serving size and unit package size were used to derive number of servings per unit.
two standard deviations below its average price [63]. In both cases, overall market shares of each UPC in the en-tire period (2008–2013) within their category were used as weights. Non-price promotion (food displays) was opera-tionalized as the proportion of food products (UPCs) within a target food category that was on display (e.g. end of aisles displays) in a given week in a given store.Variety
was operationalized as the average number of different Stock Keeping Unit (SKU; a number that uniquely identi-fies distinct products (and package sizes)) within product categories weighted by stores monthly sales. Marketing in-dicators data collected during the 12 months preceding participants’ recruitment were averaged and used as a measure of marketing exposures in analyses.
Analyses
Generalized linear mixed models were used to model, separately, children’s healthful or unhealthful food con-sumption as a function of food environment measures, external eating and their interactions. Models were esti-mated with exponential spatial covariance structure, where the covariance between two observations depended on the distance between the two observations. Linear models were used for healthful food consump-tion, whose distribution was approximately normal and Poisson models were used for unhealthful food, whose distribution was positively skewed. Food environment measures were modelled separately to maximize sample size for each food environment measure and to avoid multiple interaction terms in the same model. External eating and environmental variables were standardized prior to analyses. All analyses accounted for socio-demographic characteristics such as children’s age, gen-der, and household income (0-45 K,45-65 K, and >65 K CAD), and language in which the interview was done (French/English, proxy for cultural background). Area-level median household income and employment rates were initially considered as covariates but not included due to lack of associations with outcome variables. Stat-istical significance was set at alpha = 0.05, but interac-tions terms with level of significance up to alpha = 0.10 are also discussed considering the recognized lower stat-istical power of interaction testing [64], especially in non-experimental research [65].
Different sample sizes were available for the different exposure variables, with marketing indicators being available for fewer participants compared to the relative availability of food outlet indicator. In order to capitalize on all information available, each analysis was conducted using the maximum sample size available. In order to minimize the chance of bias due to missing marketing data, the odds of participants having a missing market-ing indicator was modelled in relation to behavioral outcomes and all environment-unrelated predictors,
population density (2011 Census Data) and socio-economic characteristics of the Census Tract of resi-dence (% high school completion, median household in-come, prevalence of low inin-come, % immigrants, employment rate (2006 Census Data (not available from 2011 Census)). Statistically significant predictors of miss-ing marketmiss-ing data (employment rate, median household income, and participant’s gender for soft drink indica-tors, and % high school completion and population density for vegetable marketing indicators) were used to obtain probability of missing marketing data and the in-verse of this probability was used as weight in their re-spective analyses (inverse probability weighting).
Results
Descriptive statistics
Of the 616 children recruited in the study, two had missing food consumption information and 30 had miss-ing household income information. Eight participants had a missing mRFEI, which resulted in a sample size of 576 children. Marketing data on regular soft drinks were available for 465 participants whereas vegetable data were available for 257 participants. The lower numbers of observations for vegetables were due to absence of sales from this food category in stores sampled one year prior to recruitment. Socio-demographic profiles of the analytic samples for the mRFEI, soft drink marketing, and vegetable marketing indicators are provided in Table 1 along with descriptive statistics on outcome and ex-posure variables. Comparisons of soft-drink marketing variables across the two marketing indicator analytic samples suggested that the vegetable marketing sample had lower soft drink prices, greater number of displays and variety, and more frequent discounts suggesting a possible greater representation of larger stores (e.g. su-permarkets) compared to smaller stores. No differences in socio-demographic or behavioral profile were found across the three analytical samples.
Relative availability of healthful food outlets
Results related to the availability of healthful food outlets are reported in Table 2. No main or interactive effects of the food environment was observed, but a statistically sig-nificant positive association was found between external eating and unhealthful food consumption.
Marketing food strategies
environment indicators and external eating reached the 0.05 statistical significance level. Marginally significant interactions were, however, observed for soft drink dis-play and variety in relation to healthful food consump-tion, with both interaction terms being negative suggesting that associations between these soft drink marketing indicators and healthful food consumption may be more negative for participants with higher exter-nal eating scores.
Results of analyses on the display, regular price, variety and discount frequency of vegetables are presented in Table 4. As for the analyses for the relative availability of healthful food outlets and soft drink marketing indica-tors, no main effects of marketing indicators were ob-served. Evidence of interactions between external eating and vegetable displays was found for healthful food
consumption. The interaction term was positive, sug-gesting that a positive association between vegetable dis-play and healthful food consumption might be more positive for children with higher external eating scores. The association between external eating and unhealthful food consumption observed previously did not reach statistical significance in this reduced sample.
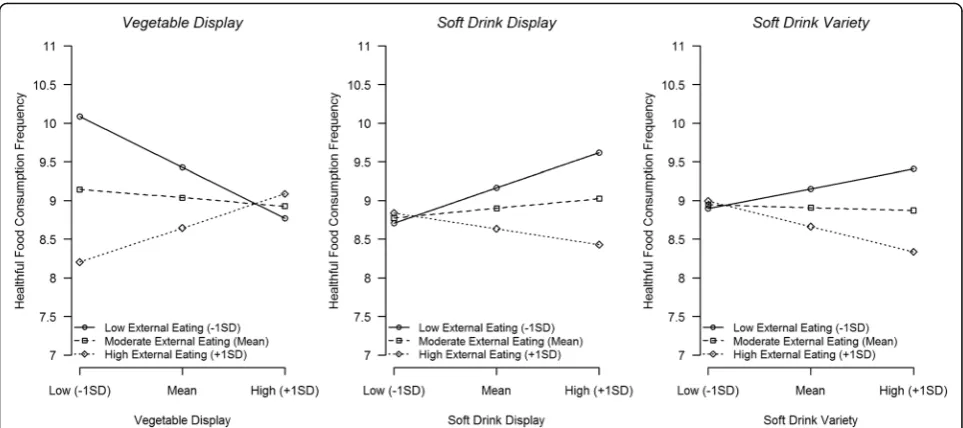
Visualization of interaction effects
Consumption frequency predicted from models in which statistically significant, or marginally significant interac-tions were found were plotted for different levels (mean ± one standard deviation) of the food environ-ment indicators and external eating scores (see Figure 1). High external eaters seemed to consume less health-ful food compared to low or intermediate external eaters
Table 1Descriptive statistics for analytic samples
mRFEI analysis Marketing strategy analyses
(n= 576) Soft drinks (n= 465) Vegetables (n= 257)
Age (mean(SD)) 9.1 (1.7) 9.1 (1.7) 9.0 (1.6)
Gender (n(%) boys) 284 (49.3%) 217 (46.7%) 109 (42.2%)
Household Income (n(%))
< 45 K 111 (19.3%) 96 (20.6%) 48 (18.6%)
45–65 K 114 (19.8%) 94 (20.2%) 45 (17.4%)
> 65 K 351 (60.9%) 275 (59.1%) 165 (64.0%)
Language survey conducted (n (%) French) 320 (55.6%) 256 (55.1%) 149 (57.7%)
Healthful eating score (mean (SD)) 8.6 (3.6) 8.7 (3.6) 8.7 (3.6)
Unhealthful food score (mean (SD)) 1.6 (1.2) 1.6 (1.2) 1.6 (1.3)
External eating score (Range: 10–30; mean (SD)) 21 (4) 21 (4) 21 (4)
mRFEI (mean (SD)) 23.3 (11.7) 22.4 (10.5) 22.4 (10.7)
Soft drinks discount frequency (mean (SD)) 0.41 (0.19)a 0.50 (0.15)a
Soft drinks display (mean (SD)) 0.26 (0.22)a 0.38 (0.17)a
Soft drinks regular price per serving (mean (SD)) 0.37 (0.12)a 0.30 (0.04)a
Soft drinks variety (mean (SD)) 128.2 (60.3)a 171.8 (44.7)a
Vegetable discount frequency (mean (SD)) 0.47 (0.13)
Vegetable display (mean (SD)) 0.05 (0.04)
Vegetable regular price per serving (mean (SD)) 0.31 (0.08)
Vegetable variety (mean (SD)) 410.5 (116.7)
mRFEImodified Retail Food Environment Index (proportion of food retailers classified as healthful),SDStandard Deviation
a
mean difference statistically significant (p< 0.05)
Table 2Main and interactive effect of external eating and mRFEI on food consumption
Predictors Healthful food consumption Unhealthful food consumption
Estimate 95% CI P RR 95% CI P
External eating score (1 SD) −0.18 (−0.49, 0.12) 0.23 1.09 (1.03, 1.16) 0.004
mRFEI (1 SD) −0.05 (−0.35, 0.25) 0.75 0.98 (0.92, 1.04) 0.49
mRFEI x external eating score 0.24 (−0.06, 0.54) 0.11 1.00 (0.94, 1.06) 0.87
in environments that can be considered less healthful, with a difference in daily healthful food consumption frequency of 1.9 in environments with low vegetable dis-plays, and 1.2 and 1.1 in environments with high soft drink displays and variety, respectively. No differences in consumption were apparent for values of the food envir-onment considered more healthful (higher vegetable dis-play and lower soft drink variety and disdis-play).
Discussion
This study investigated variations in the strength of asso-ciation between various aspects of the neighborhood food environment and food consumption in children as a function of individual differences in responsiveness to
food cues, as measured using the external eating scale. No evidence was found for a moderating influence of ex-ternal eating on the relationship between the relative availability of healthful, compared to unhealthful food retailers in proximity to a child’s residence, and chil-dren’s diet. However, some evidence for a moderating ef-fect of external eating was found when looking at marketing practices related to visual food cues such as store displays used within food outlets to promote healthful (vegetables) and unhealthful foods (soft drinks), and variety of soft drink products. Specifically, the direc-tion of the effect of store displays and soft drink variety for children with greater external eating was consistent with the dietary quality of each category (more healthful
Table 3Main and interactive effect of external eating and marketing indicators for soft drinks on food consumption
Healthful food consumption Unhealthful food consumption
Estimate 95%CI P RR 95%CI P
External eating (1 SD) −0.25 (−0.58, 0.07) 0.14 1.10 (1.03, 1.18) 0.005
Soft drink Discount Frequency (1 SD) 0.13 (−0.21, 0.47) 0.45 1.01 (0.94, 1.08) 0.87
External eating x Discount frequency −0.22 (−0.54, 0.11) 0.20 0.98 (0.92, 1.05) 0.57
External eating (1 SD) −0.26 (−0.59, 0.06) 0.11 1.10 (1.03, 1.18) 0.007
Soft drink Display (1 SD) 0.12 (−0.23, 0.48) 0.49 1.00 (0.92, 1.07) 0.91
External Eating x Display −0.33 (−0.67, 0.01) 0.057 0.97 (0.90, 1.04) 0.39
External eating (1 SD) −0.24 (−0.57, 0.09) 0.15 1.10 (1.03, 1.18) 0.005
Soft drink Regular price (1 SD) 0.04 (−0.32, 0.39) 0.84 0.97 (0.90, 1.05) 0.49
External Eating x Regular Price 0.07 (−0.24, 0.40) 0.65 1.01 (0.94, 1.08) 0.85
External eating (1 SD) −0.25 (−0.58, 0.07) 0.09 1.10 (1.03, 1.18) 0.007
Variety (1 SD) −0.01 (−0.36, 0.37) 0.97 0.98 (0.91, 1.06) 0.62
External eating x Variety −0.31 (−0.65, 0.03) 0.076 0.95 (0.88, 1.02) 0.17
Results of regression models analysis testing the interactive effect of external eating and marketing indicators for soft drinks on healthful and unhealthful food consumption (n= 465) adjusted for child age, gender, language, and household income.RRrelative risk,CIConfidence Interval,SDStandard Deviation
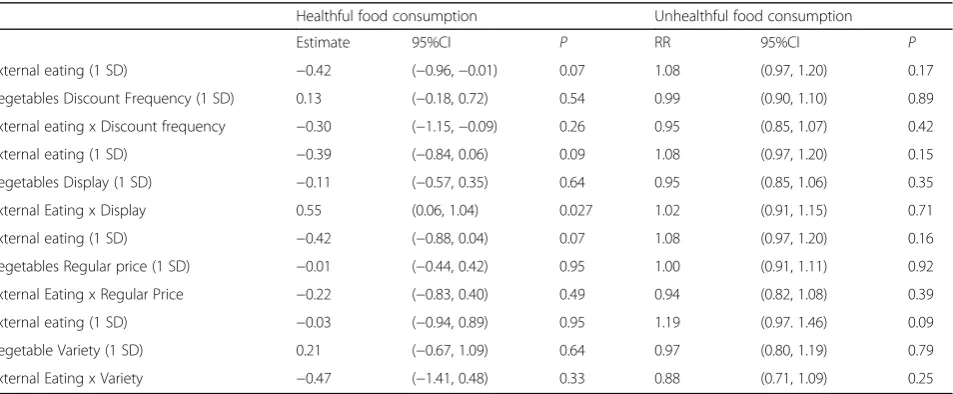
Table 4Main and interactive effects of external eating and marketing indicators for vegetables on food consumption
Healthful food consumption Unhealthful food consumption
Estimate 95%CI P RR 95%CI P
External eating (1 SD) −0.42 (−0.96,−0.01) 0.07 1.08 (0.97, 1.20) 0.17
Vegetables Discount Frequency (1 SD) 0.13 (−0.18, 0.72) 0.54 0.99 (0.90, 1.10) 0.89
External eating x Discount frequency −0.30 (−1.15,−0.09) 0.26 0.95 (0.85, 1.07) 0.42
External eating (1 SD) −0.39 (−0.84, 0.06) 0.09 1.08 (0.97, 1.20) 0.15
Vegetables Display (1 SD) −0.11 (−0.57, 0.35) 0.64 0.95 (0.85, 1.06) 0.35
External Eating x Display 0.55 (0.06, 1.04) 0.027 1.02 (0.91, 1.15) 0.71
External eating (1 SD) −0.42 (−0.88, 0.04) 0.07 1.08 (0.97, 1.20) 0.16
Vegetables Regular price (1 SD) −0.01 (−0.44, 0.42) 0.95 1.00 (0.91, 1.11) 0.92
External Eating x Regular Price −0.22 (−0.83, 0.40) 0.49 0.94 (0.82, 1.08) 0.39
External eating (1 SD) −0.03 (−0.94, 0.89) 0.95 1.19 (0.97. 1.46) 0.09
Vegetable Variety (1 SD) 0.21 (−0.67, 1.09) 0.64 0.97 (0.80, 1.19) 0.79
External Eating x Variety −0.47 (−1.41, 0.48) 0.33 0.88 (0.71, 1.09) 0.25
eating for vegetables and less healthful food consump-tion for soft drinks). These results are consistent with a laboratory-based study conducted with adults showing that the impact of viewing a food commercial (compared to a neutral commercial) while watching television was only observed in high, but not low, external eaters [47].
Our results, if replicated, would suggest that display strategies may be important environmental cues for chil-dren with external eating tendencies. Our findings would suggest that external eaters in this sample may not only respond to high-fat and high-sugar foods, but also to other types of food when they are more present in their immediate environment. The fact that external eating is associated with better diets in children when exposed to healthful food environment is consistent with the prop-osition that external eating might be adaptive in children [66, 67] and potentially explain negative or null correl-ation found between external eating and body mass index [66, 68].
No evidence of main or interactive effects of regular price or discount frequency was found. Regular pricing was not expected to lead to selected attention to particu-lar food products, especially in the targeted age group and was included as a control strategy. Although dis-count frequency might be associated with greater prod-uct visibility, it remains mainly a financial purchasing incentive, which may not be a strong incentive for chil-dren. The null finding for pricing, and to some degree discount frequency, therefore supports the specificity of the results for strategies that are associated with specific environmental visual cues.
A main effect of external eating, but no interactions with food environment measures, were found for un-healthful food consumption. It is possible that unhealth-ful foods, with their high rewarding values and their omnipresence in urban environments, may have reached a“visibility threshold”so that additional variance in their availability is insufficient to translate into behavioral dif-ferences, even for high external eaters. The relative over-representation of unhealthful foods is supported with our data where only 23% of food outlets were considered as a source of healthful food (as suggested by the mRFEI) and where in-store displays of soft drinks were also much more frequent than displays of vegetables.
The lack of main effect of marketing indicators on ei-ther food consumption measures contrasts with earlier work analyzing store sales data [69] showing that the same reinforcing marketing practices that increase sales of unhealthful food (namely soft drinks), when applied to healthful food (namely vegetables), were also success-ful in increasing their sales. Discount frequency results also contrast with findings from a recent study showing that the increase in sales associated with frequency of price discounts was largest for less healthy compared to healthier food categories [70]. However, when testing whether responsiveness to price discounts of the healthy and less healthy food categories varied by SES status, evidence for a SES gradient was only found for healthy compared to less healthy categories, a similar pattern to what was found in this study. It must be noted that the above results are based on sales data, which generally provide large sample sizes, but limited information on
individuals beyond basic demographics as well as an in-complete representation of individual diets.
Our findings suggest high responsiveness to food cues, while tied to potential adverse consequences when ex-posed to unhealthful environments, may translate into a beneficial impact in more healthful environments. This interpretation is also consistent with recent evidence that children carrying the 7-repeat allele on DRD4 (reflecting genetic predisposition to high environmental responsiveness) from a disadvantaged socio-economic background consumed more fat than the average, while the same carriers who were, in contrast, coming from a more advantaged socio-economic background consumed less fat than the average [71, 72]. That study concluded that the genetic marker identified individuals with “ dif-ferential susceptibility” to socio-economic disadvantage, which has also been linked to the nutritional quality of the food environment.
Limitations
In this study, it was assumed that neighborhood food environment would influence children dietary behavior through children’s influence on parents’ purchases. It could be argued that children’s responsiveness to these food cues is unlikely to influence food behavior in this age group, who may not play an active role in household food purchasing decisions. However, evidence exists that children play an important role in supermarket product purchases [73, 74], and that younger children may be more likely to ask for advertised food products com-pared to adolescents [75]. Food marketing is seen as a predictor of food preference and attitude in children [25, 76], even in children as young as 5–6 years old [77]. This was reflected in this sample, for which a subsample (n= 379) of parents were asked questions specifically re-lated to the role of children in purchasing decisions, with 85% stating that they would never, or rarely, not
allow their children to ask for products and only 17% that would never or rarely tell their children they would consider their preferences when making purchases.
It is also possible that children’s external eating ten-dencies are confounded by their parents’ own external eating behaviors or other type of parental influence. This is supported by evidence that maternal external eating is related to external eating of daughters and sons [78] and external eating in children is positively associated with perceived parental pressure to eat in boys and negatively associated with perceived parental restriction to eat in boys and girls [79]. Future research should aim to ac-count for parental factors in these relationships. In addition, parents may not have accurately reported their child’s intake or external eating tendencies, especially for older children, and their reports may have been influ-enced by a social desirability bias. Moreover, the food
consumption instrument focused only on a selection of food items and did not provide a comprehensive assess-ment of the child’s diet. The cross-sectional nature of the study precludes any causal inference and future studies should explore how these associations evolve over time. The relatively small sample size available for some analyses, especially those involving strategies to promote vegetable purchases, as well as the relatively low reliability of the external eating scale, resulted in limited statistical power for detecting interaction effects. In addition, food marketing variables were only available at a relatively large area level, which may not be a very representative picture of children’s most immediate food environment. However, a recent review comparing food environment associations across different expressions of neighborhood suggested that more immediate food en-vironment may not be as important as food enen-vironment defined for larger surroundings [15]. In order to assess the separate influence of healthful and unhealthful food marketing and compare ‘visual’ strategies like displays with more economic strategies like pricing and dis-counts, a relatively high number of interactions were tested. This, combined with the use of a statistical sig-nificance level of 0.10, may have increased the risk of chance findings. However, consistency in the type of be-haviors and strategies for which statistical significance was found, as well as the absence of associations for the ‘control’ strategy do not suggest that results are due to chance alone. Finally, the convenience sample used limits the generalizability of our results. Future studies should replicate findings in other populations.
Conclusion
measured through a variety of markers (genetic, neuro-cognitive, psychological) and their potential to identify responsiveness to a similar range of environmental healthful and unhealthful food cues, as well as clinical outcomes like weight status.
Additional files
Additional file 1:Additional information on sample and recruitment. (DOCX 16 kb)
Additional file 2:Food items included in 24-hour recall. (DOCX 15 kb)
Additional file 3:Food outlet classification. (DOCX 16 kb)
Abbreviations
CAD:Canadian dollars; FDA: Food and Drug Administration; FSA: Forward sortation areas; mRFEI: modified retail food environment index; SIC: Standard Industry classification; SKU: Stock keeping unit; UPC: Universal product code
Acknowledgements
We would like to thank Melissa Iskandar, Vinita Akula, Dr. Aida Faber, Dr. Uku Vainik, Mr. Hiroshi Mamiya, and Imen Farhat for their assistance in the preparation of this manuscript.
Funding
This study was funded by a Collaborative Team Grant, Canada–India Initiative on Childhood funded by the Canadian Institutes of Health Research and the Indian Council of Medical Research (#85512; http://www.cihr-irsc.gc.ca/; http://www.icmr.nic.in/). Catherine Paquet was funded by a National Health and Medical Research Council (NHMRC; https://
www.nhmrc.gov.au/) Program Grant (#0631947). Funding bodies played no role in the design or analysis of this study.
Availability of data and materials
The datasets during and/or analysed during the current study are available from the corresponding author on reasonable request.
Authors’contributions
CP, LD designed the study. LDM, AL, YM, DB, and NA contributed to the data collection. CP analysed and interpreted the data, and drafted the manuscript with the contribution of LD. All authors have revised the manuscript critically and approved the final version.
Ethics approval and consent to participate
Verbal consent was obtained from all participants included in the study, and ethical approval was obtained from McGill University’s Institutional Research Board. All procedures performed in studies involving human participants were in accordance with the ethical standards of the institutional and/or national research committee and with the 1964 Helsinki declaration and its later amendments or comparable ethical standards.
Consent for publication Not applicable.
Competing interests
The authors declare that they have no competing interests.
Publisher’s Note
Springer Nature remains neutral with regard to jurisdictional claims in published maps and institutional affiliations.
Author details
1Centre for Population Health Research, Sansom Institute for Health Research, School of Health Sciences, University of South Australia, GPO Box 2471, Adelaide, South Australia 5001, Australia.2Research Centre of the Douglas Mental Health University Institute, 6875 LaSalle Boulevard, Montreal, Québec H4H 1R3, Canada.3de Montigny Consulting, 3840 de l’Hôtel-de-Ville Ave., Montreal, Québec H2W 2G5, Canada.4Business Administration Division,
Seaver College, Pepperdine University, 24255 Pacific Coast Hwy, Malibu, CA 90263-4237, USA.5Department of Epidemiology, Biostatistics and Occupational Health, McGill University, 1020 Pine Ave. West, Montreal, Québec H3A 1A2, Canada.6McGill Centre for the Convergence of Health and Economics (MCCHE), Faculty of Management, McGill University, 1001 rue Sherbrooke Ouest, Montreal, Québec H3A 1G5, Canada.7The INCLEN Trust International, F-1/5, 2nd Floor, Okhla Industrial Area Phase–1, New Delhi, India.
Received: 8 November 2016 Accepted: 18 June 2017
References
1. Swinburn BA, Sacks G, Hall KD, McPherson K, Finegood DT, Moodie ML, Gortmaker SL. The global obesity pandemic: shaped by global drivers and local environments. Lancet. 2011;378:804–14.
2. Paeratakul S, Ferdinand DP, Champagne CM, Ryan DH, Bray GA. Fast-food consumption among US adults and children: dietary and nutrient intake profile. J Am Diet Assoc. 2003;103:1332–8.
3. Popkin BM. Global nutrition dynamics: the world is shifting rapidly toward a diet linked with noncommunicable diseases. Am J Clin Nutr. 2006;84:289–98. 4. Monteiro CA, Levy RB, Claro RM, de Castro IRR, Cannon G. Increasing
consumption of ultra-processed foods and likely impact on human health: evidence from Brazil. Public Health Nutr. 2011;14:5–13.
5. Moubarac J-C, Martins APB, Claro RM, Levy RB, Cannon G, Monteiro CA. Consumption of ultra-processed foods and likely impact on human health. Evidence from Canada. Public Health Nutr. 2013;16:2240–8.
6. Dhar T, Baylis K. Fast-food consumption and the ban on advertising targeting children: the Quebec experience. J Mark Res. 2011;48:799–813. 7. Goldberg ME. A quasi-experiment assessing the effectiveness of TV
advertising directed to children. J Mark Res. 1990;27:445–54. 8. Buijzen M, Schuurman J, Bomhof E. Associations between children's
television advertising exposure and their food consumption patterns: a household diary–survey study. Appetite. 2008;50:231–9.
9. Finkelstein EA, Ruhm CJ, Kosa KM. Economic causes and consequences of obesity. Annu Rev Public Health. 2005;26:239–57.
10. Scott ML, Nowlis SM, Mandel N, Morales AC. The effects of reduced food size and package size on the consumption behavior of restrained and unrestrained eaters. J Consum Res. 2008;35:391–405.
11. Young LR, Nestle M. The contribution of expanding portion sizes to the US obesity epidemic. Am J Public Health. 2002;92:246–9.
12. Hollands GJ, Shemilt I, Marteau TM, Jebb SA, Lewis HB, Wei Y, Higgins J, Ogilvie D. Portion, package or tableware size for changing selection and consumption of food, alcohol and tobacco. Cochrane Database Syst Rev. 2015(9):CD011045. doi:10.1002/14651858.CD011045.pub2.
13. Glanz K, Sallis JF, Saelens BE, Frank LD. Healthy nutrition environments: concepts and measures. Am J Health Promot. 2005;19:330–3. 14. Black C, Moon G, Baird J. Dietary inequalities: what is the evidence for the
effect of the neighbourhood food environment? Health Place.2014;27:229–42. 15. Cobb LK, Appel LJ, Franco M, Jones-Smith JC, Nur A, Anderson CA. The
relationship of the local food environment with obesity: a systematic review of methods, study quality, and results. Obesity. 2015;23:1331–44.
16. Black JL, Macinko J. Neighborhoods and obesity. Nutr Rev. 2008;66:2–20. 17. Caspi CE, Sorensen G, Subramanian SV, Kawachi I. The local food
environment and diet: a systematic review. Health Place. 2012;18:1172–87. 18. Fleischhacker SE, Evenson KR, Rodriguez DA, Ammerman AS. A systematic
review of fast food access studies. Obes Rev. 2011;12:e460–e71.
19. Drewnowski A, Aggarwal A, Hurvitz PM, Monsivais P, Moudon AV. Obesity and supermarket access: proximity or price? Am J Public Health. 2012;102:e74–80. 20. Gustafson A, Hankins S, Jilcott S. Measures of the consumer food store
environment: a systematic review of the evidence 2000–2011. J Community Health. 2011;37:897–911.
21. Nakamura R, Pechey R, Suhrcke M, Jebb SA, Marteau TM. Sales impact of displaying alcoholic and non-alcoholic beverages in end-of-aisle locations: an observational study. Soc Sci Med. 2014;108:68–73.
23. Engler-Stringer R, Le H, Gerrard A, Muhajarine N. The community and consumer food environment and children’s diet: a systematic review. BMC Public Health. 2014;14:1–15.
24. Le H, Engler-Stringer R, Muhajarine N. Walkable home neighbourhood food environment and children’s overweight and obesity: proximity, density or price? Can J Public Health. 2016;107:42–7.
25. Harris JL, Pomeranz JL, Lobstein T, Brownell KD. A crisis in the marketplace: how food marketing contributes to childhood obesity and what can be done. Annu Rev Public Health. 2009;30:211–25.
26. Hawkes C. Sales promotions and food consumption. Nutr Rev. 2009;67:333–42. 27. Van der Laan L, De Ridder D, Viergever MA, Smeets PA. The first taste is
always with the eyes: a meta-analysis on the neural correlates of processing visual food cues. NeuroImage. 2011;55:296–303.
28. Burger KS, Stice E. Neural responsivity during soft drink intake, anticipation, and advertisement exposure in habitually consuming youth. Obesity. 2014; 22:441–50.
29. Gearhardt AN, Yokum S, Stice E, Harris JL, Brownell KD. Relation of obesity to neural activation in response to food commercials. Soc Cogn Affect Neurosci. 2014;9:932–8.
30. Carnell S, Gibson C, Benson L, Ochner C, Geliebter A. Neuroimaging and obesity: current knowledge and future directions. Obes Rev. 2012;13:43–56. 31. Bruce AS, Holsen LM, Chambers RJ, Martin LE, Brooks WM, Zarcone JR,
Butler MG, Savage CR. Obese children show hyperactivation to food pictures in brain networks linked to motivation, reward and cognitive control. Int J Obes. 2010;34:1494–500.
32. Martin LE, Holsen LM, Chambers RJ, Bruce AS, Brooks WM, Zarcone JR, Butler MG, Savage CR. Neural mechanisms associated with food motivation in obese and healthy weight adults. Obesity. 2010;18:254–60.
33. Stice E, Yokum S, Burger K, Epstein L, Small D. Youth at risk for obesity show greater activation of striatal and somatosensory regions to food. J Neurosci. 2011;31:4360–6.
34. Geha PY, Aschenbrenner K, Felsted J, O'Malley SS, Small DM. Altered hypothalamic response to food in smokers. Am J Clin Nutr. 2013;97:15–22. 35. Demos KE, Heatherton TF, Kelley WM. Individual differences in nucleus
accumbens activity to food and sexual images predict weight gain and sexual behavior. J Neurosci. 2012;32:5549–52.
36. Yokum S, Gearhardt AN, Harris JL, Brownell KD, Stice E. Individual differences in striatum activity to food commercials predict weight gain in adolescents. Obesity. 2014;22:2544–51.
37. Levitan RD, Rivera J, Silveira PP, Steiner M, Gaudreau H, Hamilton J, Kennedy JL, Davis C, Dube L, Fellows L, et al. Gender differences in the association between stop-signal reaction times, body mass indices and/or spontaneous food intake in pre-school children: an early model of compromised inhibitory control and obesity. Int J Obes. 2015;39:614–9.
38. Silveira P, Kennedy J, Sokolowski M, Levitan R, Meaney M. Genetic and Developmental Origins of Food Preferences and Obesity Risk: The Role of Dopamine. In: Seckl JR, Christen Y (editors). Hormones, Intrauterine Health and Programming, Volume 12 (Research and Perspectives in Endocrine Interactions). Switzerland: Springer International Publishing; 2014. p. 157–74. 39. Paquet C, Daniel M, Knäuper B, Gauvin L, Kestens Y, Dubé L. Interactive
effects of reward sensitivity and residential fast-food restaurant exposure on fast-food consumption. Am J Clin Nutr. 2010;91:771–6.
40. Carver CS, White TL. Behavioral inhibition, behavioral activation, and affective responses to impending reward and punishment: the BIS/BAS scales. J Pers Soc Psychol. 1994;67:319.
41. Beaver JD, Lawrence AD, van Ditzhuijzen J, Davis MH, Woods A, Calder AJ. Individual differences in reward drive predict neural responses to images of food. J Neurosci. 2006;26:5160–6.
42. Vainik U, Dagher A, Dubé L, Fellows LK. Neurobehavioural correlates of body mass index and eating behaviours in adults: a systematic review. Neurosci Biobehav Rev. 2013;37:279–99.
43. Vainik U, Neseliler S, Konstabel K, Fellows LK, Dagher A. Eating traits questionnaires as a continuum of a single concept. Uncontrolled eating. Appetite. 2015;90:229–39.
44. Van Strien T, Frijters JE, Bergers G, Defares PB. The Dutch eating behavior questionnaire (DEBQ) for assessment of restrained, emotional, and external eating behavior. Int J Eat Disord.1986;5:295–315.
45. Brignell C, Griffiths T, Bradley BP, Mogg K. Attentional and approach biases for pictorial food cues. Influence of external eating. Appetite. 2009;52:299–306. 46. Burton P, Smit HJ, Lightowler HJ. The influence of restrained and external
eating patterns on overeating. Appetite. 2007;49:191–7.
47. van Strien T, Peter Herman C, Anschutz D. The predictive validity of the DEBQ-external eating scale for eating in response to food commercials while watching television. Int J Eat Disord.2012;45:257–62.
48. Camirand H. Les défis de l’alimentation des enfants et adolescents québécois (9-18 ans); Enquête sur la santé dans les collectivités
canadiennes, cycle 2.2, Nutrition (2004). Québec: Institut de la statistique du Québec; 2011.
49. Garriguet D. Plus de fruits, moins de gras: Les habitudes alimentaires des canadiens. Transition. 2007;37:7–10.
50. Johnson-Down L, Ritter H, Starkey LJ, Gray-Donald K. Primary food sources of nutrients in the diet of Canadian adults. Can J Diet Pract Res. 2006;67:7–13. 51. van Strien T, Oosterveld P. The children's DEBQ for assessment of restrained,
emotional, and external eating in 7-to 12-year-old children. Int J Eat Disord. 2008;41:72–81.
52. Gadermann AM, Guhn M, Zumbo BD. Estimating ordinal reliability for Likert-type and ordinal item response data: a conceptual, empirical, and practical guide. Pract Assess Res Eval. 2012;17:1–13.
53. Rose D, Bodor JN, Hutchinson PL, Swalm CM. The importance of a multi-dimensional approach for studying the links between food access and consumption. J Nutr. 2010;140:1170–4.
54. Centers for Disease Control and Prevention. Children’s food environment state indicator report 2011. Atlanta (GA): CDC; 2011.
55. Clary CM, Kestens Y. Field validation of secondary data sources: a novel measure of representativity applied to a Canadian food outlet database. Int J Beh Nutr Phys Act. 2013;10:77.
56. Chandon P, Wansink B. Is food marketing making us fat? A multi-disciplinary review. Foundations and Trends in Marketing. 2011;5:113–96.
57. Malik VS, Schulze MB, Hu FB. Intake of sugar-sweetened beverages and weight gain: a systematic review. Am J Clin Nutr. 2006;84:274–88. 58. Vartanian LR, Schwartz MB, Brownell KD. Effects of soft drink consumption
on nutrition and health: a systematic review and meta-analysis. Am J Public Health. 2007;97:667–75.
59. Hu FB, Malik VS. Sugar-sweetened beverages and risk of obesity and type 2 diabetes: epidemiologic evidence. Physiol Behav. 2010;100:47–54. 60. Dauchet L, Amouyel P, Hercberg S, Dallongeville J. Fruit and vegetable
consumption and risk of coronary heart disease: a meta-analysis of cohort studies. J Nutr. 2006;136:2588–93.
61. Carter P, Gray LJ, Troughton J, Khunti K, Davies MJ. Fruit and vegetable intake and incidence of type 2 diabetes mellitus: systematic review and meta-analysis. BMJ. 2010;341
62. Raju JS. The effect of price promotions on variability in product category sales. Mark Sci. 1992;11:207–20.
63. Nijs VR, Dekimpe MG, Steenkamps J-BE, Hanssens DM. The category-demand effects of price promotions. Mark Sci. 2001;20:1–22.
64. Whisman MA, McClelland GH. Designing, testing, and interpreting interactions and moderator effects in family research. J Fam Psychol. 2005;19:111–20. 65. McClelland GH, Judd CM. Statistical difficulties of detecting interactions and
moderator effects. Psychol Bull. 1993;114:376.
66. van Strien T, Herman CP, Verheijden MW. Eating style, overeating, and overweight in a representative Dutch sample. Does external eating play a role? Appetite. 2009;52:380–7.
67. Rodin J. Current status of the internal–external hypothesis for obesity: what went wrong? Am Psychol. 1981;36:361.
68. Silva JR, Capurro G, Saumann MP, Slachevsky A. Problematic eating behaviors and nutritional status in 7 to 12 year-old Chilean children. Int J Clin Health Psychol. 2013;13:32–9.
69. Dubé L, Labban A, Moubarac JC, Heslop G, Ma Y, Paquet C. A nutrition/ health mindset on commercial big data and drivers of food demand in modern and traditional systems. Ann N Y Acad Sci. 2014;1331:278–95. 70. Nakamura R, Suhrcke M, Jebb SA, Pechey R, Almiron-Roig E, Marteau TM. Price
promotions on healthier compared with less healthy foods: a hierarchical regression analysis of the impact on sales and social patterning of responses to promotions in great Britain. Am J Clin Nutr. 2015;101:808–16.
71. Silveira PP, Gaudreau H, Atkinson L, Fleming AS, Sokolowski MB, Steiner M, Kennedy JL, Meaney MJ, Levitan RD, Dubé L. Genetic differential susceptibility to socio-economic status and childhood obesogenic behavior: why targeted prevention may be the best societal investment. JAMA Pediatr. 2016; 170:359-64 72. Belsky J. The differential susceptibility hypothesis: sensitivity to the
environment for better and for worse. JAMA Pediatr. 2016;170:321–2. 73. Wilson G, Wood K. The influence of children on parental purchases during
74. Campbell S, James EL, Stacey FG, Bowman J, Chapman K, Kelly B. A mixed-method examination of food marketing directed towards children in Australian supermarkets. Health Promot Int. 2014;29:267–77. 75. Kelly B, Chapman K, Hardy LL, King L, Farrell L. Parental awareness and
attitudes of food marketing to children: a community attitudes survey of parents in new South Wales. Australia J Paediatr Child Health. 2009;45:493–7. 76. Cairns G, Angus K, Hastings G. The extent, nature and effects of food
promotion to children: a review of the evidence to December 2008. Geneva: World Health Organization; 2009.
77. Campbell KJ, Crawford DA, Hesketh KD. Australian parents' views on their 5–6-year-old children's food choices. Health Promot Int. 2007;22:11–8. 78. Jahnke DL, Warschburger PA. Familial transmission of eating behaviors in
preschool-aged children. Obesity. 2008;16:1821–5.
79. van Strien T, Bazelier FG. Perceived parental control of food intake is related to external, restrained and emotional eating in 7–12-year-old boys and girls. Appetite. 2007;49:618–25.
• We accept pre-submission inquiries
• Our selector tool helps you to find the most relevant journal • We provide round the clock customer support
• Convenient online submission • Thorough peer review
• Inclusion in PubMed and all major indexing services • Maximum visibility for your research
Submit your manuscript at www.biomedcentral.com/submit