AENSI Journals
Australian Journal of Basic and Applied Sciences
ISSN:1991-8178Journal home page: www.ajbasweb.com
Corresponding Author: Md. Abdulla Al Mamun, Department of Electrical, Electronic and Systems Engineering, Faculty of Engineering & Build Environment, Universiti Kebangsaan Malaysia, 43600 UKM, Bangi, Selangor, Malaysia.
Tel: +60149381801, E-mail: [email protected]
Simulation Model for a Real Time Solid Waste Bin Monitoring System
1Md. Abdulla Al Mamun, 1M.A. Hannan, 1Aini Hussain, 2Hassan Basri
1Department of Electrical, Electronic and Systems Engineering, Faculty of Engineering & Build Environment, Universiti Kebangsaan Malaysia, 43600, Bangi, Selangor, Malaysia
2Department of Civil and Structural Engineering, Faculty of Engineering & Build Environment, Universiti Kebangsaan Malaysia, 43600, Bangi, Selangor, Malaysia
A R T I C L E I N F O A B S T R A C T Article history:
Received 19 August 2014 Received in revised form 19 September 2014 Accepted 29 September 2014 Available online 3 November 2014
Keywords:
Solid Waste; Wireless Sensor Network; Castalia; ZigBee-Pro; GSM/GPRS; OMNET++
This paper presents a unique solution for real time solid waste bin status monitoring system. The system is based on a three tier architecture that uses wireless sensor networks. A number of sensory equipment are used to perceive the bin status where ZigBee and GPRS are used as communication technologies. In the physical architecture, the first tier contains smart bins to measure and transmit bin status parameters. In the second tier, gateways are used for storing and forwarding bin data to a remote server. A control station resides in the third tier to store and analyze the bin data. Based on the physical architecture, a simulation model have been designed and simulation is performed using Castalia to ensure the feasibility and accuracy of the system. Simulation result shows that, the proposed system would be able to monitor bin status on real time that can help to automate the solid waste monitoring process for the purpose of collection optimization.
© 2014 AENSI Publisher All rights reserved. To Cite This Article: Md. Abdulla Al Mamun, M.A. Hannan, Aini Hussain, Hassan Basri, Simulation Model for a Real Time Solid Waste Bin Monitoring System. Aust. J. Basic & Appl. Sci., 8(19): 356-360, 2014
INTRODUCTION
The depletion of resources in the current world is beyond control. Due to the rapid increase in population and urbanization, problems related to solid waste has increased day by day (World Bank, 1999). It is projected that the amount of solid waste will increase near 1.8 million tons per day by the year 2025 (Hoornweg, 2012). In the solid waste management process, waste collection and transport have become a considerable issue due to their impact on social health by emitting pollutant gas along with traffic and noise. Unusual use of vehicles for collecting waste expends more fuel which in turn produce a substantial amount of greenhouse gas (GhG) (Zhao, 2009). The number of collection increases when the partially fill up bins are collected. So it is very much needed to optimize the collection process by knowing the accurate information about a bin in advance (Faccio, 2011).
So far some researches have been investigated on monitoring the solid waste bin status. Different types of modern information and communication technologies have been used to measure and monitor the waste bin (Hannan, 2011; Arebey, 2010; Longhi, 2012; Rovetta, 2009)]. But the designed systems need much operation costs and are not real time. In this work, a real time solid waste bin monitoring system architecture has been proposed which is based on wireless sensor network (WSN) technology. A simulation model have been designed based on the proposed architecture and simulation have been done using Castalia.
Physical architecture:
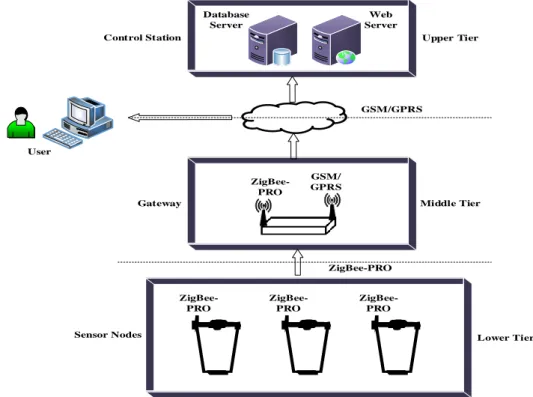
The hardware architecture of the proposed system is designed in three tier such as, i) lower tier, ii) middle tier and iii) upper tier as shown in Figure 1.
Lower tier:
ZigBee-PRO
ZigBee-PRO
ZigBee-PRO
Sensor Nodes Lower Tier
ZigBee-PRO
Fig. 1: Architecture of the real time bin monitoring system
Middle tier:
The middle tier consists of the gateways that receive the data sent by the smart bins. It then temporarily store the data while forward it to the control station through GPRS communication.
Upper tier:
The upper tier contains the control station. The GPRS receiver in the control station receives the data sent by the gateway and store it into a central database. The station hosts a set of web application for monitoring the bins status by the user.
Simulation:
To validate and evaluate the working of the proposed system, OMNET++ based Castalia simulator is used. Though currently there are many wireless sensor network simulator available but Castalia provides realistic and modular environment for radio and channel model (Boulis, 2009). Although it has incapability in testing specific sensor node platform, its modularity have significant advantage which facilitates defining each network layer properly and independent of other sensor network layers (Rastegarnia, 2011). Also Castalia is open source simulator so researcher may also implement their own algorithms and applications and can validate it.
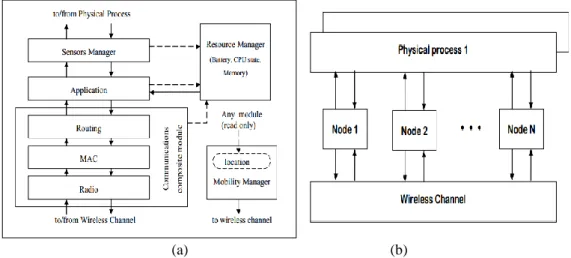
Simulation Model and Topology:
The simulation model is as shown in Figure 2 (a) and (b) (Boulis, A., 2009). Each node is defined as a composite module consisting of Radio, MAC, Routing, Application, Sensor manager, Mobility and resource manager modules. The definition of protocols and parameters in each module is necessary and has significant affects in the simulation results.
(a) (b)
Fig. 2: (a) Composite Node model, (b) Network model
Start
Setting initial value (Threshold, Timer etc.)
Timer expires, interrupt occur and request for sample
Return with sensor reading
Is sample Exceed threshold?
Is sent once? Sent the value
to the sink
End
No Yes
No Yes
Fig. 3: Flow chart of Application simple module
Path Loss Modeling and Simulation Parameter:
In this system, as the separation of nodes is from a couple of meters to hundred meters, the Log-normal shadowing model has been shown to give accurate estimates for average path loss [11]. This is the formula that returns path loss in dB as a function of the distance between two nodes and a few parameters.
+Xσd d η + d PL = d
PL
0
0 10. .log (1)
where PL(d) is the path loss at distance d, PL(d0) is the known path loss at a reference distance d0,
is thepath loss exponent, and
X
is a Gaussian zero-mean random variable with standard deviation σ. The metrics and parameters used for simulation are listed in the Table I.Table I: Simulation parameters.
Simulation parameters Value
Simulation Time 200s
Simulation field 250×250
MAC protocol T-MAC
Routing protocol No Routing
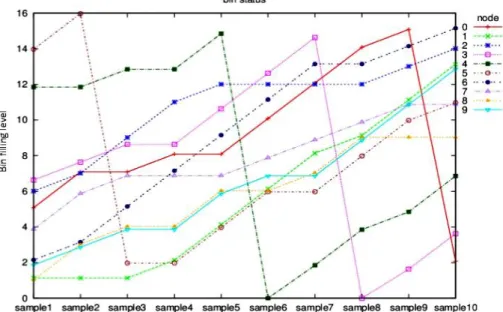
Fig. 4: Node by node presentation of filling level for 10 bins in 10 samples
For Figure 4, the X axis represents the nodes which are equivalent for each bin. Each line denotes a sample that shows the change in bin filling level node by node shown in Y axis. For Figure 5, the X axis represents the sample for each bin which are represent as node. Each line denotes the change in bin filling level sample by sample shown in Y axis. In each sample the filling level is increased and shows a rising trend in the graph. But, for a bin, when the filling level reached in the threshold value of 15 then the filling level value is dropped for the next sample of the corresponding bin. This means that, when the bin is fill up by waste, the system would be updated its information in the control station and the personnel responsible for collection have collected and emptied the bin. The simulation results shows the updated bin filling level with every sample.
Conclusion:
The objective of this research is to propose an architecture for real time bin status monitoring system and validate it through simulation. The designed architecture presents an advance system that can collect and monitor bin information as soon as someone throw waste inside a bin. The tasks are to acquire various data about bin condition, make some initial measurement on bin level and then send the data to the control station through the gateway. The information can further be used to help the route optimization application by providing the collected data in advance. Thus, the proposed system is able to reduce pollutant emissions and operation costs.
ACKNOWLEDGEMENT
Fig. 5: Sample by sample presentation of filling level for 10 bins in 10 samples
REFERENCES
Arebey, M., M.A. Hannan, H. Basri and R.A. Begum, 2010. Solid waste monitoring system integration based on RFID, GPS and camera. IEEE International Conference on Intelligent and Advanced Systems (ICIAS), pp: 1-5.
Boulis, A., 2009. Castalia, a simulator for wireless sensor networks and body area networks. National ICT Australia Ltd, Australia.
Faccio, M., A. Persona and G. Zanin, 2011. Waste collection multi objective model with real time traceability data. Waste Management, 31(12): 2391-2405.
Hannan, M.A., M. Arebey, R.A. Begum and H. Basri, 2011. Radio Frequency Identification (RFID) and communication technologies for solid waste bin and truck monitoring system. Waste Managementl, 31(12): 2406-2413.
Hoornweg, D. and P. Bhada-Tata, 2012. What a Waste – A Global Review of Solid Waste Management. World Bank, U.S.A.
Longhi, S., D. Marzioni, E. Alidori, G. Di Buo, P. Prist, M. Grisostomi and M. Pirro, 2012. Solid Waste Management Architecture Using Wireless Sensor Network Technology. 5th International Conference on New Technologies Mobility and Security (NTMS), pp: 1-5.
Rastegarnia, A. and V. Solouk, 2011. Performance evaluation of Castalia Wireless Sensor Network simulator. In 34th International Conference on Telecommunications and Signal Processing (TSP), pp: 111-115.
Rovetta, A., F. Xiumin, F. Vicentini, Z. Minghua, A. Giusti and H. Qichang, 2009. Early detection and evaluation of waste through sensorized containers for a collection monitoring application. Waste Management, 12: 2939-2949.
World Bank, 1999. What a waste. Solid Waste Management in Asia. Washington, DC. U.S.A.
Zhao, W., E.V. der Voet, Y. Zhang and G. Huppes, 2009. Life cycle assessment of municipal solid waste management with regard to greenhouse gas emissions: case study of Tianjin, China. Science of the Total Environment, 407(5): 1517-1526.