ANALYSIS OF PULMONARY FUNCTION TEST ON VARIOUS
CATEGORIES OF BMI
DISSERTATION SUBMITTED FOR
M.D., [PHYSIOLOGY] DEGREE - BRANCH V
THE TAMILNADU DR. MGR MEDICAL UNIVERSITY,
CHENNAI – 600 032. MAY - 2019
DEPARTMENT OF PHYSIOLOGY
TRICHY SRM MEDICAL COLLEGE HOSPITAL ANDRESEARCH CENTRE
CERTIFICATE
This Dissertation titled “ANALYSIS OF PULMONARY FUNCTION
TEST ON VARIOUS CATEGORIES OF BMI” is submitted to The Tamil Nadu
Dr.M.G.R Medical University, Chennai, in partial fulfillment of regulations for the
award of M.D. Degree in Physiology in the examinations to be held during May
2019.
This Dissertation is a record of fresh work done by the candidate,
DR.A.V.LAVANYA., during the course of the study (2016-2019).
This work was carried out by the candidate herself under my supervision.
DR. NACHAL ANNAMALAI M.D.,
Guide & HOD,
Professor, Department of Physiology,
Trichy SRM Medical College Hospital &
Research Centre
Trichy – 621 105.
DR. A.JESUDOSS M.S., DLO.,
DEAN
Trichy SRM Medical College Hospital
ACKNOWLEDGEMENT
It is my honour and privilege to thank Prof. Dr. NACHAL ANNAMALAI M.D.,
Professor, Department of Physiology, my guide, who has been helping me and
guiding me at every stage since the genesis of idea for this study. Her valuable
suggestions and timely advice were of immense help to me throughout all phases of
this study. She has always been a great moral support and encouragement throughout
the conduct of the study and also during my postgraduate course. I owe my sincere
thanks to her.
I express my deep sense of gratitude towards Dr, Muhil, M. M.D., Associate
Professor, Department of Physiology, Trichy SRM Medical College Hospital &
Research Centre, for constant encouragement and timely advice with respect to this
study of mine.
I thank Dr. Rajajeyakumar, M.D., Assistant Professor, Department of
Physiology, Trichy SRM Medical College Hospital & Research Centre, for always
being a constant encouragement, motivation and advice. I also thank Dr. Niranjana
M.D., Assistant Professor, Department of Physiology, Trichy SRM Medical College
Hospital & Research Centre for his timely suggestions to improve the scope of the
study and for helping me solve technical difficulties at every phase of this study.I also
thank Dr.S.V.Ajantha M.D., tutor , Department of physiology , for constant
encouragement and timely help during my postgraduate period.
I extend my gratitude towards our tutors, Mr. R. A. Suresh Balaji, M.Sc.,
I shall ever remain indebted to my parents, family and friends for their
encouragement and constant support.
I express my sincere gratitude to our respected Dean Dr. A. Jesudoss MS.,
DLO., Trichy SRM Medical College Hospital & Research Centre, Trichy for
permitting me to conduct this study.
I thank Dr. P. Thirumalaikolundhu Subramanian M.D., Vice Principal,
Trichy SRM Medical College Hospital & Research Centre, Trichy for his
encouragement and suggestion in completing this study.
I express my heartfelt thanks towards the lab technicians and non-teaching
fraternity of our department, who have been a significant support throughout my
course.
Last but not least, I would grossly fail in my duty, if I do not thank my
subjects who have undergone the inconvenience and discomfort of the investigations
during this study.
DECLARATION
I.Dr.A.V.LAVANYA hereby solemnly declare that the dissertation entitled
“ANALYSIS OF PULMONARY FUNCTION TEST ON VARIOUS CATEGORIES OF BMI” was done by me at Trichy SRM Medical College Hospital
And Research Centre, Irungalur, Trichy, under the supervision and guidance of
DR.NACHAL ANNAMALAI. M.D. (PHY), Professor and Head of the Department
of Physiology, Trichy SRM Medical College Hospital And Research Center ,
Irungalur , Trichy.
This dissertation is submitted to TheTamilnadu Dr.M.G.R Medical University,
towards partial fulfillment required for the award of M.D . Degree (Branch-V) in
Physiology.
I have not submitted this dissertation on any previous occasion to any
university for the award of any degree.
Place:
Date:
CERTIFICATE
This is to certify that this dissertation work titled “
ANALYSIS OF
PULMONARY FUNCTION TEST ON VARIOUS CATEGORIES
OF BMI”
of the candidate DR.LAVANYA.A.V with registration Number201615551 for the award of M.D.Degree in the branch of Physiology (Branch-V). I
personally verified the urkund.com website for the purpose of plagiarism Check. I
found that the uploaded thesis file contains from introduction to conclusion pages and
result shows 6 percentage of plagiarism in the dissertation.
DR. NACHAL ANNAMALAI M.D.,
Guide & HOD,
Professor, Department of Physiology,
Trichy SRM Medical College Hospital &
Research Centre
CONTENTS
S. No. TITLE PAGE NO
1. INTRODUCTION 1
2. AIM & OBJECTIVES 5
3. REVIEW OF LITERATURE 6
4. MATERIALS AND METHODS 50
5. RESULTS 57
6. DISCUSSION 77
7. CONCLUSION 84
8. SUMMARY 85
9. LIMITATIONS 86
10. RECOMMENDATION 87
11
ANNEXURES
1. BIBLIOGRAPHY
2. PROFORMA
3. CONSENT FORM
4. KEY TO MASTER CHART 5. MASTER CHART
xix xxx
LIST OF ABBREVIATIONS
WC HC WHR BMI ATS ERS PFT TV IRV ERV RV VC FVC IC FRC TLC MVV PEF MFVC FEV1 FEF Paw Ppl: Waist Circumference
: Hip Circumference
: Waist Hip Ratio
: Body Mass Index
: American Thoracic Society
: European Respiratory Society
: Pulmonary Function Test
: Tidal Volume
: Inspiratory Reserve Volume
: Expiratory Reserve Volume
: Residual Volume
: Vital Capacity
: Forced Vital Capacity
: Inspiratory Capacity
: Functional Residual Volume
: Total Lung Volume
: Maximum Voluntary Ventilation
: Peak Expiratory Flow
: Maximum Expiratory Flow Volume Curve
: Forced Expiratory Volume At First Second
: Forced Expiratory Flow
: Airway Pressure
Patm LLN GLI GOLD NHANES DLCO PV CW NM ILD CB COPD ROS EELV WOB EFL PEEPi VE TI TE TTOT PI PImax MEP MIP
: Atmospheric Pressure
: Lower Limit Of Normal
: Global Lung Initiation
: Global Initiative For Chronic Obstructive Lung Disease
: National Health And Nutrition Examination Survey
: Diffusing Capacity For Carbon Monoxide
: Pulmonary Vasculature
: Chest Wall
: Neuromuscular
: Interstitial Lung Disease
: Chronic Bronchitis
: Chronic Obstructive Lung Disease
: Reactive Oxygen Species
: End Expiratory Lung Volume
: Work Of Breathing
: Expiratory Flow Limitations
: Intrinsic Positive End Expiratory Pressure
: Minute Ventilation
: Inspiratory Time
: Expiratory Time
: Total Time Of Respiratory Cycle
: Inspiratory Pressure
: Maximal Inspiratory Pressure
: Maximum Expiratory Pressure
OSA
OHA
ARDS
SVC
fR
: Obstructive Sleep Apnea
: Obesity Hypoventilation Syndrome
: Acute Respiratory Distress Syndrome
: Slow Vital Capacity
LIST OF FIGURES
Figure.
No TITLE
Pg. No
1. Lung volumes & capacities 12
2. Spirogram display of FVC maneuver (volume-time curve) 16
3. Flow Volume Loop display of FVC 17
4. Flow Volume Loop of obstructive pulmonary defect 19
5. Fixed upper airway obstructions 21
6. Variable intra thoracic upper airway obstructions 22
7. Variable Extra thoracic upper airway obstructions 23
8. Flow Volume Loop of restrictive pulmonary defects 24
9. Spirometry pattern of obstructive & restrictive lung disease. 25
10. Flow Volume Loop of mixed pulmonary defect 25
11. Alterations in lung volumes & capacities in obstructive &
restrictive diseases
26
12. Simplified algorithm to assess the pulmonary functions 28
13. Comparison of Flow–Volume Loops in obese and
normal-weight women
35
14. The effect of obesity on lung volumes 37
15. Volume –Time Curve & Flow Volume Loop 54
16. Slow Vital Capacity 54
17. Maximum Voluntary Ventilation. 55
LIST OF TABLES
Table.
No TITLE
Pg. No
1. The International Classification of adult underweight, overweight and
obesity according to BMI.
30
2. Effects of obesity on physiologic parameters 34
3. Descriptive Statistics 57
4. Comparison of height among 3 groups of BMI. 59
5. Comparison of weight among 3 groups of BMI 60
6. Comparison of waist & hip circumference among 3 groups of BMI 61
7. Comparison of Waist –Hip ratio among under weight ,normal &
overweight.
62
8. Comparison of Forced Expiratory Volume at first second among 3
GROUPS OF BMI.
63
9. Comparison of Forced Vital Capacity among underweight , normal &
overweight.
64
10. Comparison of FEV1/FVC among underweight , normal & overweight. 65
11. Comparison of Peak Expiratory Flow among underweight , normal &
overweight.
66
12. Comparison of Expiratory Reserve Volume among underweight ,
normal & overweight.
67
13 Comparison of Maximum Voluntary Ventilation among under weight ,
normal & overweight.
14 Comparison of Maximum Inspiratory Pressures among under weight ,
normal & overweight.
69
15 Comparison of Maximum Expiratory Pressures among underweight ,
normal & overweight.
70
16 Correlation between normal weight & pulmonary function test 71
17 Correlation between underweight & pulmonary function test 72
18 Correlation between overweight & pulmonary function test 73
19 One Way ANOVA -Between BMI & Spirometric Parameters 74
LIST OF CHARTS
Chart.
No TITLE
Pg. No
1 Comparison of height among underweight , normal & overweight. 59
2 Comparison of weight among 3 groups of BMI 60
3 Comparison of waist & hip circumference among 3 groups of BMI 61
4 Comparison of waist –hip ratio among 3 groups of BMI 62
5 Comparison of Forced Expiratory Volume at first second among underweight , normal & overweight.
63
6 Comparison of Forced Vital Capacity among underweight , normal &
overweight.
64
7 Comparison of FEV1/FVC among underweight , normal & overweight. 65
8 Comparison of Peak Expiratory Flow among underweight , normal &
overweight.
66
9 Comparison of Expiratory Reserve Volume among underweight , normal &
overweight.
67
10 Comparison of Maximum Voluntary Ventilation among under weight , normal
& overweight.
68
11 Comparison of Maximum Inspiratory Pressures among under weight , normal
& overweight.
69
12 Comparison of Maximum Expiratory Pressures among underweight , normal &
overweight.
1
INTRODUCTION
Primary respiratory diseases are responsible for a major burden of morbidity and
untimely death world wide as lungs are often affected in multi-system diseases. Pulmonary
function tests are used to aid diagnosis, assess functional impairment and monitor treatment or
progression of respiratory diseases. The various factors which cause differences in pulmonary
function in normal people are ethnicity, physical activity, environmental conditions, altitude,
tobacco smoking, age, height, sex and socioeconomic status.1
As the Indian population is passing through a phase of nutrition transition, it is expected
to have higher prevalence of adult non communicable disease. Urbanization and globalization
are fuelling the nutrition transition. Nutritional status is a sensitive indicator of health status.
Body Mass index (BMI) is considered to be one of the best variable for the anthropometric
evaluation in nutrition & the general health screening.2
Our country is facing “dual burden of the disease” (underweight & overweight). Obesity
is doubled worldwide since 1980.3 The global epidemic of overweight and obesity is the major
health problem, whose prevalence is increasing in the developed and developing countries .It is
mainly due to an imbalance between calorie consumed & calorie expended4. WHO (2000)
defines obesity as “abnormal & excessive fat accumulation in adipose tissue, to the extent that
2
Approximately 43-48% of Indian men & women of 15-45 yrs of age group are facing
dual burden, out of which 30-36% people are underweight & 9-13% people are overweight
according to 2005 national family health survey (NFHS-3)6. There are an estimated 1.8 billion
adolescents in the world, in which 90% are residing in low- and middle-income countries These
adolescents belonging to 10–19 year olds, form the largest generation of young people in our
history.6 According to National Family Health Survey (2006) data, 12.1% males & 16% females
of Indian population are obese / overweight.4
Globally the prevalence of underweight is falling while the prevalence of overweight is
rising. High body mass index (BMI) is the sixth most important risk factor contributing to the
global disease burden according to the 2010 global burden of disease study7. It is the third risk
factor for disease burden in countries of central Asia.8
The worldwide estimated prevalence of overweight and obesity increased from 937 &
397 million in 2005 to 1.35 billion & 573 million in 2030. 2.8 million people die as a result of
being overweight & obese. In the age group of 35 -45 yrs, 36.9 % & 7.8% of people are
overweight & obese respectively in India, when compared to rest of the world.9
Overweight & obesity are associated with an increase burden of diabetes, hypertension,
cardiovascular disease, cancers & premature mortality. It is also a risk factor for various
respiratory diseases like Obstructive Sleep Apnea Syndrome, Asthma, COPD.10 The influence
of obesity on pulmonary function tests has been examined but the role of body fat distribution on
PFT has received limited attention. Studies of patients with upper body obesity have severely
compromised lung volumes than obese patients with lower body obesity.11
Obesity causes alteration in the respiratory mechanics, decreased respiratory muscle
3
pulmonary function test.2,12 Obesity was also found to have negative association with lung
functions.2The decline in pulmonary function with weight gain was mainly due to decrease in
respiratory muscle power because obesity limits the mobility of the thoraxic cage.13Both static &
dynamic lung volume & capacities were found to be decreased by decreasing lung & chest wall
compliance, which results in increase in airway resistance during expiration.
The most common abnormal Pulmonary function in obese individual was the reduction
in the functional residual volume & expiratory reserve volume which is generally seen when the
weight to height ratio is greater than 0.7.10 This reduction in FRC in obese individual was found
to be due to deposition of adipose tissue surrounding the rib cage, abdomen & in the visceral
cavity. In order to maintain appropriate level of ventilation, the obese individual had to do more
respiratory effort to overcome respiratory system elasticity.14
Underweight is not only common in rural but also in urban areas. It is common in
developing countries & is a burning issue in our country.8 The prevalence of underweight was
highest in semi-urban areas (30.2% and 53.2% according to Indian and international criteria,
respectively). According to the Indian criteria, the underweight prevalence was 14.1% and 9.8% ,
in the urban and highly urban areas but according to international criteria it was 27.1% and
19.2%.15 Underweight is associated with more frequent co-morbidities such as osteoporosis and asthma.8
Underweight is mainly due to undernourishment which results in reduced respiratory
muscle mass and because of this diaphragm contractility is reduced. In prolonged under
nutrition, energy is utilized at the expense of muscle protein leading to respiratory & diaphragm
muscle atrophy. Under nutrition can also reduce skeletal and respiratory muscle mass, which
4
Several studies were mentioned about the pulmonary functions test in obesity. Only
fewer PFT studies were done on underweight & very few comparative studies of PFT were done
in all 3 categories of BMI. So in this present study pulmonary functions are analyzed in the 3
5
AIMS & OBJECTIVES OF THE STUDY
To categories the subjects according to BMI.
To evaluate pulmonary function test in each subjects.
6
REVIEW OF LITERATURE:
Breathing is an essential function for survival and alterations in lung function can alter
the quality of life and day to day activities. In order to maintain respiratory homeostasis, the
respiratory system structures have to work in equilibrium so that the lungs should be ventilated
and the gases should diffuse through the alveolar-capillary barrier.17
Pulmonary Function Test:
Pulmonary function tests are commonly used for evaluating respiratory status & treating
persons with known pulmonary disease. It is also a part of routine health examination in
respiratory , occupational, sport medicine, & in public health screening.18The most important
pulmonary function is the uptake of oxygen from inspired air and giving up of carbondioxide in
the expired air thereby it maintain the tension of oxygen & carbon dioxide of arterial blood
within normal range.19
Spirometry is a physiological test which measures how much an individual can inhale &
exhale a definite volume of air as function of time.20 The spirometry assesses the integrated
mechanical function of lung , chest wall & respiratory muscles, by assessing different aspects of
pulmonary functions such as ventilation, perfusion and diffusion.19 The most important function
of pulmonary function test is to distinguish the 2 major groups of patho physiologic diseases
such as obstructive pulmonary disease & restrictive pulmonary disease.21
Measurable pulmonary parameters are:
1. Tidal Volume(VT)
7
3. Expiratory Reserve Volume(ERV)
4. Inspiratory Capacity(IC)
5. Vital Capacity(VC)
6. Forced Expiratory Volume In 1 Second(FEV1)
7. Forced Vital Capacity(FVC)
8. Forced Expiratory Flow (FEF25-75%)
The above parameters are measured using spirometry.22
Non Measurable pulmonary parameters are:
1. Residual volume
2. Forced residual capacity
3. Total lung capacity is the volume and capacity that are not measured using spirometry.22
It can be determined by the following techniques.
Nitrogen washout technique
Helium dilution technique
Body plethysmography
Radioactive xenon method.22
In 1947, Tiffeneau and Pinelli transformed spirometric measurements to the present form,
in which the forced expiratory volume in 1 second (FEV1) and the inspiratory or forced
expiratory VC (IVC and FVC) became main diagnostic indices in clinical medicine.23 The norms
for the standardization of spirometric techniques were created by the committee members of the
American Thoraxic Society after the snowbird workshop held in the year 1979, which was then
8
In 1994 there was an another similar initiative on the “Standardization of Spirometry”
done by the European community for steal & coal which lead to formation of first ERS, which
was updated in 1993. ERS included absolute lung volume, which was not included in ATS.20
Now a days this physiological test is used as a screening test to rule out general respiratory
illness.20
Indications are
To evaluate the baseline lung function & dyspneia,
To detect & to evaluate pulmonary impairment & disease ,
To monitor effects of therapies used ,
To evaluate operative risk & occupational-related lung disease.24
Contraindications are
Hemoptysis of unknown origin,
Peumothorax,
Active tuberculosis,
Unstable angina pectoris,
Recent myocardial infarction,
Thoraxic ,abdominal & cerebra aneurysms ,
Recent eye surgery,
Recent thoraxic & abdominal surgical procedures,
H/o recent syncope.24
Factors affecting the lung functions:
9
1. Airway resistance,
2. Compliance of the lung & thoraxic cavity ,
3. Elastic recoil of the lung
4. Respiratory muscle strength.25
Spirometric lung function parameters can be affected by many sorts of variations such as
1) Technical variations which include instrument & procedural variations, observer bias, &
individual variation & their interaction.
2) Biological variations which include intra-& inter –individual variations among
populations
3) Clinical variations which include variations caused by dysfunction or disease .18
The most important determinant of inter individual variability in lung functions are
1) Race or ethnic origin:
Whites (European descent) have slightly larger trunks and shorter legs compared to Blacks (African descent) at a given height which corresponds to vital capacities that are 10-15% larger for a given standing height in whites. Blacks, Hispanics and Native Americans have different PFT results compared to Caucasians. Ethnic differences in PFT have also been suggested for many other groups specifically Asians, Latin, Americans, Indians and South Africans.26
2) Age:
As individual gets older, there will be reduction in the lung volumes and capacities26.
According to Gomzi et al (1983) the pulmonary functions have been proved to be
10
3) Gender:
The volumes of adult female lung are 10-12% smaller than that of adult males who have
the same range of height & age. In males, the pulmonary function test has a positive
correlation with arm and leg length. In females, the pulmonary functions are negatively
correlated with the body circumference, skin fold & the weight.27
According to study conducted by Joyarani etal (2015), females tend to have lower
pulmonary function test value as their respiratory muscle endurance & chest wall
compliance is lower than that of their male counterparts.28 There is a stronger alterations
in FVC and FEV1 in men when compared to women, because the males have a greater
frequency of android fat deposit pattern, while females has gynoid fat. This greater
deposit of fat in the abdominal region contributes to a greater resistance to diaphragmatic
contraction which in turn alter the ventilatory mechanics according to the study
conducted by Enzi et al (1916).17
4) Height & weight:
Mukhopadhvay et al states that shorter persons will have generally a smaller PFT results when compared to the taller persons of the same age.26 Pulmonary function test has a highly positive correlation with height in sitting & standing posture in
both sex.27
Weight has various effects on pulmonary function tests such as 1) Impairment on pulmonary function testing,
2) Small airway dysfunction and expiratory flow limitation, 3) Alterations in respiratory mechanics,
11
5) Decreased respiratory muscle strength and endurance, 6) Decreased pulmonary gas exchange,
7) Lower control of breathing,
8) Limitations in exercise capacity.26,29
5) Socio-economic status
Low socio-economic status individual do not have lung volumes & capacities like that of
high socio-economic .There is a decline in respiratory functions earlier & rapidly in low
socio-economic status when compared with high socioeconomic status.27
Pulmonary Function test parameters:
Ventilation is the process of air movement in & out of alveoli, which depends on 3 parameters
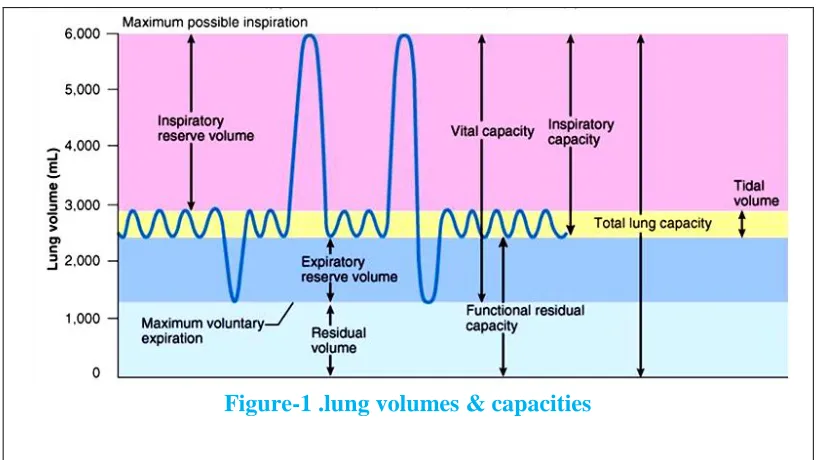
[image:28.612.102.513.392.622.2]like lung volume, capacities & mechanism of breathing19.
Figure-1 .lung volumes & capacities
12 I. Lung Volumes :
1) Tidal Volume (VT): The volume of air inspired or expired out of the lung during quiet
breathing is the tidal volume.
Normal value: 500ml in adult.
2) Inspiratory Reserve Volume (IRV): The volume of air inspired with maximal
inspiratory effort in excess of the tidal volume (i.e) inspiratory muscle is used maximally
while measuring IRV.
Normal value: 3 1itre in male & 2 1itre in female.
3) Expiratory Reserve Volume (ERV): The volume of air expired with a maximum
expiratory effort after passive expiration is called ERV.
Normal value: 1 liter in male & 0.7 liter in female.
4) Residual Volume (RV): The volume of air remains in the lung at the end of maximum
expiratory effort.
Normal value: 1.2 liter in male & 1.1 liter in female.19
2. Lung Capacities :
1) Vital Capacity (VC): The maximum amount of air expired after a maximum inspiratory effort. The measurement of vital capacity can also be considered as frequently used
method in modern anthropological investigation & serve as a good indicator for assessing
the living condition, abilities, physical &health condition of individuals & population.
Normal value: 4.5 liter in male & 3 liter in female.
13
of a reduced FEV1to FVC ratio suggests a restrictive ventilatory problem. Severity of
reduction in FVC can be characterized by
i. Mild:>70% of predicted
ii. Moderate:60-69% of predicted
iii. Moderately severe:50-59% iv. Severe:35-49% of predicted
v. Very severe:<35%predicted24
3) Inspiratory Capacity (IC): Inspiratory capacity is the maximum amount of air that can be inspired from the resting expiratory level.
IC=IRV+TV
Normal value: 3.5 liter.
4) Functional Residual Capacity (FRC): The amount of air remaining in the lung at the
end of normal expiration is the Functional Residual capacity.
FRC=ERV+RV.
Normal value: 2 liter.
5) Total Lung Capacity (TLC): Total lung capacity (TLC) is the volume of air present in the lung at the end of maximal inspiration.
Normal value: 6 liter in male, 4.2 liter in female.
4. Mechanics of breathing :
It depends upon the compliance & airway resistance. The compliance measures
relative stiffness & distensibility of the lungs & thorax. Airway resistance is the
resistances to airflow through the conducting air passages. Mechanics of breathing are
14
1) Maximum Mid expiratory Flow (MMEFR) or FEF25-75: The maximum flow achieved
during middle third of the total expired volume is expressed as Forced Expiratory Flow
(FEF) at 25-75% lung volume. FEF25-75% indicates the patency of small airway. The
measurement of flow rate FEF 200-1200ml indicates the patency of large airway.19
2) Maximum Voluntary Ventilation (MVV): Maximum voluntary ventilation is the maximum volume of air that a subject can breathe rapidly and forcefully over a specified
period of time .It is expressed in L/min.20
Normal value: 150 liter /min (males), 125 liter /min (females).
3) Peak Expiratory Flow (PEF): PEF is the maximum expiratory flow achieved from a
maximum forced expiration, starting without hesitation from the point of maximum lung
inflation, expressed in liter per second20.It is used to assess large central airway
obstruction.
Normal value: 350-400 liter /min
4) Maximal Expiratory Flow Volume Curve (MFVC): This is the curve obtained, when
expiratory flow rate is plotted against lung volume. It is helpful in quality control and in
detecting the presence of upper airway obstruction.20
5) Timed vital capacity (tVC) or FEV1: It is the fraction of vital capacity expired in
specific time. It is also called as forced expiratory volume in the first second (FEV1).19
In 2014, Jeremy D et al was the first to formulate the algorithm “A stepwise approach to
interpretation of pulmonary function tests” for the interpretation of pulmonary function test
15 FVC Maneuver :
Forced vital capacity is the most important single pulmonary function test which is measured
from TLC. FVC maneuver can be displayed in 2 different ways.
1. Spirogram display
2. Flow volume loop display.21
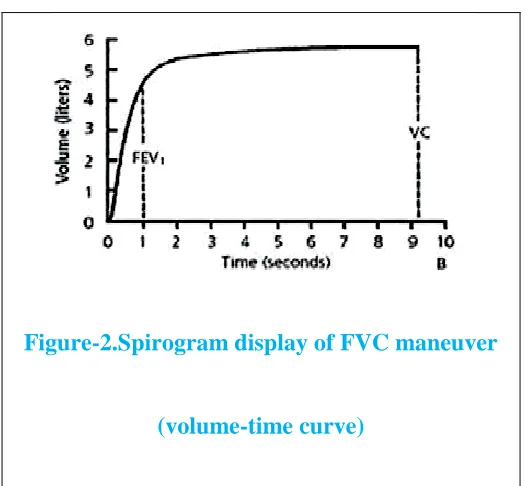
1).Spirogram display or (volume /time curve):
The traditional way of evaluating FVC maneuver is by using the graph that shows the
volume change against time. The instantaneous airflow at any time on this plot can be
estimated from the steepness (rate of change or slope) of volume change with time21. It
[image:32.612.197.460.408.651.2]provides 4 important results.
Figure-2.Spirogram display of FVC maneuver
16
1. Forced vital capacity(FVC)
2. Forced expiratory volume in 1 second(FEV1)
3. Ratio of FEV1 TO FVC (FEV1/FVC)
4. Maximal Mid Expiratory Flow or FEF25-75(MMEF)21.
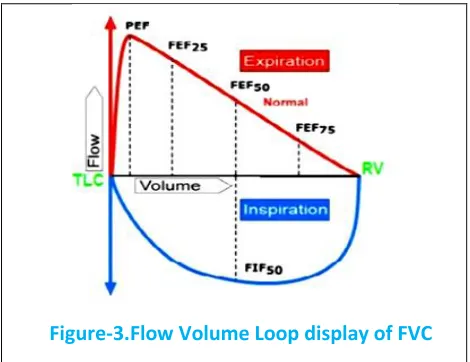
2).Flow volume loop:
The FVC maneuver can be displayed as flow volume loop in which the instantaneous flow rate is
plotted against volume. It records instantaneous flow during both expiration ( expiratory flow
volume curve) and inspiration (inspiratory flow volume curve) .The subject is asked to perform
normal tidal breathing, then the subject is asked to take maximum inspiration to TLC & exhale
[image:33.612.189.424.416.597.2]rapidly & forcefully until he can exhale maximum to RV.
17
Flow rate curve above horizontal line are expiratory and below the horizontal line are
inspiratory. The point on the Flow volume loop at which maximum inspiration occurred is TLC
& maximum exhalation occurred is RV.21
Expiratory Flow Volume Curve:
Expiratory Flow Volume Curve is divided into quarters .It gives 4 important result such as
1. PEFR is the greatest flow achieved during FVC maneuver.
2. The instantaneous flow rate at which 50 % of VC remains to be exhaled is called as
FEF50 or Vmax 50.
3. The flow rate at which 75 % of VC exhaled is called as FEF75 or Vmax 75.
4. The flow rate at which 25 % of VC exhaled is called as FEF25 or
Vmax25.21
Type of Pulmonary defects :
The maximal flow volume curve is used as a diagnostic tool to distinguish 2 major classes of
pulmonary diseases
(1).Obstructive disease are those disease that interfere with airflow
(2).Restrictive disease are those that restrict the expansion of the lung.22
(1). Obstructive pulmonary defect :
An obstructive ventilator defect is a disproportionate reduction in the maximal airflow from the
18
obstructive diseases which are associated with high lung volumes.22 It is because this high lung
volumes increases the alveolar elastic recoil pressures.22 The most important feature of flow
volume curve is the slowing in the terminal portion of the spirogram without affecting initial part
of spirogram.It is the ealiest change of obstruction which is due to airflow obstruction in the
smaller airways.This slowing of expiratory flow is reflected as concave shape in the effort
independent portion of the flow volume loop.It reflects a greater reduction after 75% of VC is
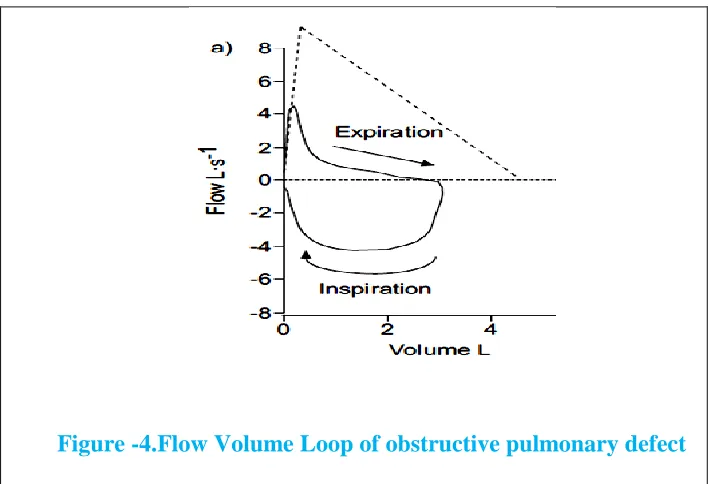
[image:35.612.101.461.272.514.2]exhaled (FEF75) or mean expiratory flow between 25% & 75% of FVC.31
Figure -4.Flow Volume Loop of obstructive pulmonary defect
Figure 4 shows typical obstructive pulmonary defects with normal total lung capacity (TLC)
101% and reduced expiratory flow with FEV1 38%; FEV1/VC 46%; peak expiratory flow
(PEF) 48%.In this obstructive pulmonary defect TLC remains normal & the flow are less than
expected over the entire volume range.31
Obstructive pulmonary defect can be diagnosed based on the criteria:
19
2) A decrease in flow at low lung volume is not specific for small airway disease in
individual patients.
3) A concomitant disease in FEV1 & VC is caused due to poor effort, but rarely reflects
airflow obstruction. Measurement of lung volumes confirms the airway obstruction.
4) Measurement of absolute lung volumes assists in the diagnosis of emphysema,
bronchial asthma & chronic bronchitis. It is also useful in assessing lung
hyperinflation.
5) Measurement of airflow resistance is useful for patients who are not able to perform
spirometric manoeuvres.31
Central and Upper Airway Obstruction :
Flow volume curves are useful in assessing obstruction of the upper airways & trachea.22 The
effect of Central and Upper Airway Obstruction on the Flow volume loop depends on whether
the obstruction is within the thoraxic cavity (intra thoraxic) or outside the thoraxic cavity (extra
thoraxic) and whether it is fixed or variable.32 The central & upper airway obstructions occurs in
both extra thoraxic airway ( pharynx, larynx and extra thoraxic portion of the trachea) and intra
thoraxic airway ( intra thoraxic trachea & bronchi).31 Depends upon the type & location of the
pathology, there are 3 pattern of abnormalities in the flow volume loop.32
Central & Upper Airway Obstruction
Variable upper airway Obstructions
Variable Intrathoraxic Obstruction
Variable Extrathoraxic Obstruction
20
During forced inspiration, intra-airway pressure is lower than atmospheric pressure, and pleural
pressure is lower than both airway & atmospheric pressure. But during forced expiration,
intra-airway pressure is higher than atmospheric pressure, and pleural pressure is greater than both
airway & atmospheric pressure.32
1). Fixed Upper Airway Obstruction :
Fixed Upper airway obstruction is seen in goiters, endotracheal neoplasm, stenosis of main
bronchi and post intubation tracheal stenosis24. Fixed obstruction will limit both inspiratory &
expiratory air flow22, whether it is in chest or upper airway. Flow volume loop will appear
similar in both cases.32
Figure -5. Fixed upper airway obstructions
Figure-5 shows the Fixed upper airway obstructions which demonstrates plateaus of air flow
during both forced inspiration & forced expiration with reduced peak inspiratory & expiratory
21 2) .Variable Upper Airway Obstruction :
Variable upper airway obstruction is seen in tracheomalacia. Flexible or floppy segments in
trachea will either widen or narrow in response to the relative pressure difference between the
airway lumen & surrounding tissue .This results in the generation of either variable intra thoraxic
or extra thoraxic obstruction depending on the location of the obstruction31.Variable upper
airway obstructions causes changes in the cross sectional area of obstruction due to changes in
the transmural pressure gradient caused by both inspiratory and expiratory effort.22
2 .(a).Variable Intra thoraxic Upper Airway Obstruction :
Variable intra thoraxic obstructions is seen in tumors of lower trachea & main bronchus,
tracheomalacia & airway changes associated with polychrondritis.It shows the reduction of
airflow during forced expirations with preservation of a normal inspiratory flow configuration.
This expiratory airflow reduction is due to narrowing of the airway inside the thorax, secondary
to extra luminal pressures exceeding intra luminal pressures during expiration.24
22
Figure-6 shows a variable intra thoraxic obstruction which demonstrates the plateau over the
expiratory flow limb of the flow volume curve.24
2.(b).Variable Extra thoraxic Upper Airway Obstructions :
Variable extra thoraxic obstructions is seen in unilateral & bilateral vocal cord paralysis, vocal
adhesion & constrictions, laryngeal edema and upper airway obstruction associated with sleep
apnea .It demonstrate the reduction of inspired flow during forced inspirations with preservation
of expiratory flow configuration. The major cause of the reduced flow during inspiration is
airway narrowing, secondary to extra luminal pressures exceeding intra luminal pressures during
[image:39.612.77.538.358.575.2]inspiration.24
Figure -7 .Variable Extra thoraxic upper airway obstructions
Figure-7 shows the variable extra thoraxic obstruction which demonstrates the plateau over the
23 (b). Restrictive pulmonary defect :
Restrictive pulmonary defect is characterized by reduction in FVC & TLC with normal or
increased FEV1/FVC ratio. The expiratory flow shows a normal or convex shape in the effort
[image:40.612.112.514.192.406.2]independent portion of the flow volume loop.31
Figure-8. Flow Volume Loop of restrictive pulmonary defects
Figure-8 shows typical restrictive defect with reduced FEV1 66% and TLC 62%. The FEV1/VC
remains increased with 80% and PEF 79%.In this restrictive pulmonary defect TLC is reduced
and the flow is higher than expected at a given lung volume.31
Restrictive pulmonary defect can be diagnosed based on the criteria:
TLC<5th percentileof predicted
A reduced VC does not prove a restrictive pulmonary defect. It may be suggestive of lung restriction when FEV1/VC is normal or increased.
24
Figure-9.spirometry pattern of obstructive & restrictive lung disease.
Figure -9 shows the volume-time tracing of the patient with airways obstruction takes 19.5
seconds to expel out the entire vital capacity, whereas the patient with restrictive disease
expels his entire vital capacity in little more than 1 second.32
[image:41.612.150.494.431.636.2](c).Mixed pulmonary defect:
25
Figure-10 shows typical mixed defect characterized by a low TLC (72%) and low FEV1/VC
ratio (64%) with FEV1 64% & PEF 82%.32
Mixed pulmonary defect can be diagnosed when FEV1/VC & TLC <5th percentile or predicted
[image:42.612.114.497.184.506.2]value.32
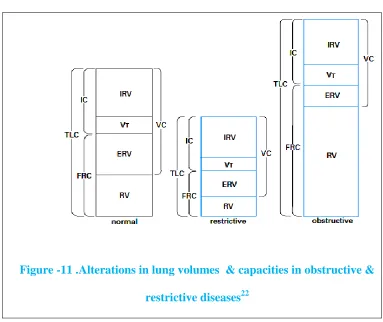
Figure -11 .Alterations in lung volumes & capacities in obstructive &
restrictive diseases22
Figure-11 shows that TLC & FRC is decreased in restrictive lung disease, while it is increased in
obstructive lung disease.
Interpretations of pulmonary function test:
The first & foremost step in the performance & interpretation of spirometry is the issue of test of
accuracy & quality.32 PFT interpretations should be clear, concise and informative. The clinical
decision is made based on the interpretation of the results of PFTs which depends on the
26
1. Estimating the pre & post-test probability of disease
2. Quality of the test results,
3. Eliminating false-positive and false-negative interpretation,
4. Based on the test results themselves and comparison with reference values.31
The VC, FEV1, FEV1/VC ratio & TLC are the basic parameters used to properly interpret lung
functions.31In 2012, the Global Lung Initiation (GLI) {task force of European Respiratory
Society} provide a normative values for males and female over 3-95 yrs age group .The
recommended practice for identifying a spirometric abnormality is to use lower limit of normal
which is based on the individual‟s sex, age, height and ethnicity. The reference equation for
lower limit of normal is derived from a population study, which is the mean predicted value
(based on pt‟s sex, age height) minus 1.64 times the standard error of the population study. In
normal spirometry FVC, FEV1& FEV1/FVC ratios are above the lower limit of normal.24
The ATS recommended the use of lower limit of normal (LLN) for FVC & FEV1 which
is 80% of predicted value as a cut off for adults.24 Both Goble Lung Initiation (GLI) and Third
National Health and Nutrition Examination Survey (NHANES) provide separate lower limit of
normal (LLN) for spirometric parameters. GOLD criteria use lower limit of normal (LLN) for
diagnosing pulmonary defect < 70% of predicted value as a cut off for adults for diagnosing
pulmonary defect.30 According to Third National Health and Nutrition Examination Survey
27
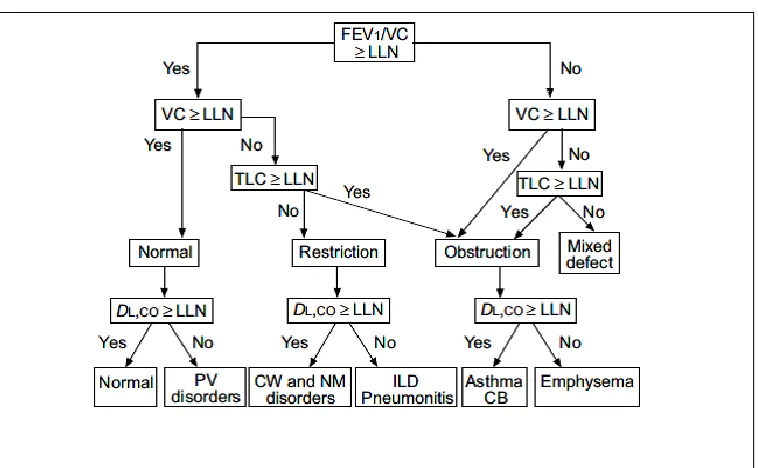
Figure-12. Simplified algorithm to assess the pulmonary functions32
Figure -12 is the simplified algorithm used to assess lung function in clinical practice. It presents
classic patterns for various pulmonary disorders.
Step-1: The first step in interpretation of pulmonary function test is to determine forced
expiratory volume in one second
(FEV1)/ VC ratio ≥ LLN or not .Then consider FVC, if FVC ≥ LLN then it is normal.
If not then check TLC.
Step-2: Total lung capacities (TLC) are or exclude the presence of a restrictive defect when VC
is below the LLN.
Step-3: The measurement of diffusing capacity for carbon monoxide (DLCO) with the predicted
value adjusted for hemoglobin is also included in this algorithm. In the mixed
Pulmonary defect group, the DLCO patterns is same for both restriction and
28 Disadvantages of this chart:
This flow chart is not suitable for assessing the severity of upper airway obstruction, any
abnormality in pulmonary vasculature (PV),chest wall(CW)& neuromuscular(NM) disorders ,
interstitial lung diseases(IL), chronic bronchitis(CB).31
Methods of assessing obesity:
The stature (Height), body weight & built of an individual could influence the pulmonary
function. Various methods are present for assessing obesity like waist circumference, waist to
hip ratio, body mass index, skin fold thickness.
(1).Body Mass Index:
BMI assessment is a powerful tool for categorizing individual‟s weight in health &
disease. BMI measures the adiposity & body composition among adults & children.3 It is an
index of weight for height for categorizing overweight and obesity in adults.33 It is commonly
used to assess body fatness and it is called as “Quetelet Index”. It is accepted as practical tools
to define and screen overweight or obesity by the international task force on obesity.3 BMI is a
global measure of body mass that includes both fat and lean mass and takes no account of
differences in fat distribution.34 The lung volume reduces as the BMI increases which is due to a
direct mechanical effect on lung volumes. The distribution of body fat can also modify the
29
Table -1. The International Classification of adult Underweight, Overweight and Obesity
according to BMI.35
Classification
BMI(kg/m2)
Principal cut-off points Additional cut-off points
Underweight <18.50 <18.50
Severe thinness <16.00 <16.00
Moderate thinness 16.00 - 16.99 16.00 - 16.99
Mild thinness 17.00 - 18.49 17.00 - 18.49
Normal range 18.50 - 24.99 18.50 - 22.99
23.00 - 24.99
Overweight ≥25.00 ≥25.00
Pre-obese 25.00 - 29.99 25.00 - 27.49
27.50 - 29.99
Obese ≥30.00 ≥30.00
Obese class I 30.00 - 34.99 30.00 - 32.49
32.50 - 34.99
Obese class II 35.00 - 39.99 35.00 - 37.49
37.50 - 39.99
30
(2).Waist Circumference:
Waist circumference is one of the predictor of obesity for abdominal & non abdominal
fat. WC is a more convenient measure than WHR and is less likely to be influenced by sex or
degree of obesity. WC is a better correlate & is an indicator of visceral obesity than BMI2.
Respiratory function is determined by interaction of lungs , chest wall & muscles function. Fat in
the abdomen & thorax has direct effect on the downward movement of the diaphragm & chest
wall properties where as fat in the hip & thigh doesn‟t have any direct mechanical effect on the
lungs.29,36
Thus truncal obesity causes restriction of outward movement of abdominal muscle wall.
The mechanical effects of the intra abdominal pressure on the diaphragm are the main reason for
the association of central obesity and compromised lung. WC showed a consistently association
with pulmonary function across the BMI categories.36
(3) .Waist To Hip Ratio:
Waist-hip ratio is the ratio of Waist Circumference and Hip Circumference and is the
measure of central pattern of fat distribution37.Increase in waist–Hip circumference are indicators of abdominal fat deposition16,36, which can lead to deterioration of lung functions in both mildly
& morbidly obese individuals . This is because of the limited diaphragm descent & lung
expansion16. Waist to hip ratio (WHR) is highly correlated with abdominal fat mass and is often
used as a surrogate marker for abdominal or upper body obesity. The predicted normal WHR in
men is 0.93 and in women it is 0.83.38
According to Anuradha R.Joshi et al , the amount of body fat and central pattern of fat
31
diaphragm and chest wall causes changes in compliance and in the work of breathing and the
elastic recoil.38
(4). Skin Fold Thickness:
Body fat percentage measurements is an excellent to good internal consistency and
greater reliability for male subjects when compared with female counterparts.33 The body fat
percentage was estimated by using the method of Durnin and Womersley et al. Skin fold
measurement is widely used body composition testing method for assessing body fat percentage.
A skin fold caliper is used to measure the skin fold thickness at 4 different sites on the left side of
the body. Extremity skin folds are measured at the triceps and biceps and trunk skin folds were
measured at the supra iliac and sub scapular areas. The skin fold was picked up between the
thumb and the forefinger and 3 consecutive readings are taken at each site 5 seconds after
applying caliper. The average of the three readings at each site is calculated.38 Abdominal &
thorax have direct mechanical effect on lung where fat in the hip & thigh doesn‟t have any direct
mechanical effect. Abdominal fat measurement using waist circumference, waist-to-hip ratio,
abdominal height and thoraxic or upper body fat measurement using sub scapular skin fold
thickness, biceps skin fold thickness are associated with reduced lung volumes in obese
individual. 29,34
Systemic complication related to obesity:
Metabolic and structural changes caused by overweight makes the obese individual more
susceptible to various diseases like cardiovascular diseases, metabolic disorders, pulmonary renal
and biliary diseases, obstructive sleep apnea and some types of neoplasm.17
32
Adipose tissue is an energy storage endocrine organ which is composed of adipocytes,
fibroblasts, endothelial cells and immune cells. These cells secrete hormones and cytokines
(adipokines) that exert endocrine, paracrine, and autocrine functions. These adipokines induce
the production of reactive oxygen species (ROS), which trigger oxidative stress which in turn
leads to increased production of other adipokines. During this process oxygen free radicals are
produced by the immune cells which promotes a systemic pro inflammatory state.39 These pro
inflammatory cytokines is associated with hypoplasia of the lungs, atopy, bronchial
responsiveness and increased risk of asthma in obese individual.17 It also contributes to systemic
inflammation in COPD & asthma.40
Obesity and lung function :
Obesity affects various resting respiratory physiologic parameters such as spirometric measures,
lung volumes, lung compliance, work of breathing, neuromuscular strength, respiratory
33
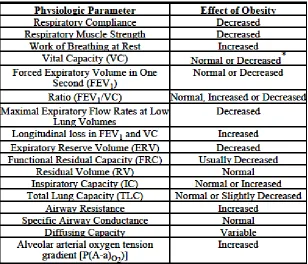
Table-2 Effects of obesity on physiologic parameters
(1). Obesity & Impaired Respiratory Mechanism:
In obese individuals, the mechanism of the contraction of diaphragm pushing the
abdominal contents down and forward & contraction of the external intercostals muscles pulling
the ribs upward and forward is impaired. This is due to deposition of excess body fat surrounding
the chest and the abdomen which limits the action of the respiratory muscles. These structural
changes in the thoraxic-abdominal area restrict diaphragmatic mobility and rib movement, which
causes changes in the dynamics of the respiratory system and reduces its compliance, leading to
mechanical impairment of the respiratory muscles.39
(2).Obesity & alteration in dynamic respiratory mechanics
Reduction in resting expiratory reserve volume (ERV) & end expiratory lung volume
(EELV) forces the obese subjects to breathe close to residual volume. This will limit the
34
obese individual due to increase in ventilation. This causes false normalization of EELV
allowing near normal tidal volume.40
Figure -13.Comparison of Flow–Volume Loops in obese and normal-weight women
Figure -13 shows Tidal flow–volume loops at rest, ventilatory threshold, and peak
exercise plotted within the respective maximal flow–volume loops in typical obese and
normal-weight women .In normal normal-weight female there is an increase in tidal volume by encroaching on
the inspiratory reserve volume with little change in end-expiratory lung volume. But in obese
female there is a significant limitation of tidal expiratory flow at rest and a large increase in
dynamic end-expiratory lung volume (EELV) occur during peak exercise.40
(3).Obesity & Reduction in lung compliance:
Obesity is characterized by a stiffening of the total respiratory system due to combination
of effect on lung & chest wall compliance. In obese individual, the most important PFT change is
decrease in the lung compliance. It is due to increased weight of chest wall & higher position of
diaphragm in the thoraxic cavity resulting in decreased lung function which subsequently leads
35
Other factors which cause reduction in the lung compliance are
increased pulmonary blood volume ,
closure of dependent airway,
formation of small areas of atelectasis ,
Increased alveolar surface tension due to reduction in FRC.29,34
(4). Obesity & reduction in lung volumes:
Fat deposition in obsess individual alter the pulmonary functions such as reduction in Functional
Residual Capacity (FRC), Expiratory Reserve Volume (ERV) and Total Lung Capacities
(TLC).39
1 The FRC is reduced in obesity which reflects a shift in the balance of inflationary & deflationary pressures on the lung due to mass load of adipose tissue around the rib cage
& abdomen in the visceral cavity.34, 39 This elevates the intra-abdominal pressure which is
transmitted to the chest. This reduces FRC and ERV and requires patients to breathe in a
less efficient part of their pressure-volume curve, which in turn increases the work of
breathing.39
2 ERV is reduced in obesity due to deposition of fat in the thoraxic-abdominal region. It is the most common & consistent indicator of obesity.39 Reduction in ERV leads to
abnormalities in ventilation distribution, with airway closure in the dependent zones of
the lung and inequalities in the ventilation-perfusion ratio.39
3 The TLC is reduced due to mechanical effect of the adipose tissue; this is because of reduction in the downward movement of the diaphragm and increased abdominal mass,
36
Figure -14. The effect of obesity on lung volumes
Figure 14 shows theeffect of obesity on lung volumes. Expiratory reserve volume (ERV) & FRC
(ERV+ RV) is decreased in obesity. RV is usually relatively well preserved. Tidal volume is
reduced, but Total lung capacity can be normal or slightly reduced. 41
Obesity cause decrease in the tidal volume due to increased stiffening of the
respiratory muscle system which results in the rapid & shallow pattern of breathing.37
The modulation of airway smooth muscle contractility by regular tidal stretching and
deep inspirations is unimpaired in mild to moderate obesity.31
A thorax with a large amount of subcutaneous fat over the chest may lead to a change
in the balance between the elastic recoil of chest wall & lung –chest wall
Compliance.25
Obesity generally does not cause reduction in FEV1 or FVC unless patients are massively obese.
FEV1/FVC ratio is usually preserved.54 The pattern of obesity is more significant than BMI
alone. Abdominal obesity is generally correlated with reductions in FEV1 and FVC except in
37 (5). Obesity & cost of breathing:
The oxygen required for breathing accounts for the total energy required by the
respiratory muscles to overcome respiratory mechanical factors such as airway resistance, lung
compliance, chest wall resistance, breathing inertia, antagonistic activity of respiratory muscles,
chest wall distortion, gas compressibility, and work on the abdominal viscera . Many of these
components are affected by increase in adipose tissue in & around the rib cage especially during
exercise. In lean subjects, the oxygen cost of breathing is 1.2 ml of O2/L of ventilation, but it is
three times increased (3.45 ml/L) in moderately obese subjects.43
The cost of breathing is greater in obese individual due to deposition of adipose tissues
around the chest wall41. The energy cost of breathing (WOB) is the ratio of inspiratory power of
breathing at rest to the critical inspiratory power (Wrest / Wcrit ) which reflects the oxygen
consumed by the respiratory muscle.44
(6). Obesity & Work Of Breathing:
The obese individual require more respiratory effort to overcome respiratory system
elasticity to maintain appropriate levels of ventilation .Because of low FRC & less complaint
portion of the pressure –volume curve ,obese individual require increased ventilation & high
flow to perform the MVV maneuver.
Certain studies showed that there is air trapping in obese individual which has been
confirmed by plethysmograph which shows an increase in RV to TLC ratio. Tidal breathing is
affected by expiratory flow limitations (EFL) & intrinsic positive end expiratory pressure
(PEEPi) which is increased in supine position due to increased diaphragmatic load in the supine
position.10,45 Morbid obese individual may develop tidal expiratory flow limitations (EFL) which
38
which results in the development of intrinsic positive end expiratory pressure (PEEPi). PEEPi is
the end expiratory elastic recoil pressure of the respiratory system which is due to incomplete
expiration .This may produces a threshold load on inspiratory muscles before inspiratory flow of
next breathing cycle begins. PEEPi also imposes an additional mechanical load on the inspiratory
muscles, thereby it increases the WOB.10
(7). Obesity & breathing pattern:
In 1991 Yang and Tobin introduced that the ratio of breathing frequency to tidal volume
(fR /VT) is an index in predicting weaning outcome, which is a measure of rapid shallow
breathing.46 According to Luce et al, it is assumed that for a given minute ventilation (VE),
breathing with high frequency and lower tidal volume may decrease oxygen cost of breathing.47
This combination of smaller VT & higher breathing frequency occurs when the rate of
ventilation increases .There will be an increase in ventilation and dead space (VD/VT) ratio
where rapid breathing is detrimental. (Macklem et al , Misuri et al).44
In order to avoid diaphragmatic muscle fatigue, work of breathing is optimized by
adopting a more rapid & shallow breathing pattern. The total breath time tended to be shorter
compared to healthy subjects because of the consequence of the higher breathing frequency.
Both inspiratory and expiratory times were shorter in the obese group compared with normal
group. Increase in respiratory frequency was due to a significant decrease in the expiratory time
per breath .Any alteration in the ratio of inspiratory to expiratory time (TI/TE) indicates an
alteration in central breath timing duty cycle (TI/TTOT).44
The high breathing frequency to tidal volume (fR/VT) ratio is observed in obese subjects,
which is the manifestation of respiratory muscle weakness. An increase in frequency to tidal
39
inspiratory pressure (PI/PImax) & the ratio of inspiratory time to the total time (TI/TTOT) of the
respiratory cycle.44
(8). Obesity & Respiratory muscle strength:
Due to the load imposed on the diaphragm, respiratory muscles function is impaired
with increasing obesity. Respiratory muscles dysfunction is due to increased resistance
imposed by the excess fatty tissue on the chest and abdomen, which causes mechanical
disadvantage to these muscles.48
Respiratory muscle strength can be assessed by measuring maximal inspiratory
pressure (MIP) and maximal expiratory pressure (MEP). In obese individuals, both MIP and
MEP are reduced. This reduction in MIP and MEP is due to distension of the diaphragmatic
muscles, increased respiratory effort, and ineffective muscle biomechanics caused by fat
deposition in the thoraxic and abdominal regions.49 In the supine position, the weight of the
abdomen in obese individuals causes the diaphragm to ascend into the chest, resulting in the
closure of small airways at the base of the lung and thereby generating an intrinsic positive
end-expiratory pressure that results in increased ventilatory work and consequent muscle
impairment.42,48
Evidence showed that bariatric surgery cause a significant reduction in BMI from
41.5 kg/m2 to 31.7 kg/m2which showed improvement in inspiratory (PI max) & expiratory
(PE max) respiratory muscle strength by 21% & 22% & improvement in respiratory muscle
by 13%, which is greater than FVC (9%) , FEV1(3%) , LV(7-10%) showing that weight
40 (9). Obesity & airway closure :
Mechanical properties of the airway are resistance and reactance, which are highly
dependent on lung volume. Any reduction in FRC will affect airway. Increase in Respiratory
resistance in obese indicates reduction in airway caliber throughout the tidal breathing cycle. In
obese individual, the reduction in airway caliber will cause reduction in lung volumes rather than
to airway obstruction.34
The obese individual is at increased risk of airway closure and abnormal ventilation
distribution. It is due to reduction in FRC to the extent, it approaches RV. Indicators of gas
trapping and airway closure, such as RV51and closing capacity52, are usually not increased in the
obese individual at rest. Certain studies demonstrate that when closing capacity exceeds FRC
because of low FRC cause the airway closure to occur within the tidal breaths.34
(10). Obesity & oxygenation, ventilation, perfusion & gas exchange:
Studies done using imaging techniques reveal the abnormalities of regional ventilation in
some obese individuals. In upright posture non obese individual shows the distribution of
regional ventilation greatest in the lower dependent lung zones but it is decreased in the upper
zones. This is reversed in obese individuals.34
Holley et al. found that in obese individual ventilation was preferentially distributed to
the upper zones of the lungs, leaving the lower dependent zones relatively under ventilated with
marked reductions in ERV to 21% of the predicted value.34,53 But according to Demedts et al the
reduction in regional ventilation in the lower zones in obese subjects is due to air trapping at the
lung bases. He suggests that limitations in chest wall and diaphragm movements alter the
configuration of the lungs and enhance basal air trapping at low lung volumes.54 The distribution
41
the normal distribution of ventilation are at risk of regional ventilation-perfusion mismatch in the
dependent zones of the lung.55
Obese patients have a normal54 or slightly reduced PaO2.56 Obesity causes a mild
widening of the A-aO2 gradient which is caused by ventilation–perfusion mismatch.43 In
sitting51& in the recumbent position57the base of the lungs of the obese individual are relatively
over perfused and under ventilated which is due to the closure of small airways in dependent
lung zones.57 This results in reduction in ERV with a relatively unchanged RV.41
(11).Obesity & exercise:
The increased metabolic requirement in obesity needs additional energy to move heavier
body parts during exercise .This reduces the mechanical efficiency of peripheral muscle &
increase in WOB & VO2.58 Any abnormality of A-aO2 gradient, and PaO2 are improved during
exercise.59 Augmented tidal volumes help to open the closed, dependent lung units, which are the
primary cause of the increased A-aO2 gradient.42 In addition to having a lower A-aO2 gradient,
obese patients augment their oxygen intake by increasing their tidal volumes and respiratory
rates during exercise, similar to normal weight subject. They augment their minute ventilation
more than normal-weight subjects by burning more oxygen. This is mainly through a higher
respiratory rate because their tidal volumes are not generally greater.41,60 It is due to central
breath timing, but some studies relates it to body fat distribution leading to impaired
diaphragmatic excursion, which causes an inability to augment exercise tidal volumes any
42
(12). Obesity & Impaired Upper Airway Mechanics :
As obesity progresses, sleep apnea develops nocturnal disturbances in sleep & gas
exchange which can trigger further elevation in oxidative stress, inflammatory cytokines &
humoral factors ,which aggravating pharyngeal neuromuscular dysfunction.61
Upper airway obstruction during sleep can result from alterations in either passive
mechanical pharyngeal properties or disturbances neuromuscular control. Fatty deposits around
the neck and pharyngeal lumen may increase upper airway collapsibility.60,62 In addition, central
adiposity impose mechanical loads on the upper airway which reduces lung volume62 and
predisposes to upper airway collapse and increases sleep apnea severity.63 This is a major risk
factors for increased upper airway resistance & collapsibility.10
According to Kirkness et al (2008) Passive Pcrit had a predictive power of 0.73 (95% CI:
0.65– 0.82) in predicting sleep apnea status.64
(13). Neuro hormonal Influences:
Stimulation of the reticular activating system facilitates breathing. Sustained
nocturnal hypoxemia increases the arousal threshold ,which impair the normal defense
mechanism that operate to minimize the insult of abnormal breathing & gas exchange during
sleep.10 Obesity is associated with an important hormone leptin which is a marker of
systemic & vascular inflammation.25 The presence of circulating leptins in obesity are found
to increase the ventilation to compensate for work & vco2 resulting in low respiratory drive65