Total Group
Profile
Report
Included in this Report
SAT Reasoning Test™ Data
SAT Subject Tests™ Data
Demographic and Academic Information
College Plans
© 2006 The College Board. All rights reserved. College Board, SAT, and the acorn logo are registered trademarks of the College Board. connect to college success, SAT Reasoning Test, and SAT Subject Tests are trademarks owned by the College Board. PSAT/NMSQT is a
The SAT Program
®
The SAT Reasoning Test™ (formerly known as the SAT® I:
Reasoning Test)
assesses student reasoning based on knowledge
and skills developed by the students in their course work. The
SAT Subject Tests™
(formerly known as SAT II: Subject Tests)
are a series of one-hour, mostly multiple-choice tests that
measure how much students know about a particular academic
subject and how well they can apply that knowledge. Most
students also complete the optional SAT Questionnaire (formerly
known as the Student Descriptive Questionnaire) when they
register to take SAT Program tests, providing valuable contextual
information to aid in interpreting and understanding individual
and group scores.
College-Bound Seniors 2006
includes students
who tested through April 2006.
College-Bound Seniors
presents data for high school graduates in
the year 2006 who participated in the SAT Program. Students are
counted only once, no matter how often they tested, and only
their latest scores and most recent SAT Questionnaire responses
are summarized. Because the accuracy of self-reported
information has been documented and the college-bound
population is relatively stable from year to year, SAT
Questionnaire responses from these students can be considered
highly accurate. Therefore, you can use this report to:
• interpret scores of individual students within the
broader context of data aggregated across groups of
bound seniors;
• study changes over time in the characteristics of
students taking SAT tests; and
• look at year-to-year educational and demographic
changes in this population, along with changes in test
performance.
Keep in mind, however, that:
• relationships between test scores and other factors
such as educational background, gender, racial/ethnic
background, parental education, and household income are
complex and interdependent. These factors do not directly
affect test performance; rather, they are associated with
educational experiences both on tests such as the SAT
Reasoning Test and in schoolwork.
• not all students in a high school, school district, or
state take the SAT Reasoning Test. Since the population of
test-takers is self-selected, using aggregate SAT Reasoning
Test scores to compare or evaluate teachers, schools,
districts, states, or other educational units is not valid, and
the College Board strongly discourages such uses.
• interpreting SAT Reasoning Test scores for subgroups
requires unique considerations. The most significant factor to
consider in interpreting SAT Reasoning Test scores for any
group, or subgroup, of test-takers is the proportion of students
taking the test. For example, if state data are being
considered, it is appropriate to recognize that in some states
there are lower participation rates. Typically, test-takers in
these states have strong academic backgrounds and apply to
the nation's most selective colleges and scholarship programs.
For these states, it is expected that the SAT Reasoning Test
mean scores reported for students will be higher than the
national average.
Using This Report
The following terms are used throughout this report. For more
statistical information, visit the College Board Web site at
www.collegeboard.com.
Mean
The
mean
is the arithmetic average.
Percentile
The
percentile
, also called the percentile point, is the point on the
measurement scale below which a specified percentage of scores
falls. The 25th, 50th, and 75th percentile points are often reported
for large data sets. The 50th percentile point, like the mean, gives
an idea of the performance of the typical student. Comparing the
25th to the 75th percentile point gives an idea of the range of
ability in the population.
Scaled score
A
scaled score
is a score that has been converted from the raw
score (number of questions answered correctly minus a fraction
of the incorrect answers) for reporting. The SAT Program uses the
200–800 scale.
Standard deviation (SD)
The
standard deviation
(SD) is a measure of the variability of a set
of scores. If test scores cluster tightly around the mean score, as
they do when the group tested is relatively homogeneous, the
standard deviation is smaller than it would be with a more
diverse group and a greater scatter of scores around the mean.
Statistical Definitions
The College Board:
Connecting Students to College
Success
The College Board is a not-for-profit membership association
whose mission is to connect students to college success and
opportunity. Founded in 1900, the association is composed of
more than 5,000 schools, colleges, universities, and other
educational organizations. Each year, the College Board serves
seven million students and their parents, 23,000 high schools, and
3,500 colleges through major programs and services in college
admissions, guidance, assessment, financial aid, enrollment, and
teaching and learning. Among its best-known programs are the
SAT®, the PSAT/NMSQT®, and the Advanced Placement
Program® (AP®). The College Board is committed to the
principles of excellence and equity, and that commitment is
embodied in all of its programs, services, activities, and concerns.
College-Bound Seniors, 1972–2006
1972
1973
1974
1975
1976
1977
1978
1979
1980
1981
1982
1983
1984
1985
1986
1987
1988
1989
1990
1991
1992
1993
1994
1995
1996
1997
1998
1999
2000
2001
2002
2003
2004
2005
2006
531
523
524
515
511
509
511
509
506
508
509
508
511
514
515
512
512
510
505
503
504
504
501
505
507
507
509
509
507
509
507
512
512
513
505
529
521
520
509
508
505
503
501
498
496
499
498
498
503
504
502
499
498
496
495
496
497
497
502
503
503
502
502
504
502
502
503
504
505
502
530
523
521
512
509
507
507
505
502
502
504
503
504
509
509
507
505
504
500
499
500
500
499
504
505
505
505
505
505
506
504
507
508
508
503
527
525
524
518
520
520
517
516
515
516
516
516
518
522
523
523
521
523
521
520
521
524
523
525
527
530
531
531
533
533
534
537
537
538
536
489
489
488
479
475
474
474
473
473
473
473
474
478
480
479
481
483
482
483
482
484
484
487
490
492
494
496
495
498
498
500
503
501
504
502
509
506
505
498
497
496
494
493
492
492
493
494
497
500
500
501
501
502
501
500
501
503
504
506
508
511
512
511
514
514
516
519
518
520
518
Male
Female
Total
Male
Female
Total
Year
Critical Reading
Mathematics
NOTE: For 1972–1986 a formula was applied to the original mean and standard deviation to convert the mean to the recentered scale. For 1987–1995 individual student scores were converted to the recentered scale and then the mean was recomputed. From 1996–1999, nearly all students received scores on the recentered scale. Any score on the original scale was converted to the recentered scale prior to computing the mean. From 2000–2006, all scores are reported on
-491
Male
Female
Total
Writing
-502
-497
Table of Contents
SAT Reasoning Test™
Demographic Information
Academic Information
SAT Subject Tests™
College Plans
SAT Reasoning Test Data
Table 1: Overall Mean Scores Table 2: Mean Scores by Gender
Table 3: Year in Which Seniors Last Took the SAT Reasoning Test™ Table 4: Percentiles for Total Group
Table 5: Score Distributions Table 6: Type of High School Table 7: Test-Taking Conditions
SAT Reasoning Test: Mean Scores by Gender Within Ethnicity
Table 8: Total Mean Scores by Ethnicity Table 9: Male Mean Scores by Ethnicity Table 10: Female Mean Scores by Ethnicity
SAT Reasoning Test: Student Background Information and Characteristics
Table 11: Student Background Information and Characteristics
Academic Record
Table 12: High School Rank
Table 13: High School Grade Point Average
Table 14: Average Years of Study in Six Academic Subjects Table 15: Total Years of Study in Combined Six Academic Subjects
Course-Taking Patterns
Table 16: English, Mathematics
Table 17: Natural Sciences, Social Sciences and History Table 18: Foreign and Classical Languages
Table 19: Arts and Music, Computers
SAT Subject Tests Data
Table 20: Number of Test-Takers and Tests for SAT Subject Tests™
Table 21: Mean Scores for SAT Subject Tests and for Students Who Also Took the SAT Reasoning Test
SAT Subject Tests Score Distributions
Table 22: English, History and Social Studies Table 23: Mathematics, Science
Table 24: Foreign and Classical Languages
Table 25: Foreign and Classical Languages (continued)
Intended College Major, Degree-Level Goal, Plans for Advanced Standing
Table 26: Intended College Major, Degree-Level Goal, Plans for Advanced Standing
Page 1
Page 3
Page 4
Page 5
Page 6
Page 10
Page 11
SAT Reasoning Test™ Data
Data in this report are for high school graduates in the year 2006. Information is summarized for seniors who took the SAT Reasoning Test™ at any time during their high school years through April 2006. If a student took the test more than once, the most recent score is used.
Table 1: Overall Mean Scores
Critical Reading Mathematics Writing
SAT Reasoning Test Test-Takers *
Number Mean SD Mean SD Mean SD
1,465,744 503 113 518 115 497 109 Total
Table 2: Mean Scores by Gender
Critical Reading Mathematics Writing SAT Reasoning Test Test-Takers
Number Mean SD Mean SD Mean SD
680,725 505 114 536 117 491 110 Male
785,019 502 111 502 111 502 108 Female
Table 3: Year in Which Seniors Last Took the SAT Reasoning Test
Scores are from the last administration in which seniors took the SAT Reasoning Test.Critical Reading Mathematics Writing SAT Reasoning Test Test-Takers
Number Mean SD Mean SD Mean SD
957,538 493 109 508 113 488 106 Senior
490,622 522 117 536 117 518 113 Junior
15,442 522 124 547 123 Sophomore
2,142 519 126 543 129
Freshman
1,465,744 503 113 518 115 497 109 Total
*Writing data are based on students who took the current version of the SAT Reasoning Test, first administered in March 2005. Of the 1,465,744 students in this report, 1,376,745 students have scores on the SAT writing section.
2006 College-Bound Seniors
TOTAL GROUP
SAT Reasoning Test Data
Table 4: Percentiles for Total Group
A percentile represents the point below which a percentage of scores fall. Comparing the 25th percentile point to the 75th percentile point gives an idea of the range of performance in a group.
SAT Reasoning Test Total Group
Critical Reading
Percentile Mathematics Writing
75th 580 600 570
50th 500 520 490
25th 430 440 420
Table 5: Score Distributions
SAT Reasoning Test Critical Reading Mathematics Writing
Male Female Total
Score Range Male Female Total Male Female Total
750–800 12,419 13,525 25,944 22,687 10,113 32,800 7,231 10,279 17,510 700–749 20,757 22,292 43,049 39,381 23,578 62,959 16,347 21,501 37,848 650–699 43,715 46,754 90,469 65,499 48,159 113,658 33,141 43,581 76,722 600–649 74,601 80,315 154,916 90,091 79,124 169,215 55,906 71,997 127,903 550–599 92,883 103,773 196,656 101,217 105,806 207,023 81,219 102,966 184,185 500–549 118,255 136,472 254,727 112,100 135,582 247,682 106,356 130,403 236,759 450–499 112,596 135,583 248,179 95,654 134,359 230,013 111,690 130,284 241,974 400–449 93,538 115,127 208,665 75,366 117,475 192,841 99,670 109,625 209,295 350–399 59,715 74,176 133,891 44,229 74,068 118,297 70,998 71,655 142,653 300–349 31,259 35,917 67,176 20,026 33,941 53,967 34,699 31,829 66,528 250–299 12,781 13,129 25,910 9,103 14,983 24,086 13,114 10,949 24,063 200–249 8,206 7,956 16,162 5,372 7,831 13,203 6,271 5,034 11,305
Table 6: Type of High School
Percent by Gender Mean Scores SAT Reasoning Test Test-Takers
Number Pct Male Female Critical Reading Mathematics Writing
1,118,762 83 45 55 500 514 492
Public
149,805 11 49 51 531 529 528
Religiously Affiliated
73,619 5 52 48 544 573 550
Independent
123,558 Other or Unknown
Table 7: Test-Taking Conditions
Critical Reading Mathematics Writing SAT Reasoning Test Test-Takers
Number Pct Mean SD Mean SD Mean SD
Standard Conditions 1,440,748 98 504 112 518 115 497 109 Nonstandard Conditions 24,996 2 483 117 491 127 474 115
NOTE: Percentiles are reported when there are 20 or more test-takers.
Demographic Information
SAT Reasoning Test: Mean Scores by Gender Within Ethnicity
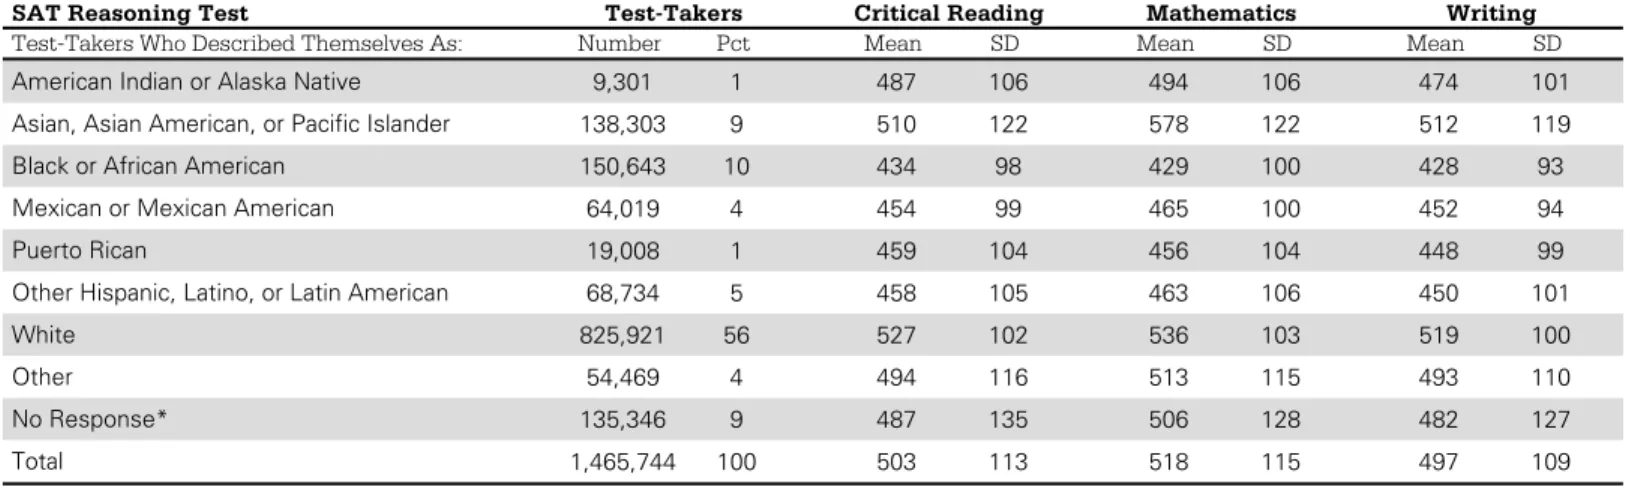
Table 8: Total Mean Scores by Ethnicity
Critical Reading Mathematics Writing SAT Reasoning Test Test-Takers
Number Pct Mean SD Mean SD Mean SD
Test-Takers Who Described Themselves As:
9,301 1 487 106 494 106 474 101 American Indian or Alaska Native
138,303 9 510 122 578 122 512 119 Asian, Asian American, or Pacific Islander
150,643 10 434 98 429 100 428 93 Black or African American
64,019 4 454 99 465 100 452 94 Mexican or Mexican American
19,008 1 459 104 456 104 448 99 Puerto Rican
68,734 5 458 105 463 106 450 101 Other Hispanic, Latino, or Latin American
825,921 56 527 102 536 103 519 100 White
54,469 4 494 116 513 115 493 110 Other
135,346 9 487 135 506 128 482 127 No Response*
1,465,744 100 503 113 518 115 497 109 Total
Table 9: Male Mean Scores by Ethnicity
Critical Reading Mathematics Writing SAT Reasoning Test Test-Takers
Number Pct Mean SD Mean SD Mean SD
Test-Takers Who Described Themselves As:
4,310 0 489 108 512 110 467 103 American Indian or Alaska Native
67,752 5 511 121 594 122 506 119 Asian, Asian American, or Pacific Islander
63,784 4 430 100 438 104 417 94 Black or African American
27,172 2 459 101 485 103 449 95 Mexican or Mexican American
8,276 1 462 105 472 108 443 100 Puerto Rican
29,416 2 464 106 484 109 448 102 Other Hispanic, Latino, or Latin American
387,567 26 529 103 555 104 511 101 White
23,880 2 494 118 534 117 486 111 Other
68,568 5 483 136 519 130 472 127 No Response*
680,725 46 505 114 536 117 491 110 Total
Table 10: Female Mean Scores by Ethnicity
Critical Reading Mathematics Writing SAT Reasoning Test Test-Takers
Number Pct Mean SD Mean SD Mean SD
Test-Takers Who Described Themselves As:
4,991 0 485 104 478 99 480 98
American Indian or Alaska Native
70,551 5 509 123 562 121 518 119 Asian, Asian American, or Pacific Islander
86,859 6 437 97 423 95 435 92
Black or African American
36,847 3 451 98 450 95 454 93
Mexican or Mexican American
10,732 1 458 103 443 100 452 98 Puerto Rican
39,318 3 454 104 448 101 452 101 Other Hispanic, Latino, or Latin American
438,354 30 526 101 520 99 525 98 White
30,589 2 494 114 497 110 498 109 Other
66,778 5 490 135 493 125 492 127 No Response*
785,019 54 502 111 502 111 502 108 Total
2006 College-Bound Seniors
TOTAL GROUP
Demographic Information
SAT Reasoning Test: Student Background Information and Characteristics
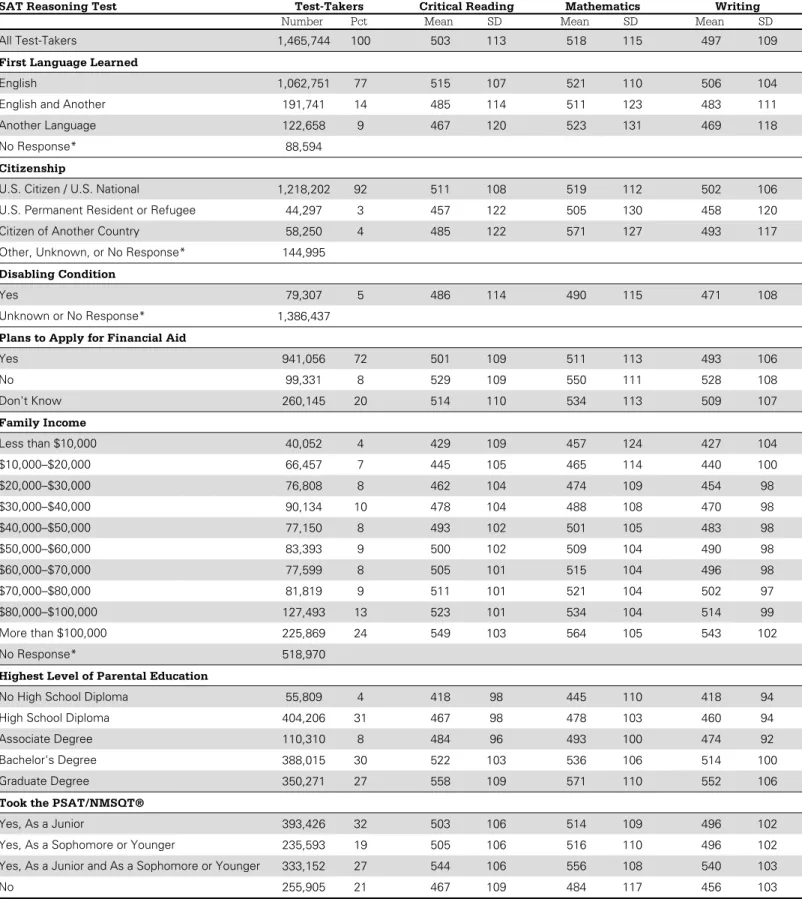
Table 11: Student Background Information and Characteristics
Student demographic information provides a broader context to aid in interpreting and understanding individual and group scores.Critical Reading Mathematics Writing SAT Reasoning Test Test-Takers
Number Pct Mean SD Mean SD Mean SD
1,465,744 503 113 518 115 497 109
All Test-Takers 100
First Language Learned
1,062,751 515 107 521 110 506 104
English 77
191,741 485 114 511 123 483 111
English and Another 14
122,658 467 120 523 131 469 118
Another Language 9
88,594 No Response*
Citizenship
1,218,202 511 108 519 112 502 106 U.S. Citizen / U.S. National 92
44,297 457 122 505 130 458 120 U.S. Permanent Resident or Refugee 3
58,250 485 122 571 127 493 117 Citizen of Another Country 4
144,995 Other, Unknown, or No Response*
Disabling Condition
79,307 486 114 490 115 471 108
Yes 5
1,386,437 Unknown or No Response*
Plans to Apply for Financial Aid
941,056 501 109 511 113 493 106
Yes 72
99,331 529 109 550 111 528 108
No 8
260,145 514 110 534 113 509 107
Don't Know 20
Family Income
40,052 429 109 457 124 427 104
Less than $10,000 4
66,457 445 105 465 114 440 100
$10,000–$20,000 7
76,808 462 104 474 109 454 98
$20,000–$30,000 8
90,134 478 104 488 108 470 98
$30,000–$40,000 10
77,150 493 102 501 105 483 98
$40,000–$50,000 8
83,393 500 102 509 104 490 98
$50,000–$60,000 9
77,599 505 101 515 104 496 98
$60,000–$70,000 8
81,819 511 101 521 104 502 97
$70,000–$80,000 9
127,493 523 101 534 104 514 99
$80,000–$100,000 13
225,869 549 103 564 105 543 102
More than $100,000 24
518,970 No Response*
Highest Level of Parental Education
55,809 418 98 445 110 418 94
No High School Diploma 4
404,206 467 98 478 103 460 94
High School Diploma 31
110,310 484 96 493 100 474 92
Associate Degree 8
388,015 522 103 536 106 514 100
Bachelor's Degree 30
350,271 558 109 571 110 552 106
Graduate Degree 27
Took the PSAT/NMSQT®
393,426 503 106 514 109 496 102
Yes, As a Junior 32
235,593 505 106 516 110 496 102 Yes, As a Sophomore or Younger 19
333,152 544 106 556 108 540 103 Yes, As a Junior and As a Sophomore or Younger 27
255,905 467 109 484 117 456 103
No 21
*'No Response' indicates that students did not answer that question, did not complete the SAT Questionnaire, or stated that they did not wish to answer that question on their SAT Questionnaire.
Academic Information
Academic Record
Table 12: High School Rank
Percent by Gender Mean Scores SAT Reasoning Test Test-Takers
Number Pct Male Female Critical Reading Mathematics Writing
234,527 31 43 57 580 604 577
Top Tenth
189,978 25 45 55 516 537 511
Second Tenth
151,724 20 49 51 484 498 476
Second Fifth
171,703 23 50 50 443 449 435
Final Three Fifths
717,812 No Response*
Table 13: High School Grade Point Average
Percent by Gender Mean Scores SAT Reasoning Test Test-Takers
Number Pct Male Female Critical Reading Mathematics Writing
90,166 7 39 61 602 621 599
A+ (97–100)
244,651 18 38 62 563 582 559
A (93–96)
246,389 18 42 58 534 552 529
A- (90–92)
609,586 46 48 52 479 489 471
B (80–89)
142,921 11 59 41 426 428 414
C (70–79)
4,281 0 62 38 406 413 389
D, E, or F (below 70)
127,750 No Response*
Mean Grade Point Average All Students: 3.33 Male: 3.24 Female: 3.40
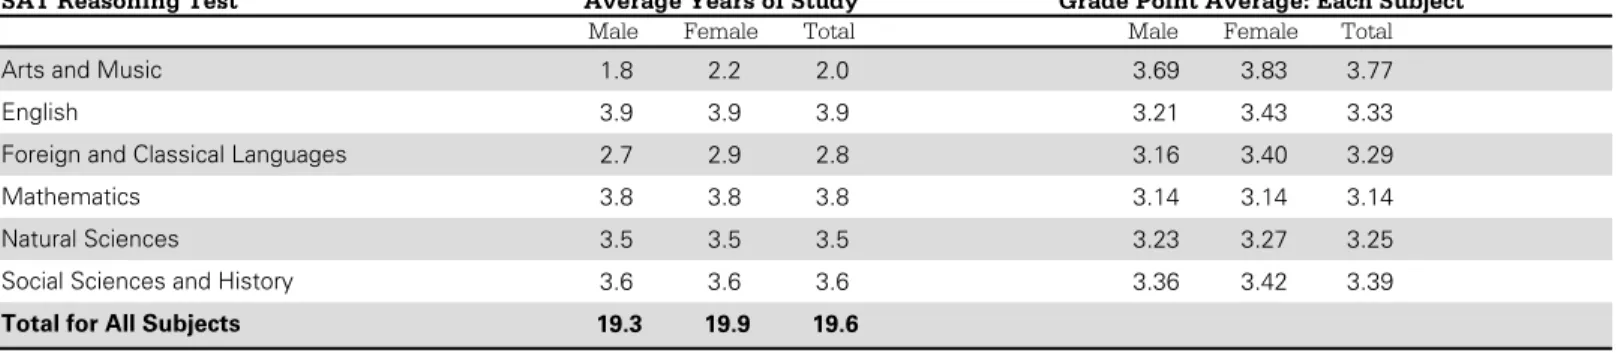
Table 14: Average Years of Study in Six Academic Subjects
Grade Point Average: Each Subject SAT Reasoning Test Average Years of Study
Male Female Total Male Female Total
1.8 2.2 2.0 3.69 3.83 3.77 Arts and Music
3.9 3.9 3.9 3.21 3.43 3.33 English
2.7 2.9 2.8 3.16 3.40 3.29 Foreign and Classical Languages
3.8 3.8 3.8 3.14 3.14 3.14 Mathematics
3.5 3.5 3.5 3.23 3.27 3.25 Natural Sciences
3.6 3.6 3.6 3.36 3.42 3.39 Social Sciences and History
Total for All Subjects 19.3 19.9 19.6
Table 15: Total Years of Study in Combined Six Academic Subjects
Total years of study is calculated by combining the number of years that students studied each of the following subjects during high school: Arts and Music, English, Foreign and Classical Languages, Mathematics, Natural Sciences, and Social Sciences and History. 'Incomplete Response' denotes the number of test-takers who did not respond to all six subjects.
Percent by Gender Mean Scores SAT Reasoning Test Test-Takers
Number Pct Male Female Critical Reading Mathematics Writing
613,292 55 42 58 542 554 535
20 or More Years
131,247 12 48 52 497 509 488
19 or 19.5 Years
113,834 10 48 52 480 491 471
18 or 18.5 Years
81,888 7 48 52 465 474 456
17 or 17.5 Years
59,871 5 48 52 456 466 447
16 or 16.5 Years
44,960 4 49 51 450 460 442
15 or 15.5 Years
78,579 7 49 51 439 457 432
Less than 15 Years
342,073 Incomplete Response
2006 College-Bound Seniors
TOTAL GROUP
Academic Information
Course-Taking Patterns
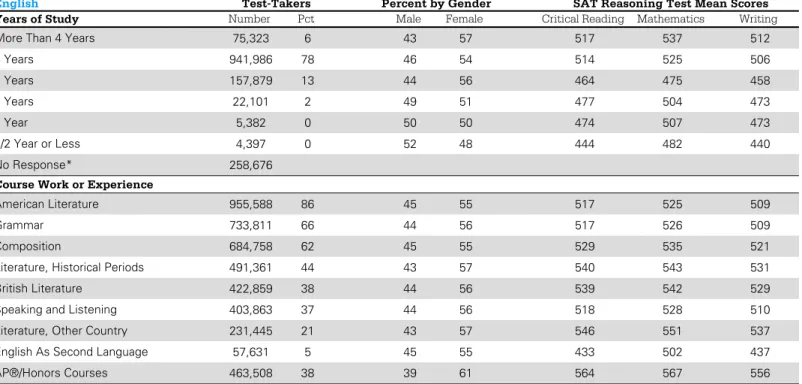
Table 16: English, Mathematics
Percent by Gender SAT Reasoning Test Mean Scores Test-Takers
English
Number Pct Male Female Critical Reading Mathematics Writing
Years of Study
75,323 6 43 57 517 537 512
More Than 4 Years
941,986 78 46 54 514 525 506
4 Years
157,879 13 44 56 464 475 458
3 Years
22,101 2 49 51 477 504 473
2 Years
5,382 0 50 50 474 507 473
1 Year
4,397 0 52 48 444 482 440
1/2 Year or Less
258,676 No Response*
Course Work or Experience
955,588 86 45 55 517 525 509
American Literature
733,811 66 44 56 517 526 509
Grammar
684,758 62 45 55 529 535 521
Composition
491,361 44 43 57 540 543 531
Literature, Historical Periods
422,859 38 44 56 539 542 529
British Literature
403,863 37 44 56 518 528 510
Speaking and Listening
231,445 21 43 57 546 551 537
Literature, Other Country
57,631 5 45 55 433 502 437
English As Second Language
463,508 38 39 61 564 567 556
AP®/Honors Courses
Percent by Gender SAT Reasoning Test Mean Scores Test-Takers
Mathematics
Number Pct Male Female Critical Reading Mathematics Writing
Years of Study
139,247 12 50 50 539 581 532
More Than 4 Years
752,172 62 46 54 516 529 509
4 Years
281,701 23 42 58 469 466 461
3 Years
28,210 2 46 54 467 471 459
2 Years
4,798 0 48 52 467 489 465
1 Year
4,140 0 50 50 442 467 440
1/2 Year or Less
255,476 No Response*
Course Work or Experience
1,159,478 96 45 55 505 517 498
Algebra
1,145,822 95 45 55 507 519 500
Geometry
554,701 46 47 53 531 553 524
Trigonometry
605,130 50 47 53 544 571 538
Precalculus
341,999 28 50 50 568 608 563
Calculus
330,093 27 44 56 499 510 491
Other Math Courses
90,321 7 59 41 509 539 500
Computer Math
377,347 31 46 54 569 599 563
AP/Honors Courses
*'No Response' indicates that students did not answer that question, did not complete the SAT Questionnaire, or stated that they did not wish to answer that question on their SAT Questionnaire.
Academic Information
Course-Taking Patterns
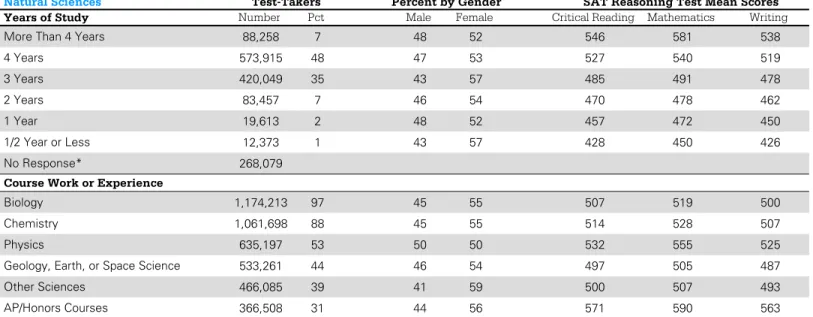
Table 17: Natural Sciences, Social Sciences and History
Percent by Gender SAT Reasoning Test Mean Scores Test-Takers
Natural Sciences
Number Pct Male Female Critical Reading Mathematics Writing
Years of Study
88,258 7 48 52 546 581 538
More Than 4 Years
573,915 48 47 53 527 540 519
4 Years
420,049 35 43 57 485 491 478
3 Years
83,457 7 46 54 470 478 462
2 Years
19,613 2 48 52 457 472 450
1 Year
12,373 1 43 57 428 450 426
1/2 Year or Less
268,079 No Response*
Course Work or Experience
1,174,213 97 45 55 507 519 500
Biology
1,061,698 88 45 55 514 528 507
Chemistry
635,197 53 50 50 532 555 525
Physics
533,261 44 46 54 497 505 487
Geology, Earth, or Space Science
466,085 39 41 59 500 507 493
Other Sciences
366,508 31 44 56 571 590 563
AP/Honors Courses
Percent by Gender SAT Reasoning Test Mean Scores Test-Takers
Social Sciences and History
Number Pct Male Female Critical Reading Mathematics Writing
Years of Study
76,972 6 45 55 535 548 526
More Than 4 Years
659,660 55 46 54 519 527 511
4 Years
369,683 31 44 56 490 504 483
3 Years
74,158 6 48 52 473 498 468
2 Years
13,479 1 48 52 462 493 457
1 Year
8,574 1 48 52 435 474 434
1/2 Year or Less
263,218 No Response*
Course Work or Experience
1,146,460 95 45 55 506 516 499
U.S. History
987,697 82 45 55 508 519 500
World History or Cultures
806,212 67 45 55 508 517 499
U.S. Government or Civics
540,749 45 45 55 506 521 498
Economics
408,088 34 45 55 494 507 487
Geography
309,949 26 35 65 522 525 514
Psychology
254,637 21 48 52 545 553 536
European History
150,053 12 38 62 505 510 497
Sociology
136,880 11 49 51 522 534 513
Ancient History
28,564 2 46 54 505 521 497
Anthropology
222,214 18 45 55 515 525 507
Other Courses
406,978 34 42 58 568 574 559
AP/Honors Courses
2006 College-Bound Seniors
TOTAL GROUP
Academic Information
Course-Taking Patterns
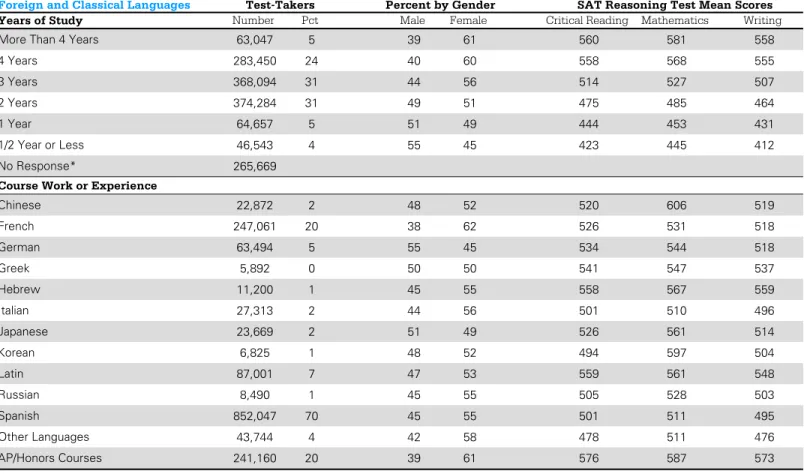
Table 18: Foreign and Classical Languages
Percent by Gender SAT Reasoning Test Mean Scores Test-Takers
Foreign and Classical Languages
Number Pct Male Female Critical Reading Mathematics Writing
Years of Study
63,047 5 39 61 560 581 558
More Than 4 Years
283,450 24 40 60 558 568 555
4 Years
368,094 31 44 56 514 527 507
3 Years
374,284 31 49 51 475 485 464
2 Years
64,657 5 51 49 444 453 431
1 Year
46,543 4 55 45 423 445 412
1/2 Year or Less
265,669 No Response*
Course Work or Experience
22,872 2 48 52 520 606 519
Chinese
247,061 20 38 62 526 531 518
French
63,494 5 55 45 534 544 518
German
5,892 0 50 50 541 547 537
Greek
11,200 1 45 55 558 567 559
Hebrew
27,313 2 44 56 501 510 496
Italian
23,669 2 51 49 526 561 514
Japanese
6,825 1 48 52 494 597 504
Korean
87,001 7 47 53 559 561 548
Latin
8,490 1 45 55 505 528 503
Russian
852,047 70 45 55 501 511 495
Spanish
43,744 4 42 58 478 511 476
Other Languages
241,160 20 39 61 576 587 573
AP/Honors Courses
*'No Response' indicates that students did not answer that question, did not complete the SAT Questionnaire, or stated that they did not wish to answer that question on their SAT Questionnaire.
Academic Information
Course-Taking Patterns
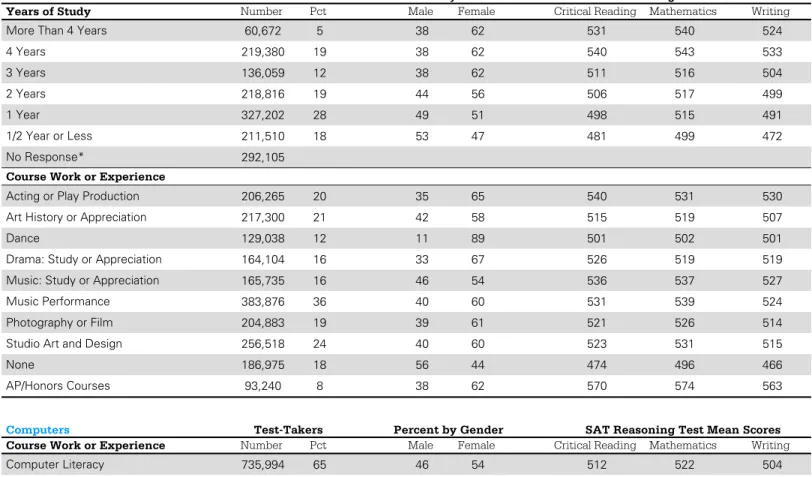
Table 19: Arts and Music, Computers
Percent by Gender SAT Reasoning Test Mean Scores Test-Takers
Arts and Music
Number Pct Male Female Critical Reading Mathematics Writing
Years of Study
60,672 5 38 62 531 540 524
More Than 4 Years
219,380 19 38 62 540 543 533
4 Years
136,059 12 38 62 511 516 504
3 Years
218,816 19 44 56 506 517 499
2 Years
327,202 28 49 51 498 515 491
1 Year
211,510 18 53 47 481 499 472
1/2 Year or Less
292,105 No Response*
Course Work or Experience
206,265 20 35 65 540 531 530
Acting or Play Production
217,300 21 42 58 515 519 507
Art History or Appreciation
129,038 12 11 89 501 502 501
Dance
164,104 16 33 67 526 519 519
Drama: Study or Appreciation
165,735 16 46 54 536 537 527
Music: Study or Appreciation
383,876 36 40 60 531 539 524
Music Performance
204,883 19 39 61 521 526 514
Photography or Film
256,518 24 40 60 523 531 515
Studio Art and Design
186,975 18 56 44 474 496 466
None
93,240 8 38 62 570 574 563
AP/Honors Courses
Percent by Gender SAT Reasoning Test Mean Scores Test-Takers
Computers
Number Pct Male Female Critical Reading Mathematics Writing
Course Work or Experience
735,994 65 46 54 512 522 504
Computer Literacy
208,959 18 59 41 509 534 500
Computer Programming
787,028 69 45 55 511 522 503
Word Processing
591,524 52 46 54 515 526 507
Internet Activity
356,211 31 51 49 515 530 506
Using Computer Graphics
419,796 37 47 53 518 533 511
Creating Spreadsheets/Databases
146,437 13 39 61 511 521 507
None
2006 College-Bound Seniors
TOTAL GROUP
SAT Subject Tests™ Data
Table 20: Number of Test-Takers and Tests for SAT Subject Tests
Students Who Took SAT Subject Tests Students Who Took an SAT Subject Test and Also Took the SAT Reasoning Test
Number of Test-Takers
Number of Tests
Number of Test-Takers
Critical Reading Mean
Mathematics Mean
Writing Mean
279,428 741,788 263,524 593 619 592
Students Who Took One or More Different SAT Subject Tests
Number of Tests Taken
Number of Test-Takers
Percent of Total Test-Takers Who Took One or More Tests
1 23,348 8
2 99,882 36
3 119,780 43
4 or More 36,418 13
Table 21: Mean Scores for SAT Subject Tests and for Students Who Also Took the SAT Reasoning Test
Most, but not all, students who take the SAT Subject Tests also take the SAT Reasoning Test. This table provides a side-by-side presentation of the two scores for those students who took both tests.SAT Reasoning Test SAT Subject Test
N Mean N
Critical Reading Mathematics Writing
SD Mean SD Mean SD Mean SD
English
20,682 620 111 20,055 625 106 652
Writing* 98 651 102
114,469 583 111 107,840 600 111 589
Literature 104 595 105
History and Social Studies
118,879 601 116 113,389 608 106 611
U.S. History 103 602 103
13,467 585 115 12,550 617 110 615
World History 106 605 107
Mathematics
109,048 593 102 101,806 580 112 613
Mathematics Level 1 99 583 107
132,809 644 105 128,029 603 111 656
Mathematics Level 2 98 604 105
Science
32,546 591 104 30,426 597 110 619
Biology-E 101 595 105
38,171 630 103 36,474 616 111 649
Biology-M 94 619 104
54,652 629 110 52,107 615 110 671
Chemistry 94 616 103
32,895 643 107 31,147 608 119 687
Physics 89 607 109
Foreign and Classical Languages
6,166 764 61 5,926 551 133 664
Chinese/Listening 94 561 126
11,761 612 119 11,368 637 99 635
French 91 641 94
3,358 621 116 3,275 638 92 626
French/Listening 88 638 87
836 610 131 794 632 97 654
German 88 636 88
1,050 596 131 1,004 630 97 643
German/Listening 89 627 88
513 628 129 492 623 98 642
Modern Hebrew 89 638 90
640 654 122 607 596 99 602
Italian 94 602 95
1,683 682 134 1,616 566 118 649
Japanese/Listening 94 574 106
3,888 754 68 3,664 533 114 655
Korean/Listening 93 557 111
3,104 613 107 3,044 672 87 670
Latin 81 669 81
32,919 634 124 31,426 577 119 586
Spanish 115 585 116
8,252 638 115 8,035 564 117 567
Spanish/Listening 113 567 114
*After the January 2005 administration, the SAT Subject Test in Writing was no longer administered because the SAT Reasoning Test now includes the writing section; 2006 is the last year for which scores for the SAT Subject Test in Writing are reported.
NOTE: The ELPT (English Language Proficiency Test) was last administered in January 2005. Please consult the 2005 College-Bound Seniors Reports for data on ELPT.
SAT Subject Tests Score Distributions
Table 22: English, History and Social Studies
SAT Subject Tests English History and Social Studies
N Pct N Pct N Pct N Pct
Writing Literature U.S. History World History
3,012 15 7,352 6 12,980 11 1,359 10 750–800
3,065 15 13,307 12 16,860 14 1,285 10 700–749
3,150 15 17,237 15 18,411 15 1,701 13 650–699
3,188 15 17,578 15 16,342 14 1,922 14 600–649
2,919 14 16,274 14 15,135 13 2,084 15 550–599
2,298 11 15,743 14 13,799 12 1,749 13 500–549
1,626 8 12,134 11 11,666 10 1,617 12 450–499
833 4 9,109 8 8,762 7 1,205 9
400–449
459 2 4,586 4 4,020 3 494 4
350–399
117 1 1,096 1 854 1 46 0
300–349
14 0 53 0 50 0 5 0
250–299
1 0 200–249
20,682 114,469 118,879 13,467 Total
620 583 601 585
Mean
111 111 116 115
SD
710 670 700 680
75th percentile
630 590 610 580
50th percentile
540 500 510 490
25th percentile
Table 23: Mathematics, Science
SAT Subject Tests Mathematics Science
Pct N Pct
N Pct
N Pct
N
Mathematics Level 1 Mathematics Level 2 Biology-E Biology-M Chemistry Physics
N Pct N Pct
4,728 4 28,997 22 1,861 6 4,626 12 9,352 17 6,517 20 750–800
14,174 13 17,232 13 3,579 11 7,072 19 8,593 16 5,293 16 700–749
19,410 18 19,381 15 5,336 16 7,157 19 8,476 16 5,701 17 650–699
20,526 19 23,268 18 6,090 19 6,521 17 8,118 15 4,989 15 600–649
16,016 15 19,019 14 5,244 16 5,150 13 6,586 12 4,050 12 550–599
14,324 13 13,434 10 4,295 13 3,282 9 5,590 10 2,768 8 500–549
9,331 9 7,880 6 2,997 9 2,182 6 4,363 8 1,935 6 450–499
6,309 6 2,545 2 1,791 6 1,203 3 2,846 5 1,429 4 400–449
3,419 3 730 1 958 3 685 2 702 1 212 1
350–399
779 1 321 0 372 1 276 1 26 0 1 0
300–349
32 0 2 0 23 0 17 0
250–299 200–249
109,048 132,809 32,546 38,171 54,652 32,895 Total
593 644 591 630 629 643
Mean
102 105 104 103 110 107
SD
670 730 670 710 720 730
75th percentile
600 640 600 640 640 650
50th percentile
520 570 520 570 550 570
2006 College-Bound Seniors
TOTAL GROUP
SAT Subject Tests Score Distributions
Table 24: Foreign and Classical Languages
SAT Subject Tests Foreign and Classical Languages
Pct N Pct
N Pct
N Pct
N
Chinese/Listening French French/Listening German German/Listening
N Pct
Modern Hebrew
N Pct
750–800 4,869 79 2,021 17 612 18 157 19 163 16 122 24 700–749 628 10 1,351 11 386 11 92 11 160 15 59 12 650–699 296 5 1,483 13 465 14 127 15 90 9 60 12 600–649 189 3 1,565 13 492 15 96 11 120 11 65 13 550–599 80 1 1,626 14 499 15 85 10 137 13 64 12 500–549 50 1 1,426 12 381 11 75 9 121 12 54 11 450–499 34 1 1,215 10 290 9 105 13 100 10 45 9
400–449 15 0 779 7 147 4 56 7 86 8 21 4
350–399 4 0 270 2 76 2 31 4 46 4 15 3
300–349 1 0 25 0 10 0 11 1 22 2 7 1
250–299 1 0 5 0 1 0
200–249
Total 6,166 11,761 3,358 836 1,050 513
Mean 764 612 621 610 596 628
SD 61 119 116 131 131 129
75th percentile 800 710 710 720 720 740
50th percentile 790 610 620 630 600 640
25th percentile 760 520 530 500 500 530
Table 25: Foreign and Classical Languages (continued)
SAT Subject Tests Foreign and Classical Languages
Pct N Pct
N Pct
N Pct
N
Spanish Spanish/Listening Italian Japanese/Listening Korean/Listening Latin
N Pct N Pct
750–800 177 28 829 49 2,870 74 423 14 7,630 23 1,836 22 700–749 107 17 194 12 431 11 405 13 5,275 16 1,391 17 650–699 111 17 130 8 260 7 437 14 4,728 14 971 12 600–649 78 12 116 7 137 4 433 14 3,703 11 1,131 14
550–599 42 7 78 5 101 3 496 16 3,171 10 979 12
500–549 42 7 111 7 52 1 413 13 2,986 9 836 10
450–499 34 5 99 6 23 1 338 11 2,466 7 600 7
400–449 24 4 58 3 11 0 143 5 1,649 5 344 4
350–399 14 2 38 2 3 0 16 1 912 3 133 2
300–349 7 1 19 1 332 1 23 0
250–299 4 1 6 0 65 0 6 0
200–249 5 0 2 0 2 0
Total 640 1,683 3,888 3,104 32,919 8,252
Mean 654 682 754 613 634 638
SD 122 134 68 107 124 115
75th percentile 750 790 800 700 740 740
50th percentile 680 740 780 610 660 650
25th percentile 590 600 740 530 540 550
College Plans
Table 26: Intended College Major, Degree-Level Goal, Plans for Advanced Standing
Mean Scores SAT Reasoning Test Test-Takers
Number Pct Critical Reading Mathematics Writing
Intended College Major
Agriculture or Natural Resources 9,814 1 481 485 469 Architecture or Environmental Design 32,084 3 488 528 485 Arts: Visual and Performing 84,828 9 516 502 507
Biological Sciences 61,048 6 540 554 532
Business and Commerce 144,294 15 486 511 481
Communications 40,297 4 522 504 520
Computer or Information Sciences 37,943 4 503 534 482
Education 80,950 8 480 484 478
Engineering and Engineering Technologies 82,383 8 519 577 506 Foreign or Classical Languages 7,207 1 572 549 563 General or Interdisciplinary Studies 4,306 0 542 532 532 Health and Allied Services 178,368 18 485 498 483
Home Economics 3,921 0 462 466 461
Language and Literature 19,493 2 597 541 584
Library and Archival Sciences 344 0 579 509 542
Mathematics 9,116 1 539 624 537
Military Sciences 5,204 1 510 521 487
Philosophy, Religion, or Theology 6,417 1 557 537 535
Physical Sciences 15,585 2 557 589 542
Public Affairs and Services 29,632 3 462 461 454 Social Sciences and History 91,477 9 539 519 525
Technical and Vocational 10,178 1 437 454 421
Undecided 26,654 3 512 530 502
Degree-Level Goal
Certificate Program 13,053 1 443 462 435
Associate Degree 15,306 1 416 420 409
Bachelor's Degree 326,252 25 477 487 469
Master's Degree 384,097 30 512 525 505
Doctoral or Related Degree 257,776 20 539 553 532
Other 6,576 1 439 456 436
Undecided 291,102 22 515 528 508
Plans for Advanced Standing in College Courses
Art 53,962 5 512 515 507
Biology 138,884 13 567 584 561
Chemistry 106,551 10 571 610 565
Computer Science 36,403 3 536 574 523
English 320,663 30 568 566 561
Foreign Languages 169,221 16 561 571 560
Humanities 32,010 3 580 570 569
Mathematics 277,398 26 562 606 558
Music 40,117 4 509 518 506
Physics 90,694 8 583 631 575
Social Studies 279,484 26 576 579 566
Areas Served by College Board Regional Offices
National Office
45 Columbus Avenue New York, NY 10023-6992 212 713-8000
212 713-8255 (Fax)
Middle States Regional Office
Two Bala Plaza, Suite 900 Bala Cynwyd, PA 19004-1501 866 392-3019
610 227-2580 (Fax)
Midwestern Regional Office
6111 N. River Road, Suite 550 Rosemont, IL 60018-5158 866 392-4086
847 653-4528 (Fax)
New England Regional Office
470 Totten Pond Road Waltham, MA 02451-1982 866 392-4089
781 663-2743 (Fax)
Southern Regional Office
3700 Crestwood Parkway NW, Suite 700 Duluth, GA 30096-7155
866 392-4088 770 225-4062 (Fax)
Southwestern Regional Office
4330 South MoPac Expressway, Suite 200 Austin, TX 78735-6735
866 392-3017 512 721-1841 (Fax)
Western Regional Office
2099 Gateway Place, Suite 550 San Jose, CA 95110-1051 866 392-4078
408 367-1459 (Fax)
Puerto Rico and Latin America Office
208 Ponce de León Avenue, Suite 1501 San Juan, PR 00918-1017
Mailing address: P.O. Box 71101
San Juan, PR 00936-8001 787 772-1200
787 759-8629 (Fax - Reception area) 787 764-4306 (Fax - Director's office)
International Education Office
1233 20th Street NW, Suite 600 Washington, DC 20036-2375 202 741-4700
202 741-4745 (Fax)
Washington Office
1233 20th Street NW, Suite 600 Washington, DC 20036-2375 202 741-4700
202 741-4743 (Fax)
Florida Office
1545 Raymond Diehl Road, Suite 250 Tallahassee, FL 32308-1500 850 521-4900
850 521-4921(Fax)
New York State Office
122 South Swan Street Albany, NY 12210-1715 518 472-1515
518 472-1516 (Fax)
Sacramento Office
915 L Street, Suite 1200 Sacramento, CA 95814-3705 916 444-6262