The Design of Local Culture-based Indonesian
Language Teaching Materials
Kartini
Universitas Negeri Makassar, Jln. Bonto Langkasa, Kampus Gunung Sari, Makassar, South Sulawesi, Indonesia
Achmad Tolla
Universitas Negeri Makassar, Jln. Bonto Langkasa, Kampus Gunung Sari, Makassar, South Sulawesi, Indonesia
Jasruddin
Universitas Negeri Makassar, Jln. Bonto Langkasa, Kampus Gunung Sari, Makassar, South Sulawesi, Indonesia
Juanda
Universitas Negeri Makassar, Jln. Bonto Langkasa, Kampus Gunung Sari, Makassar, South Sulawesi, Indonesia
Abstract—This research and development aims to test the validity and effectiveness of Indonesian Language
Teaching Materials Based on Local Culture of Luwu, South Sulawesi, Indonesia. This research and development is at level two; the researchers only conducted validity testing and effectiveness testing of existing teaching materials. Both types of testing were conducted at Cokroaminoto University of Palopo. The validity testing was done through Focus Group Discussion. The components of teaching materials of which validity are tested include content, presentation, graphics, and language use. Meanwhile, the effectiveness testing was done by employing one-group pretest-posttest pre-experimental design. The results of data analysis reveal that the Indonesian language teaching materials based on local culture of Luwu meet the standards of validity and effectiveness.
Index Terms—local culture, teaching materials, focus group discussion, design
I. INTRODUCTION
In the national education curriculum of Indonesia, Indonesian language is taught from elementary school level to university level. Referring to the Decree of the Director General of Higher Education, Ministry of National Education of the Republic of Indonesia No. 43/DIKTI/Kep/2006, Indonesia language in universities belongs to a group of personality development courses with competency standards to be mastered by students including knowledge of religion, cultural, and citizenship values, and ability to apply these values in everyday life; having a solid personality; critical thinking: being rational, ethical, aesthetic, and dynamic; being broad-minded; and being democratic. The basic competences of Indonesian language teaching in universities prepare students to become scientists and professionals who possess a positive knowledge and attitude towards the Indonesian language as the national language and who are able to use it correctly and properly to express understanding, sense of nationality, love of the homeland, and for various necessities in the fields of science, technology and art, and in their respective professions.
In relation to the competency standard of knowledge of cultural values, the Indonesian language learning should be synergistic and integrated with cultural learning as an effort to preserve and develop national and local culture. Susanto (2014) argues that the current education curriculum is oriented towards building a better image of the nation's character and the preservation of local culture. Synergy and integration between Indonesian language and cultural learning can be realized through various learning tools such as teaching materials.
Teaching materials are an important tool that must exist in a lesson. These become an indicator of the successful achievement of desired learning objectives. Therefore, teaching materials to be used must meet several requirements, two of which are validity and effectiveness. The validity testing in question is the examination of the validity of teaching materials components; content (material), presentation, graphics, and language use. Meanwhile, the effectiveness testing of teaching materials involves the use of teaching materials to determine the level of learning success provided by the teaching materials. This can be done by comparing students’ learning outcomes before and after the teaching materials are used.
II. LITERATURE REVIEW
regarding font-end analysis, such as contextual analysis. Rohmat (2011) explains that teaching materials are a set of materials designed systematically both written and unwritten so as to create an environment or atmosphere that allows learners to learn. Then, Wright (Trianto, 2009) adds that teaching materials can help achieve the goals of the syllabus and help the roles of educators and learners in the teaching and learning process. Tomlinson (1998) remarks that teaching materials are those used by lecturers or learners to facilitate language learning, improve knowledge, and enrich language experience.
The main aspects of instruction can be applied in the development process of teaching materials (Shulman, in Trianto, 2009). Furthermore, Jolly and Bolitho (Tomlinson, 1998) propose the steps of teaching materials development, namely: (1) identification of the needs of lecturers and learners; (2) determination of exploration activities of material needs; (3) contextual realization by proposing ideas appropriate to the selection of texts and the context of teaching materials; (4) pedagogical realization through task and practice; (5) production of teaching materials; (6) the use of teaching materials by learners; and (7) evaluation of the teaching materials.
Richards (2002) proposed the design of teaching materials that include: (1) development of objectives; (2) development of syllabus; (3) organization of teaching materials into instruction units; (4) development of structure per unit; and (5) units sorting (in Trianto, 2009). According to Tomlinson (1998), the development of teaching materials refers to something done by writers, teachers, lecturers, and learners to provide input resources with various experiences designed to improve language learning. The development of Indonesian teaching materials is based on the indicator of achievement of basic competencies by taking into account the potential of learners, the actual benefits for learners, the depth and breadth of materials, the relevance for the needs of learners, in accordance with the environment and available time allocation (MoNE 2007).
Good teaching materials are teaching materials that have gone through a series of validity testing processes. Good teaching materials must pass the validity testing stage of some components such as content, materials presentation, graphics, language use, and media or technology used (BSNP, 2006). The validity of a teaching material can be investigated through a process called validation. Validation is a process or activity to test whether an instrument is valid or invalid. Validation of instructional materials is measured using validation sheets. The validation sheet contains the components of the instructional material of which validity is measured. This validation sheet is filled by a competent person selected to validate the material that has been created. Akker (1999: 10) states, "Validity refers to the extent that the design of the intervention is based on the state of the art knowledge ('content validity') and that the various components of the intervention are consistently linked to each other ('construct validity')". Akker (1999: 10) remarks, "Effectiveness refers to the extent that the experiences and outcomes with the intervention are consistent with the intended aims".
III. RESEARCH METHOD
This research and development is at level two; testing existing products. Two types of testing conducted are validity testing and effectiveness testing. The validity testing was done on four components of teaching materials including content, presentation, graphics, and language use through focus group discussion involving two experts. Meanwhile, the effectiveness testing was done by employing one-group pretest-posttest pre-experimental design. The technique of data analysis used is descriptive statistical analysis.
IV. RESULTS
1. Validity Testing Results from Expert 1 a. Content
TABLE 1.
FREQUENCY DISTRIBUTION OF CONTENT VALIDITY
Interval Category Frequency Percentage
5 Very Valid 6 35.3
4 Valid 11 64.7
3 Quite Valid 0 0
2 Less Valid 0 0
1 Invalid 0 0
Total 17 100
Table 4.1 shows the results of the content validity testing that is divided into 17 points. As illustrated, 6 points are considered “very valid” and 11 other points are considered “Valid”. In other words, none of the points are considered “quite valid”, “less valid”, and “invalid”.
TABLE 2
CLASSIFICATION INTERVAL OF THE TENDENCY OF THE CONTENT VALIDITY RESULTS FROM EXPERT 1
Interval Percentage Interval Category
72 – 85 85% - 100% Very Valid
58 – 71 69% - 84% Valid
44 – 57 53% - 68% Quite Valid
30 – 43 37% - 52% Less Valid
17 – 29 20% - 36% Invalid
Based on table 2, it is seen that the score 74 is at the interval of 72-85 (85% -100%) under the category of "very valid".
b. Presentation
TABLE 3
FREQUENCY DISTRIBUTION OF PRESENTATION VALIDITY
Interval Category Frequency Percentage
5 Very Valid 5 38.5
4 Valid 8 61.5
3 Quite Valid 0 0
2 Less Valid 0 0
1 Invalid 0 0
Total 13 100
Table 3 illustrates the results of the validity testing of the presentation of the teaching materials, which is divided into 13 points. In this case, 5 points are considered "very valid" and 8 other points are considered "valid". Hence, no points are considered "quite valid", "less valid", or "invalid".
The total score of the presentation validity by expert 1 is 57 or 87.70%. The score is then compared with the following classification interval table to determine the tendency of the results of the presentation validity from expert 1.
TABLE 4
CLASSIFICATION INTERVAL OF THE TENDENCY OF THE PRESENTATION VALIDITY RESULTS FROM EXPERT 1
Interval Percentage Interval Category
56 – 65 86% - 100% Very Valid
46 – 55 71% - 85% Valid
36 – 45 55% - 70% Quite Valid
26 – 35 40% - 54% Less Valid
13 – 25 20% - 39% Invalid
Table 4.8 shows that the score 57 is at the interval of 56-65 (86% -100%) categorized as "very valid". c. Graphics Validity
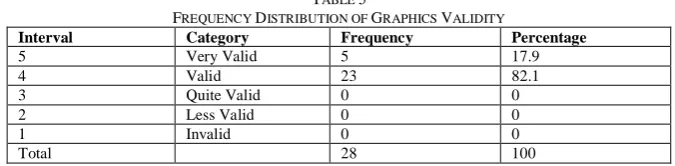
TABLE 5
FREQUENCY DISTRIBUTION OF GRAPHICS VALIDITY
Interval Category Frequency Percentage
5 Very Valid 5 17.9
4 Valid 23 82.1
3 Quite Valid 0 0
2 Less Valid 0 0
1 Invalid 0 0
Total 28 100
Table 5 shows the results of the graphics validity of the teaching materials, divided into 28 points. 5 points are rated as "very valid" and 23 other points are rated as "valid". Thus, no indicator is considered "quite valid", "less valid", and "invalid".
The total score of the graphics validity by expert 1 is 117 or 83.57%. The score is then assumed in the following classification interval table to determine the tendency of the results of the graphics validity from expert 1.
TABLE 6
CLASSIFICATION INTERVAL OF THE TENDENCY OF THE GRAPHICS VALIDITY RESULTS FROM EXPERT 1
Interval Percentage Interval Category
119 – 140 85% - 100% Very Valid
97 – 118 69% - 84% Valid
75 – 96 54% - 68% Quite Valid
53 – 74 38% - 53% Less Valid
28 – 52 20% - 37% Invalid
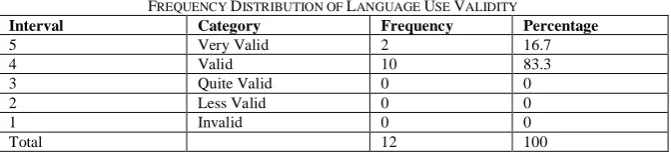
TABLE 7
FREQUENCY DISTRIBUTION OF LANGUAGE USE VALIDITY
Interval Category Frequency Percentage
5 Very Valid 2 16.7
4 Valid 10 83.3
3 Quite Valid 0 0
2 Less Valid 0 0
1 Invalid 0 0
Total 12 100
Table 7 reveals the results of the language use validity of the teaching materials, divided into 12 points. In this case, 2 points are categorized as "very valid" and the other 10 points are rated as "valid". In other words, no points are rated as "quite valid", "less valid", and "invalid".
The total score of the language use validity by expert 1 is 50 or 83.33%. This score is then assumed in the classification interval table below to determine the tendency of language use validity results from expert 1.
TABLE 8
CLASSIFICATION INTERVAL OF THE TENDENCY OF THE LANGUAGE USE VALIDITY RESULTS FROM EXPERT 1
Interval Percentage Interval Category
51 – 60 85% - 100% Very Valid
41 – 50 68% - 84% Valid
31 – 40 52% - 67% Quite Valid
21 – 30 35% - 51% Less Valid
12 – 20 20% - 34% Invalid
Looking at table 8, the score 50 is at 41-50 interval (68% -84%) categorized as "valid".
2. Validity Testing Results from Expert 2 a. Content
TABLE 9
FREQUENCY DISTRIBUTION OF CONTENT VALIDITY
Interval Category Frequency Percentage
5 Very Valid 11 65
4 Valid 6 35
3 Quite Valid 0 0
2 Less Valid 0 0
1 Invalid 0 0
Total 17 100
Table 9 presents the results of the content validity, which includes 17 points of which validity were tested. As we can see, 11 points fall into "very valid" category and 6 other points are categorized as "valid". No indicator is considered "quite valid", "less valid", and "invalid".
The total score of the content validity by expert 2 is 79 or 92.94%. The score is then compared with the classification interval table to determine the tendency of the content validity results from expert 2.
TABLE 10
CLASSIFICATION INTERVAL OF THE TENDENCY OF THE CONTENT VALIDITY RESULTS FROM EXPERT 2
Interval Percentage Interval Category
72 – 85 85% - 100% Very Valid
58 – 71 69% - 84% Valid
44 – 57 53% - 68% Quite Valid
30 – 43 37% - 52% Less Valid
17 – 29 20% - 36% Invalid
Table 10 shows that the score 79 is at the interval of 72-85 (85% -100%) in the "very valid" category. b. Presentation
TABLE 11
FREQUENCY DISTRIBUTION OF PRESENTATION VALIDITY
Interval Category Frequency Percentage
5 Very Valid 0 0
4 Valid 13 100
3 Quite Valid 0 0
2 Less Valid 0 0
1 Invalid 0 0
Table 11 shows the results of the presentation validity, which is divided into 13 points. These results indicate that all points are rated as "valid" by expert 2. In other words, no indicator is categorized as "very valid", "quite valid", "less valid", and "invalid".
The total score of the presentation validity by expert 2 is 52 or 80.00%. The score is then assumed in the following classification interval table to find out the tendency of the presentation validity results from expert 2.
TABLE 12
CLASSIFICATION INTERVAL OF THE TENDENCY OF THE PRESENTATION VALIDITY RESULTS FROM EXPERT 2
Interval Percentage Interval Category
56 – 65 86% - 100% Very Valid
46 – 55 71% - 85% Valid
36 – 45 55% - 70% Quite Valid
26 – 35 40% - 54% Less Valid
13 – 25 20% - 39% Invalid
Based on table 12, the score 52 is at the interval of 46-55 (71% -85%) falling into "valid" category. c. Graphics
TABLE 13
FREQUENCY DISTRIBUTION OF GRAPHICS VALIDITY
Interval Category Frequency Percentage
5 Very Valid 13 46
4 Valid 13 46
3 Quite Valid 2 8
2 Less Valid 0 0
1 Invalid 0 0
Total 28 100
Table 13 shows the results of the graphics validity, which is divided into 28 points. 13 points are rated as "very valid", 13 points as "valid", and 2 other points as "quite valid". In this case, no indicator is rated as "less valid", and "invalid".
The total score of the graphics validity by expert 2 is 123 or 87.86%. The score is assumed in the classification interval table below to determine the tendency of the graphics validity results from expert 2.
TABLE 14
CLASSIFICATION INTERVAL OF THE TENDENCY OF THE GRAPHICS VALIDITY RESULTS FROM EXPERT 2
Interval Percentage Interval Category
119 – 140 85% - 100% Very Valid
97 – 118 69% - 84% Valid
75 – 96 54% - 68% Quite Valid
53 – 74 38% - 53% Less Valid
28 – 52 20% - 37% Invalid
Referring to table 14, the score 123 is at the interval of 119-140 (85% -100%) under "very valid" category. d. Language Use
TABLE 15
FREQUENCY DISTRIBUTION OF LANGUAGE USE VALIDITY (VALIDITY TESTING 2)
Interval Category Frequency Percentage
5 Very Valid 7 58,3
4 Valid 5 41.7
3 Quite Valid 0 0
2 Less Valid 0 0
1 Invalid 0 0
Total 12 100
Table 15 deals with the results of the language use validity, consisting of 12 points. In this case, 7 points are rated as "very valid" and 5 other points are considered "valid". In other words, no indicator falls into "quite valid", "less valid", and "invalid" categories.
The total score of the language use validity by expert 2 is 55 or 91.67%. The score is then assumed in the classification interval table below to determine the tendency of the language use validity results from expert 2.
TABLE 16
CLASSIFICATION INTERVAL OF THE TENDENCY OF THE LANGUAGE USE VALIDITY RESULTS FROM EXPERT 2(TESTING 2)
Interval Percentage Interval Category
51 – 60 85% - 100% Very Valid
From table 4.32, it is seen that the score 55 is at the interval of 51-60 (85%-100%) in the category "very valid".
3. Effectiveness Testing Results of Indonesian Language Teaching Materials a. Learning Outcomes prior to the Treatment (Pretest)
TABLE 17
FREQUENCY DISTRIBUTION OF LEARNING OUTCOMES PRIOR TO THE TREATMENT (PRETEST)
Interval Frequency Cumulative Fr. Percentage Cumulative Per.
6 – 8 1 1 1.5 1.5
9 – 11 10 11 14.9 16.4
12 – 14 21 32 31.3 47.7
15 – 17 13 45 19.4 67.1
18 – 20 15 60 22.4 89.5
21 – 23 6 66 9.0 98.5
24 – 26 1 67 1.5 100
Total 67 100
Table 17 above shows the frequency distribution of learning outcomes of 67 students before the treatment. The interval tells the number of questions correctly answered by the students. In this case, 1 student is at 6-8 interval, 10 students are at 9-11 interval, 21 students are at 12-14 interval, 13 students are at 15-17 interval, 15 students are at 18-20 interval, 6 students are at 21-23 interval, and 1 student is at 24-26 interval. In other words, no student could answer all the questions (35 items) given correctly.
The data of learning outcomes prior to the treatment above is presented in the following classification interval table to see the tendency.
TABLE 18
CLASSIFICATION INTERVAL OF LEARNING OUTCOMES (PRETEST)
Interval Category Frequency Percentage
≥28 Very High 0 0
21 – 27 High 7 10
15 – 20 Moderate 28 42
8 – 14 Low 32 49
≤7 Very Low 0 0
Total 67 100
Table 18 above shows the tendency of the pretest learning outcomes of 67 students. From the table, there are no students whose learning outcomes fall into "very high" category, 7 students (10%) whose learning outcomes are categorized as "high", 28 students (42%) whose learning outcomes are in the category "moderate", 32 students (49%) with learning outcomes falling into "low" category, and no students whose learning outcomes are categorized as "very low".
b. Learning Outcomes after the Treatment (Pretest)
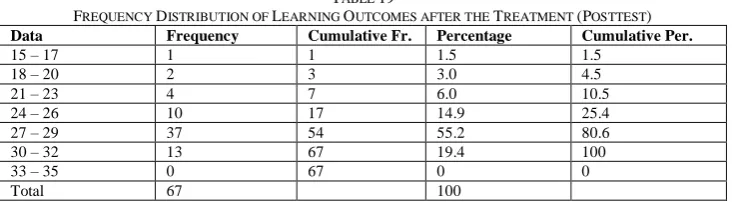
TABLE 19
FREQUENCY DISTRIBUTION OF LEARNING OUTCOMES AFTER THE TREATMENT (POSTTEST)
Data Frequency Cumulative Fr. Percentage Cumulative Per.
15 – 17 1 1 1.5 1.5
18 – 20 2 3 3.0 4.5
21 – 23 4 7 6.0 10.5
24 – 26 10 17 14.9 25.4
27 – 29 37 54 55.2 80.6
30 – 32 13 67 19.4 100
33 – 35 0 67 0 0
Total 67 100
Table 19 above presents the frequency distribution of learning outcomes of 67 students after the treatment. In this case, there is 1 student whose correct answers are at the interval of 15-17, 2 students at the interval of 18-20, 4 students at the interval of 21-23, 10 students at the interval of 24-26, 37 students at the interval of 27-29, 13 students at 30-32 interval, and no students at the interval of 33-35. Thus, no student could answer correctly all the questions (35 items) given.
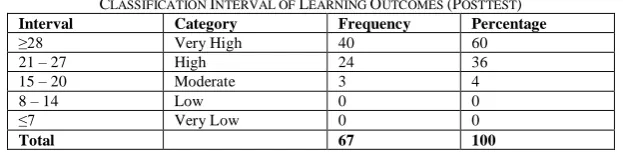
TABLE 20
CLASSIFICATION INTERVAL OF LEARNING OUTCOMES (POSTTEST)
Interval Category Frequency Percentage
≥28 Very High 40 60
21 – 27 High 24 36
15 – 20 Moderate 3 4
8 – 14 Low 0 0
≤7 Very Low 0 0
Total 67 100
Table 20 above reveals the tendency of the posttest learning outcomes of 67 students. By looking at the table, it was found that there are 40 students (60%) with learning outcomes categorized as "very high", 24 students (36%) with learning outcomes in "high" category, 3 students (4%) with learning outcomes in "moderate" category, and none of the learning outcomes are categorized as "low" and "very low".
V. DISCUSSION
Based on the findings and the results of the analysis, local culture-based Indonesian language teaching materials in South Sulawesi, Indonesia, have met two of the three standards of good teaching materials according to BSNP or National Education Standards Agency (2006). These include (1) content and construct validity of teaching materials; content, presentation, graphics, and language use, and (2) the effectiveness of teaching materials seen from students’ learning outcomes. The results of the validity testing of the learning materials in line with Akker (1999) that the validity of teaching materials can be seen from two components; product content and construct developed by involving some experts or practitioners who interpret the validity results. Akker (1999) adds that one way to measure the effectiveness of teaching materials is to review the results, achievements, or impacts of teaching materials on the target users of the developed products. In this case, the target users of the Indonesian language teaching materials are the first semester students of the Indonesian Language Education and Literature Study Program of Cokroaminoto University of Palopo. The effectiveness of the teaching materials, in terms of their impact on the target users, is characterized by the improvement in the students’ learning outcomes as indicated by the pretest and posttest results.
The results of the validity testing of the teaching materials are also in line with the results of validity testing by some researchers. Haslinda et al. (2017) develop teaching materials of “Fictional Prose Appreciation” showing average score of 4.32 (very valid) for content, average score of 4,07 (valid) for presentation, average score of 4.33 (very valid) for graphics, average score of 4.19 (valid) for language use, and average of 4.19 (valid) for media or technology. The average of one-to-one testing is 3.75 (valid), the field test is 4.38 (very valid), and the operational field test is 4.38 (very valid). Furthermore, teaching materials developed by Haslinda et al. effectively improve students’ learning outcomes and understanding of the values of Makassar local wisdom. The test results prove that there is an increase in students' learning outcomes: 22% of students passed the initial test and, however, 76% of them passed the final test. Furthermore, the test results related to understanding of the values of Makassar local wisdom show that 91% of students are able to find these values and describe it based on the reality.
In addition, Rukayah et al. (2017) reveal the same process and results with this research. Rukayah et al. developed teaching materials for poetry writing based on audiovisual multimedia for elementary school students. The results of validity testing of the teaching materials includes the average of 3.30 for content categorized as "valid”, the average of 3.60 for presentation categorized as "very valid", the average of 3.71 for graphics categorized as "very valid ", and the average of 3.66 for language use categorized as "very valid". Teaching materials for poetry writing based on audiovisual multimedia are effective in learning. This is indicated by the response of teachers, students and the results of students’ achievement tests. The average response of 4 teachers is 3.88 in the "very good" category. Furthermore, from 80 students, 73 or 91.25% of them responded "good" and "very good. The test results show that after students were taught by using the developed teaching materials, there is an increase in their learning mastery by 71.43%. Compared with the product specifications set by the researchers before the test was conducted, the Indonesian language teaching materials based on local culture are in accordance with the standards that their components including content and construct are valid and effective. This is because the main goal of the development of teaching materials is to improve students’ learning outcomes.
VI. CONCLUSION
REFERENCES
[1] Akker, J. Van den. (1999). Principles and Method of Development Research.London. Dlm.
[2] Badan Standar Nasional Pendidikan (BSNP). (2006). Instrumen Penilaian Tahap I BukuTeks Pelajaran Pendidikan Dasar Dan Menengah. Jakarta: BSNP.
[3] Departemen Pendidikan Nasional. (2007). Pedoman Pembelajaran Bidang Pengembangan Berbahasadi Taman Kanak-Kanak. Jakarta: Depdiknas.
[4] Dick, Carey & Carey. (2009). The Systematic Design Of Instruction. Library of Congress Cataloging in Publication Data.Addison–Welswey Educational Publisher Inc.
[5] Haslinda, dkk. (2017). “The Improvement of Fiction Prose Study as a Teaching Material Based on Makassar Local Wisdom Integrated with Mobile Learning at FKIP Universitas Muhammadiyah Makassar”. Journal of Language Teaching and Research. Vol 8 (5) (2017), p.915-921.
[6] Majid, Abdul. (2013). Strategi Pembelajaran. Bandung : Remaja Rosdakarya [7] Richard, Jack C. (2002). The Language Teaching Matrix. New York: Cambridge.
[8] Rochmat. (2011). Model Pengembangan Perangkat Pembelajaran Matematika. Semarang: FMIPA Universitas Negeri Semarang.
[9] Rukayah, dkk. (2018). “The Development of Writing Poetry Teaching Material Based on Audiovisual Media of Fifth Grade Elementary School Bone Regency”. Journal of Language Teaching and Research. Vol. 9 (2), p. 358-366.
[10] Surat Keputusan Direktur Jenderal Pendidikan Tinggi tentang Kedudukan dan Fungsi Mata Kuliah Bahasa Indonesia.Departemen Pendidikan Nasional Republik Indonesia Nomor 43/DIKTI/Kep/2006.
[11] Seels Barbara B, Rita C. Richey. (1994). Intructional Tecnhologi: The Definition and Domain of the Field. Washington DC: AECT.
[12] Susanto, Ahmad. (2014). Pengembangan Pembelajaran IPS di Sekolah Dasar. Jakarta: Prenadamedia Gorup.
[13] Tessmer, M., and Richey, R. C. (1997). The Role of Context in Learning and Instructional Design. International Journal of Educational Technology Research and Development. Vol 45(2), p.85–115.
[14] Tomlinson, Brian. (1998). Introduction. In Materials Development in Language Teaching ed. Brian Tomlinson, p.1-24. Cambridge: Cambridge Universty Press.
[15] Trianto, (2009). Mendesain Model Pembelajaran Inovatif-Progresif. Jakarta: Kencana Prenada Group. [16] Trianto. (2009). Media Pembelajaran. Jakarta: Raja Grafindo.
Kartini was born on January 26, 1984, in the hamlet of Massaile Village, district of Uranga Sinjai Selatan. the ninth child of nine siblings. Attended elementary, junior high, and high school in the County of his birth. Education diploma (DII) PGSDU traveled on the University of Muhammadiyah Makassar completed in 2005, was followed in the same year the S-1 education of language and literature of Indonesia and was completed in 2007. In 2008 continued S-2 education of language and literature of Indonesia and in the University of Muhammadiyah Makassar and completed in 2010.
Year 2010, writer on set became a lecturer at the University of Tjokroaminoto in action until now, and as a lecturer at the College of nursing with the Indonesia language courses. Currently a doctoral candidate in Indonesian Language education State University of Makassar.
Achmad Tolla, Lecturer of the Faculty of language and literature of IKIP/Makassar State University year 1982 till now, born in Leling Mamuju Regency, March 21, 1949. Completed primary school education Affairs Leling year 1966, the first State secondary school of the year 1968, Mamuju, Mamuju Sman 1970, B.a. IKIP Ujung Pandang years 1979, S-1 IKIP Ujung Pandang year 1981, Then completed S-2 FPs IKIP Malang 1991. Won a doctorate FPs Ikip Malang in 1996.
The experience of the Office, the head of the laboratory of FBS IKIP Ujung Pandang years 1996-1997, Secretary of the Program S-2 PPs IKIP Ujung Pandang years 1997-2001, Assistant Dean UNM FBs year 2001-2004 III, Chairman of the Indonesian Language Education 2004-2005 years, UNM Head UPBJJ UT West Sulawesi years 2005-2008, Chairman of the Doctoral Program of the science of language education PPs UNM year 2009 s. d now, Presiding Professor State University of Makassar.
Jasruddin, Lecturer in the Department of physics at the State University of Makassar. Place date of birth, Matano 22 Desembar 1964, the formal State primary school biennial donations Matano 1973-1975. 220 Sorowako Lands elementary school 1975-1979. Middle School State Nuha 1982. Inco mine Soroako middle school, 1985. Then continue on S-1 physics education IKIP Ujung Pandang years 1990, S-2 physics education Bandung Institute of technology of the year 1996, the S-3 (Ph.d.) major in physics education Bandung Institute of technology of the year 2002.
The experience of the Office of the Director of the Graduate School of the State University of Makassar (UNM), Coordinator of the South Sulawesi Region X Kopertis year 2017 s. d now. Areas of expertise namely physics semiconductor materials especially amorphous silicon (a-Si) Thin Film Transistor for manufacturing (TFT), Thin Film Light Emitting Diode (TFLED), and a Solar Cell (solar cell).
of the Faculty of literature in 1990. S-2 University of Hasanuddin Makassar Indonesian Language year 1994. S-3 Jakarta State University (UNJ) Indonesian Language Education year 2010.