ISSN: 2278-3369
International Journal of Advances in Management and Economics Available online at: www.managementjournal.info
RESEARCH ARTICLE
Financial Management Challenges Facing Small and Medium
Enterprises in Accessing Credit Facilities: Case of Uasin Gishu
County, Kenya
Ruth Jerotich Kiplagat
1, Kevin Owembi
1, Omwono Gedion Alang’o
2 1Catholic University of Eastern Africa GABA Campus Eldoret, Kenya.2Arab Academier for Financing and Banking Science
*Corresponding Author: Omwono Gedion Alang’o
Abstract
The purpose of this study was to examine financial management challenges facing small and medium enterprises in accessing credid facilities in Uashin Gishu County, Kenya. This study was guided by the following research questions; how can the financial institutions structure debt financing for SME’s? What can the revenue authorities do to help SME’s in filing tax returns? Which way can SME’s improve on their debt collection in order to increase their performance? How can SME’s be able to raise capital in order to enhance their efficiency and effectiveness? This study employed descriptive survey design. A sample of 105 small and medium enterprises was drawn from the target population of 350 SMEs. The study employed the probability sampling with stratified random sampling. Data was collected using questionnaires, document analysis and interviews guide. This study found that majority of the enterprises borrow from financial institutions (75%) while the rest (25%) don’t borrow from the bank because of the difficulties encountered when accessing credit and others prefer using their savings and plough back the profits. This study concluded that lack of capital was the biggest financing challenges which affect the performance of small and medium enterprises. This study recommended that financial institutions should encourage SMEs to keep accurate and up to date accounting records so that they are aware of the financial performance and financial position of their entities, as well as their ability to generate cash.
Keywords:Financial management challenges, SMEs, Accesssing credit
Introduction
Background to the Problem
SMEs play a very important role in the economy in terms of balanced and sustainable growth, employment, development of entrepreneurial skills and contribute to export earnings [1]. However, despite their importance to the economy most SMEs are not able to stand up to the challenges of globalization, mainly because of difficulties in the area of financing.
There is no universally accepted definition of a small and medium-sized business. The term SMEs covers a wide range of definitions and measures, varying from
country to country and varying between the sources reporting SME statistics. Some of the commonly used criteria are the number of employees, total net assets, sales and investment level. Small and middle enterprises are playing significant contributions in the economic development, social uplifting and the political stability of every country.
enterprises as that employs 300 to 2,000 people, have annual sales of 30 to 300 million Yuan and own assets worth 40 to 400 million Yuan. According to this definition, 99% of the country's 10.3 million companies are SMEs, which account for more than 80% of urban employment and produce 60% of China's GDP.
SMEs can be established for any kind of business activities in rural or urban areas. It can be considered as a back bone of national economy. According to (Abor & Quartey 2010) SMEs are of great socio-economic significance. Thus, in Kenya SMEs are defined in term of small and medium sized enterprises, small sized are those business units that employ between 10 and 30 employees while medium sized enterprises are those that employ between 31and 100 people. Hence, for this study, SMEs are enterprises that employ not more than 100 people or a turnover of less than one billion Ksh (By business daily and KPMG top 100SME’s).
The increasing role of the SME sector is confirmed by the recently completed Kenya Economic Survey (2003), According to the survey, total employment recorded in the informal sector increased from 3.7million employees in (2000) to 5.1 million (37.8%) in (2002), while the formal sector increased only from 1.74 million to 1.76 million(1.15%) employees during the same period. SME’s represent the largest percentage of enterprises in most countries in worldwide. SMEs contribute a sizeable share to formal GDP of 49% on average in high income countries and 29% in low income countries World Bank report (2004). They are the driving force behind a large growth of national economy because they create job opportunities, investment and export to other countries (importance of SME’s by Qimiao Fan; World Bank.
The challenges faced by SMEs is that they are being charged higher interest rates compared to larger firms, thus unnecessarily increasing operating costs and reducing their competitiveness. Most SMEs also have inadequate or incomplete accounting records, with some not even compiling
annual financial statements, on which finance providers can make assessments. Another challenge is that assets and collateral may not be sufficient enough to underwrite credit. Apart, from this most SMEs’ management skills in handling finances and other technical requirements are often limited.
One of the problems faced by small firms when attempting to raise finance is information asymmetry in that they cannot prove the quality of its investments projects to the provider of finance. Small firm managers often suffer from a lack of financial sophistication, as they are often product or service specialists, not specialists in the area of finance. Thus, the information asymmetry problem is partly one relating to difficulties in the spheres of communication and credibility. This is compounded by the fact that new or recent start-ups businesses may be unable to provide evidence of a good financial performance track record. Banks in particular rely on past financial performance as an indicator for the future profitability of projects.
Statement of the Problem
In ideal situation, good financial management is critical to the success of any business, but it is particularly important in small to medium enterprises (SMEs) where the risk of insolvency is often little more than an unpaid invoice away. A key concern for small business owner-managers is cash flow management, or more specifically the cash conversion cycle. This is the firm’s ability to generate cash from its customers’ invoices, and the time it takes to collect these accounts receivable.
However, this type of finance is inadequate to cater for all the needs of the medium and small enterprises. As a result, lack of credit forces the management to use cheap and local technology which most times are inappropriate.
Various studies has been done in this area, in a study by Gichuki, et al. [2] on challenges facing micro and small enterprises in accessing credit facilities in Kangemi harambee market in Nairobi City county, found that challenges hindering micro and small enterprises from accessing credit facilities to be high cost of repayment, strict collateral requirements, unwillingness of people to act as guarantors, high credit facilities’processing fees and short repayment period. In yet another study by Musau, G.E [3] on effects of microfinancial institutions’ services on sustainability of small enterprise: a survay of small enterprise in Huruma Esatate Eldoret Kenya found that there is an inverse relationship between sustainability of small enterprises and microfinancial institutions services’.
When lending conditions are in favour of small business owners, sustainability improves by 0.376 (37.6%) similarly, increase in frequency of training of small business owners resulted to an improvement in sustainability of small business by 0.767 (76.7%). However, in an empirical study done by Mensah, et al. [4] on challenges faced by small and medium-size enterprises in accessing credit facilities from financial institutions: An empirical assessment incorporating the perceptions of both borrowers and financiers in Ghana, found a strong positive relationship between challenges percieved by borrowers and bankers at 62.3% of the total variation counted. This study therefore, examines financial management challenges facing small and medium enterprises in accessing credit facilities in Uashin Gishu County, Kenya.
Research Questions
This study was guided by the following research questions;
How can the financial institutions
structure debt financing for SME’s?
What can the revenue authorities do to help SME’s in filing tax returns?
Which way can SME’s improve on their debt collection in order to increase their performance?
How can SME’s be able to raise capital in order to enhance their efficiency and effectiveness
Theoretical Framework
The credit rationing theory, provides a framework for analyzing financial market inefficiencies. The most important conclusion from Stiglitz and Weiss argument is that information asymmetry in the form of adverse selection and moral hazard is the source of market inefficiency in developing countries and this leads to low risk borrowers such as SMEs being sidelined or even excluded from the stream of potential borrowers. In this study, the debt financing is one among others that affect the credit accessibility in financial institutions in Uasin Gishu County Kenya.
Conceptual Framework
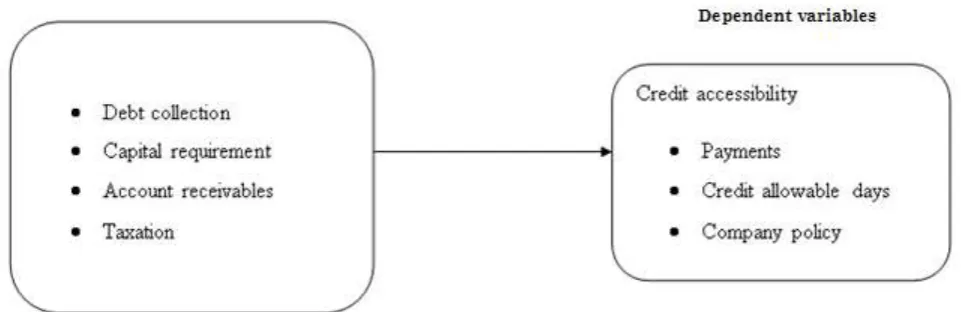
In this study, independent variables like debt collection or trade or Accounts receivables accrue as a result of goods sold on credit. Depending on the terms of payment or credit allowable days as per the company policy, cash may be received either in weeks or months, even days. A company can manage its accounts receivable properly by credit management, meaning that decisions regarding terms of sale, credit analysis and decisions, and collection policy have to be made, other independent variables capital requirement, debt financing and taxation can directly influence the level of growth and economic development of SMEs when accessing credit facilities. The dependent variable was the credit accessibility. The relationship between independent and dependent variables as indicated in Fig. 1
Literature Review
Review of Theories
Agency Theory
Figure 1: Conceptual framework Source (Researcher, 2015)
as principals who are also known as shareholders. The theory is on the notion of the principle of ‘two-sided transactions’ which holds that any financial transactions involve two parties, both acting in their own best interests, but with different expectations. The agency conflicts arising from divergence between agents’ and principals’ is real. The management who are the agent acts not to the interest of shareholders who are the principal.
Trade-off Theory
The tax advantage of debt makes it cheaper than equity. The mix of cheap debt with relatively expensive equity reduces a firm’s cost of capital, which is the cut-off rate for investment acceptance decisions. This is known as the leverage effect of debt.
Empirical Review Lack of Capital
‘The challenges of financing small and medium scale enterprises (smes) in the Ashanti region a case study of stanbic bank (gh) ltd’ the main objective of the study was to evaluate the challenges and the extent of financing of SMEs within the Ashanti Region of Ghana, taking cognizance of the role and contributions of Stanbic Bank Ghana Limited. Primary data were collected by the use of structured questionnaires which were designed and administered to SME customers and employees of the company alike. Stakeholders like SME customers, management executives and staff of Stanbic Bank were interviewed for input
on the study. Secondary materials were extracted from relevant articles, journals, bulletins and documents presented by corporate financial analysts and policy planners. Their study showed that all the staff respondents have been on the SME Banking between the period of less than 2 years and four (4) years; majority having been with the Unit for three (3) years period. In view of the findings, it was recommended that banks should create a separate department for the SMEs; the establishment of a common fund by the government for SMEs; there should be a national policy on SMEs by the government in respect of funding among others in other to educate SMEs in the efficient and effective financial management of their businesses in order to sustain the SMEs to grow into much bigger industries in the near future. In this study however, both open and closed ended questionnaire was used with the main area of study as Uasin Gishu County, Kenya with a sample size of 105 respondents.
Transaction Cost
entrepreneurs who had registered their business and acquired license for the year 2013.
A sample size of 40 youth entrepreneurs was used in their study. The methods used to gather the data was interview, focus group discussion and observation. Sampling was random sampling in which out of 40 youth entrepreneurs were selected out of the target of population of 200. Secondary data was collected from secondary sources, these included books, journals, and research papers from other researchers as well as private and public organizations. Data gathered was analyzed by a statistical representation such as percentages, fractions and charts. The research found that most of youth entrepreneurs faced challenges in accessing credit due high cost of credit evidenced in high loan processing fees, high rate of legal fee, high rate of interest, high cost of credit insurance and high expenses incurred in travelling in the process looking for credit.
The research recommends that the financial institutions should look for ways of developing credit products that would attract the youth. The lenders and other stakeholders should explore lowering rate of interest for credit products meant for the youth. High risks associated in lending SMEs and fixed costs associated in acquiring sound information about the borrower by financial institutions as the major driving force to the high cost of credit. While the above study in Makuyu division was to investigate the cost of credit to youths in that area, this study examines Challenges faced by SMEs on Credit accessibility in Uasin Gishu County, Kenya with a population of 350 with a sample size of 105.
Hasnah, Saniza, K. Jayaraman & Ishak [5], on “Factors influencing small and medium enterprises (SMEs) in obtaining loan”, the objective of their study was to examine as to whether the character (or management’s knowledge of business) of having collateral and also the capacity of borrowing by the SMEs, which was measured by default in loan shown by CCRIS report, had an influence on the loan approved by the bank officers.
One of the main reasons why banking and financial institutions are reluctant to disburse funds to the SMEs is due to lack of collateral and good track record of the company. A 2 x 2 x 3 experimental within subject design was used in their study.
Questionnaires were sent to 63 bank officers participated in the study. Findings showed that all the three variables had significant effect on the likelihood of the loan approval by the financial institutions from the perspective of credit officers. SMEs should be better prepared when applying for loan with getting the collateral, good relationship with financial institution and having a good financial record. On the other hand government agencies assisting SMEs should educate them to ensure that they are equipped with the knowledge to prepare the required documentations required by the financial institutions. The above study was done in Malaysia in the Asian Continent with different diversity and with different objective in mind, the current study however, was done Uasin Gishu County Kenya continent of Africa with a population slightly lower than that of Malaysia.
Trade or Accounts Receivables
“Trade Credit and Profitability in Small and Medium Enterprises” Small and medium enterprises (SMEs) play an important role in economic growth, which increasingly draws public attention in recent decades. The study focuses on how trade credit, from both the supplier side and the demand side, influences the profitability of SMEs. We investigated 71 SMEs in Netherlands from 2009 to 2013. The findings suggested that SMEs can establish a long-term relationship with their suppliers to gain credits since accounts payable is positively related to the profitability. While in this study had sample size of 105 small and medium enterprises in Uasin Gishu County –Kenya which was slightly higher than the one in Netherland.
Research Design and Methodology
Research Design
challenges that hinder the performance and growth of SMEs. Thus this design was deemed appropriate in this study since it involved the procedures of collection and analysis of data from the 105 members of a sample, in this case SMEs whose businesses were located in Uasin Gishu County Kenya. Target Population
The target population for this study involves the firms that deal with provision of goods,
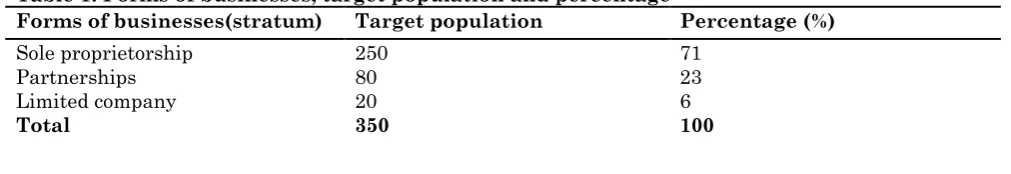
all the comprises of (350) within the Uasin Gishu County. Those who run particular business on daily basis constituted the targeted population since they were entrusted with the responsibility of working towards the attainment of the firm’s ultimate objective on behalf of the business owners. The business enterprises are stratified into forms indicated in table 1.
Table 1: Forms of businesses, target population and percentage
Forms of businesses(stratum) Target population Percentage (%) Sole proprietorship
Partnerships 250 80 71 23
Limited company 20 6
Total 350 100
Source: (author, 2015)
Description of the Sample and
Sampling Procedures
To select the sample size, a stratified simple sampling technique was used where the
SMEs was grouped into different form of business. Then independent simple random sample is then drawn from each group. The sample size of 100 was obtained.
Table 2: Determining sample size
Form of business Target
population Sample size (30%) Percentage (%)
Sole proprietorship 250 75 71
Partnership 80 24 23
Limited company 20 6 6
Total 350 105 100
Source: (author, 2015)
Description of Research Instruments Data was obtained through the use of questionnaires, document analysis and interviews guide which were structured and unstructured. Questionnaire was divided into five sections with section A has demographic or background information, B has capital information, C has taxation information, D has the debt financing information and E has the account receivables. Secondary data was analyzed using document analysis. The interview guides and document analysis were used on the managers of the enterprises.
Description of Data Analysis
Procedures
Social Sciences (SPSS) was used as a tool in analysis.
Validity of Research Instrument
Results
To ensure validity of research instrument the researcher used expert judgment; this was by relying on groups of individuals with specialist skill set, training or experience in the subject matter relevant to the activity being performed.
Reliability of Research Instrument Results
The researcher enhanced the reliability of the data collected by use of test-re-test method by ensuring that the instrument
was administered twice to the same sample of 8 respondents who was not part of the sample.
Discussion
Response Rate of Return
The study targeted the 105 respondents as the sample size for the study. The higher the number of participants the reliable the information obtained and the researcher received 100 out of 105 which were administered and represents 95% response rate and those who never replied to questionnaire represents 5%.
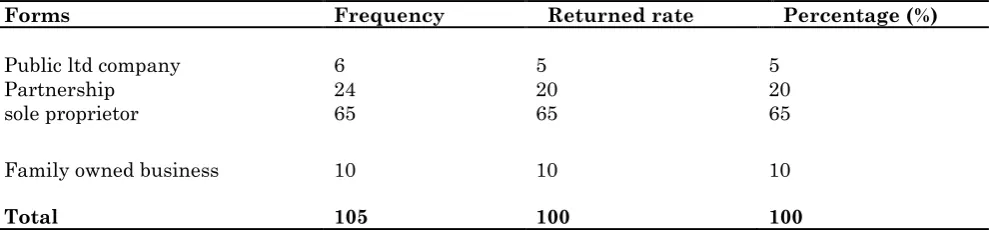
Table 3: the Distribution of the questionnaire and rate of return
Forms Frequency Returned rate Percentage (%)
Public ltd company 6 5 5
Partnership 24 20 20
sole proprietor 65 65 65
Family owned business 10 10 10
Total 105 100 100
Source: Research questionnaire.
Table 3 shows the distribution of questionnaires and the rate of return 100 participants were given questionnaires and 95% were returned and the rest 5% were not returned by the participants. Respondents
who participated in the interview were 15 managers and the researcher was able to interview all the managers.
Figure 2: Distribution of questionnaire and rate of return 95%
5%
Returned
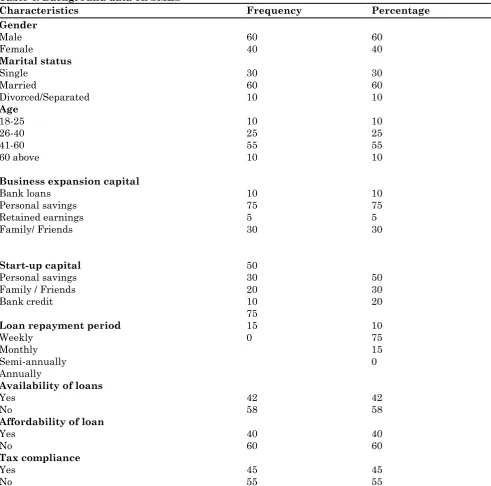
Demographic Information Table 4: Background data on SMES
Characteristics Frequency Percentage
Gender Male
Female 60 40 60 40
Marital status Single
Married
Divorced/Separated
30 60 10
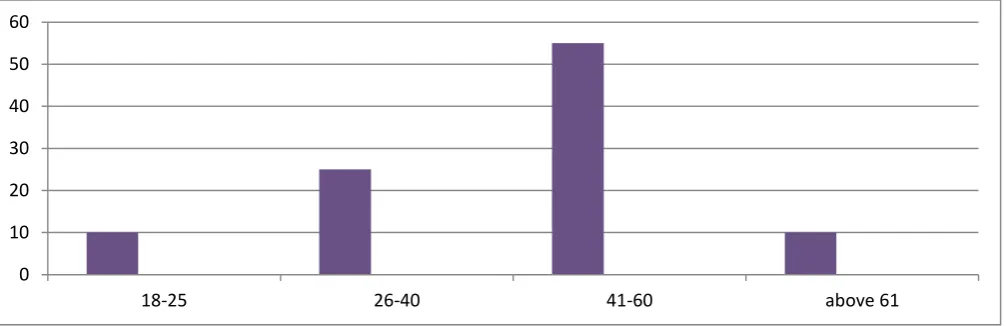
30 60 10 Age
18-25 26-40 41-60 60 above
10 25 55 10
10 25 55 10 Business expansion capital
Bank loans Personal savings Retained earnings Family/ Friends
Start-up capital Personal savings Family / Friends Bank credit
Loan repayment period Weekly
Monthly Semi-annually Annually
10 75 5 30
50 30 20 10 75 15 0
10 75 5 30
50 30 20 10 75 15 0 Availability of loans
Yes No
Affordability of loan Yes
No
Tax compliance Yes
No
42 58 40 60 45 55
42 58 40 60 45 55 Source: Field data, 2015
Respondent by Gender
Gender of the respondents was established in the study. It is important to adhere to gender equality, a total of 100 entrepreneurs in the study. Among them 60(60%) were male while 40(40%) were female. This implies that there were more male entrepreneur than female entrepreneurs. The difference of 20% is very gap in business. The government should rebalance through training, financial seminars and education to increase the proportion of female entrepreneurs.
Participant No. 20
If I would have been of a different gender I would have a large enterprise and well performing. They believe that women are weak in handling businesses.
Age of Respondent
where the entrepreneurs discover their potential and above 61 years has a less percentage of 10%
Participant No. 2
I have been running this business for the past three year. Most people who have being
in business for long period perform so well, like my dad manages his enterprises for around twenty years now as we talk. His business is performing and growing at a good base.
Figure 3: Distribution by age Source: Field data, 2015
Distribution by Marital Status
The respondents were required to indicate their marital status in the questionnaire. It was important to establish and know the marital status of the owner of the business. Majority of the business owners are married with 60% followed by the singles at 30% and then followed by the divorced or separated at 10% respectively. Most of the successful businesses are owned by married people who meet the social status.
Participant No. 13
My late husband was a nice person, he died some years back and we use to manage our businesses together, since then I find difficulties running and managing this…….., because there are more other responsibilities at home. It’s not easy to manage two things at the same time individually. Majority of the businesses that are outweighing in the performance in this area are managed by married couples. Two heads are better than one.
Figure 4: Distribution by marital status Source: Field data, 2015
0 10 20 30 40 50 60
18-25 26-40 41-60 above 61
30%
60% 10%
single
married
Level of Education
The level of education of respondent is of more important to a researcher to determine the knowledge and specialization of the owners of the business. Every participant was required to indicate the level of education to help the researcher know the owners decision making process.
Majority of the owner-managers of the businesses are educated as shown by the findings. The combination of both university and college graduands adds to 50%, 45% for secondary education and 5% lack the secondary education which is better they have the basic knowledge of making decision. The findings confirms that participants have attained education which is encouraging since the theory that most of the small and medium businesses are owned and managed by less educated individual which is quite different according to the researchers findings which shows that
educated people are seeking forward for self employment, becoming their own bosses, making their own decisions and enjoying the benefits. Education is one of the factors that impact positively on growth of firms. Those entrepreneurs with larger stocks of human capital, in terms of education and (or) vocational training, are better placed to adapt their enterprises to constantly changing business environments.
Participant No. 25
Nakuambia Mwanangu, mimi nimekuwa kwenye hii biashara kwa muda mrefu sasa na sina elimu yoyote. Ni kwa nini ni some ilhali tuko sawa na waliosoma? Napata ugumu tu wakati wa kuzungumza na watu walio juu yangu kwa elimu na pia wakati wa kuomba mkopo kwenye benki. Mwanangu mkubwa amekuwa wa msaada kwangu kwa sehemu ambao sielewi.
Figure 5: Distribution by level of education Source: Field data, 2015
Start- up Capital
The capital to start up the business has become a great challenge to all people. The questionnaires were requiring participants to respond base on the type of finance used
to start the business. It was important for the researcher to understand the challenge encountered by the owner before the start of business.
Figure 6: Distribution by start-up capital Source: Field data, 2015
o level, 5%
secondary, 45% college, 35%
university, 15%
0 10 20 30 40 50 60
personal saving family/ friends bank loan
Column1
The findings indicates that majority of the participants borrow start-up capital from the friends or families or use the personal saving. Personal savings represents (50%) and family or friends represents (30%). The remaining (20%) are borrowings from the financial institutions, the participants fear the high interest rates and long duration of acquiring loans.
Forms of business organization
The form of business is clearly defined based on its legal registration status. Some of these forms are Sole proprietor where the owner operates and becomes the boss of the business, partnership where they own business jointly with a friend, limited company that have several owners each having a certain percentage of ownership i.e. limited by shares and family owned enterprises which the managed by family members.
Table 5: Distribution by forms business organization
Forms Frequency Percentage (%) Cumulative (%)
Public ltd company 5 5 5
Partnership 15 15 20
sole proprietor 60 60 80
Family owned business 20 20 100
Source: Field data, 2015
The forms of business that were under the study sole proprietorship, partnership, limited company and family owned business. The findings of the study were sole proprietor respondent (60%), limited company respondent (5%), partnerships respondent (15%) and finally family owned business (20%). The results of the findings shows that business are registered as sole proprietor, this is mainly because sole businesses are owned by individual, the owners make the decisions to the business, they become the owners and bosses of their
businesses, no supervision, few legal formalities are required for the registration of the business and most importantly enjoying the benefits of the firm.
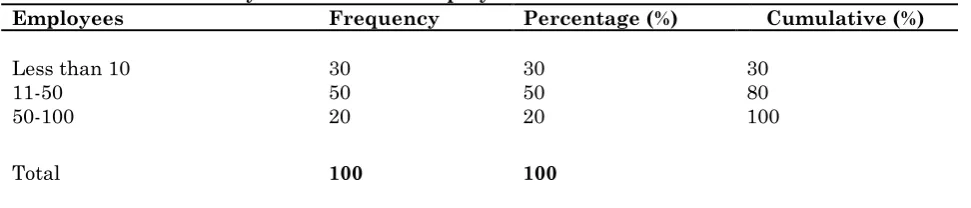
Number of Employees
The respondent were require to indicate the number of employees that a firm or enterprise employ in order to help the researcher to categories the firm as whether small or medium enterprise.
Table 6: Distribution by the number of employees
Employees Frequency Percentage (%) Cumulative (%)
Less than 10 30 30 30
11-50 50 50 80
50-100 20 20 100
Total 100 100
Source: Field data, 2015
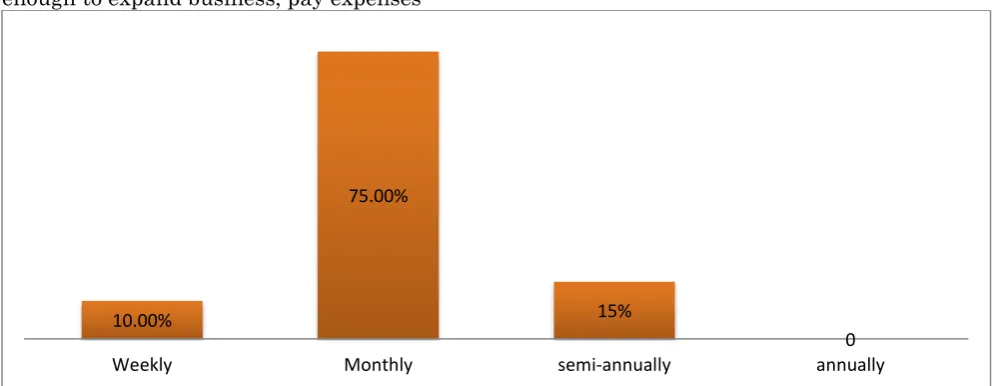
Loan Repayment Period
The study requires the respondents to indicate the duration it takes them to repay the loan to the lending institutions, including the interest. It helps the researcher to determine the rate of interest and the amount of money that the firm gets from lending institutions. The findings shows that more SMEs repay on monthly basis (75%), then on semi-annually basis
(15%), then weekly basis (10%) and on annual basis none of the financial institution accept on the annual repayments. It shows that the lending institutions never give enough time for the smes to repay their loans.
Participant No.3
business cannot generate revenue which is
enough to expand business, pay expenses and repay back the loan to the bank.
Figure 7: Distribution by loan repayment period Source: Field data, 2015
Availability of Loan
The respondents were required to indicate if the loan were available in the lending institutions. The finding shows that majority of the respondents (58%) get inadequate loan and the rest (42%) shows that they get adequate loan. The higher percentage of NO in the findings is because of lack of collateral, legal documents, poor or lack of proper books of accounts and also the new entrepreneurs are not given enough credit. Participant No. 19
Last month I went to a certain financial institution in Eldoret Town to borrow some amount of loan to expand the business, but
due to the lack of enough securities in term of assets the bank gave less amount and the business had to borrow elsewhere from friends and family to top up.
Tax Computation and Remittance
Tax is a compulsory payment to the state without expecting benefit in returns. The study requires the respondent to indicate if they compute and remit tax to the local authorities. The findings show that there is slight increase that people follows the rules and regulations of paying taxes because majority are educated hence they have knowledge on the self assessment on taxes. Yes (64%) and No (36%).
Figure 8: Distribution by computation and remittance of taxes Source: Field data, 2015
10.00%
75.00%
15%
0
Weekly Monthly semi-annually annually
Yes 64% No
Challenges faced by SMEs in Credit Accessibility
It’s well known that the small and medium enterprises face a lot of challenges by both internal and external factors. They cited the following difficulties slow process of loan application, lack of collateral or security, inadequate financial infrastructure, lack of financing start ups, financial institutions financing less than applied for and high interest rates that the respondents cannot afford. All these challenges leave the potential entrepreneurs not to borrow the required amount. Despite having many and well equipped financial institutions and macro-finances that finances the small and medium enterprises in the country of Kenya, the respondents still face challenges in accessing credit for their businesses. The results on this section were presented in form of tables, frequencies, pie charts to give a clear picture of respondent’s opinion. Bank Account
The finding shows that majority of the small and the medium enterprises have the bank
accounts. The financial institutions base their lending capacity based on the audited financial statements, documentation of books e.g. cash flows statements, income statement and statement of financial position. Following the recent technology infrastructure that most of financial institutions allow the business men to operate and assess their accounts using their mobile phones e.g. M-Shwari, M-pesa Accounts. This has made most of the entrepreneurs to save. Majority of the respondents have been operating bank account for a longer period.
Participant No. 40
We operate bank account in several different banks, but out of the many only one is active because it allows their customers to operate the account using the cell phones in sending their savings….. Thanks for the new technological infrastructure in the Country; it has made it easier and less costly.
Table 4.5: Operating bank account
Frequency Percentage (%) Cumulative (%) Operate bank account
Yes
No 96 4 96 4 96 100
Source: Field data, 2015
Figure 9: Distribution by bank account Source: Field data, 2015
Bank account
Sources of Funds to Finance the Business
The respondents were asked to state whether they have bank account and if they have ever borrowed different sources of funds from the financial institutions example Loans, Equity issuance, Government subsidiaries, Business Angels and Leasing. The findings was intended to help the researcher know how SMEs finance their businesses and expansion as they
outgrow the owners capital and whether they consider the bank as the best source of funding. Since most of the respondents have the bank account the researcher wanted to establish whether most of the respondent borrow from the financial institutions, whether the loan applied for are obtained and whether the process of loan application the long
Table 7: Have you borrowed funds in any financial institution to finance you business?
Frequency Percentage (%) Cumulative (%) Borrowed funds
Yes
No 75 25 75 25 75 100
Source: Field data 2015
Figure 10: Distribution by bank borrowing Source: Field data
The findings shows that majority of the enterprises borrow from financial institutions (75%) while the rest (25%) don’t borrow from the bank because of the difficulties encountered when accessing credit and others prefer using their savings and plough back the profits.
Difficulties of Processing Loan
Application
The respondents were required to indicate whether they have difficulties in loan application process. The findings indicates
that majority of the responds from the questionnaire shows that there is difficulties in processing loan from the financial institutions and it takes duration of time to get the amount.
Majority of the face difficulties in processing loan from the banks (80%) the procedures followed by the financial institutions in processing the loan e.g. if the participants has the account, enough security and proper documentations while (20%) of the participant see no difficult in processing loan from the banks.
0% 10% 20% 30% 40% 50% 60% 70% 80%
Participant No.11
Despite operating the bank account in several financial institutions, there is difficulty in processing the loan from banks. Before the process of loan the banks follows
procedures, they check if the participant has an account with their bank, number of total net assets and documentation or when I visit the institution every time I was told to check another day.
Figure 11: Are there any difficulties in loan processing application loan? Source: Field data, 2015
Duration of Loan Application Process The findings show that the participants took
a longer period in processing loan.
Table 7: Loan application duration
Employees Frequency Percentage (%) Cumulative (%) Loan application duration
One week One month Three months Over three months
8 62 20 10
8 62 20 10
8 70 90 100
Source: Field data, 2015
Figure 12: Distribution by loan application duration Source: Field, 2015
0 10 20 30 40 50 60 70 80
YES NO
%
0 10 20 30 40 50 60 70
1 week 1 month 3 months over 3 months
p
e
rc
e
n
tage
This will help the researcher to know the period that the financial institutions take to award the businesses the loan applied for. Majority of the respondents according to the questionnaire shows that majority of the business loan application is processed within a duration of one month (62%), few of respondent claim that the loan processing took one week which is faster for the business expansion (8%), then duration of 3 months (20%) and finally it shows that (10%) claims that the financial institutions take long processing the loan application form.
The findings indicate that most of respondents are given the loan within duration of one month.
Bank Give Loan Applied for or Not The respondents were required to indicate if the loan applied for were given by the financial institution. This helps the researcher to in knowing whether the respondents are provided the finances by the financial institutions.
Table 8: loan applied
Frequency Percentage (%) Cumulative (%) Given applied for
Yes No
64 36
64 36
64 100 Source: Field data, 2015
The findings indicate that above average of participants are given the loan applied for (64%). While the rest (36%) are given less than applied for or sometimes are not given at all, they are forced to look for other sources of financing their businesses. Those who are not given the loan at all are because of the lack of proper documentation.
Participant No. 35
Whenever my enterprise applies for some loan from the financial institution for expanding and settling the expenses, probably the……. take short time and give what applied for. The enterprise has been operating for 4 years, we ensure that all the credit from bank has been settled and adherence to all the requirements by law and banks.
Figure 13: Distribution by applied loan Source: Field data, 2015
Problems Facing the SMEs Who Did Not Get Full Amount Applied For
It was important to establish and understand the problems faced by the SMEs who were not provided with full funds by the financial institutions. It was based on the
questionnaire findings that SMEs never the amount of funds applied for. It would help the researcher to understand the reasons that hinders the financial institutions from giving the funds applied for by SMEs.
The finding indicates that lack of enough collateral, business proposal/ plan not
64% 36%
loans
acceptable and lack of audited financial statements. Findings show that most of SMEs don’t keep proper documentation. Participant No. 33
The loan we apply from financial institutions takes a longer period to be
processed and sometimes they give the inadequate or less than the amount applied for, this forces us to borrow from a 3rd party.
Infant enterprises or firms face difficulties because they lack requirements by banks.
Table 4.9 Distribution by problems faced by SMEs not given full funds
Frequency Percentage
(%) Cumulative (%)
Problems Lack of collateral Audited financial statements
Business proposal Other problems
72 13 10 5
72 13 10 5
72 85 95 100
Figure 14: Distribution by the problems faced by SMEs not given full funds Source: Field data, 2015
It shows from results respondent indicates that lack of collateral (72%) and audited financial statements (13%) are the main problems that affect the credit accessibility from financial institutions. The finding of business plan (10%) is not considered by many banks and (5%) is other problems.
Account Receivables
The researcher sought to establish the extent to which the enterprises offer sales on credit. This is important to the researcher because it will establish the period that the debtors or trade receivables takes and also the challenges the firms face when they are not able to pay amount due.
Table 10: Distribution by credit sales
Frequency Percentage (%) Cumulative (%) Trade receivables
Full receipts debts Half receipt debts Written off debts
60 30 10
60 30 10
60 30 100 0
10 20 30 40 50 60 70 80
lack of collateral audited financial
statements
business proposal other problems
p
e
rc
e
n
tage
The findings show that majority of the trade debtors return the amount for the stock given (60%), while participants who return half represents (30%) and finally those are written off represent a percentage of 10% meaning that they cause challenges to the owners of the business. The participants have to take the legal action in order to recover and some have to be written off. Some of debtors take along duration to return.
Participant No. 9
Sometimes the workers don’t indicate in the books that there are debtors existing and we have to write off, this is very costly to the firm. While others take along period to return, example is when one of the debtors took goods worth large amount of money and it took 6 months to be returned and we had to borrow from a friend and loans from financial institution cater for the expenses. We had to go to the court of law in order to recover the amount.
Conditions Required by Law
The respondents were required to indicate whether they have the documents required by the law of the country. The study found out that most of the firms had legal documents required by the law for trading purposes. More so the available documents across the firms were; Kenya
Revenue Authority documents such as VAT registration certificate, PIN certificate, tax compliance certificate and annual tax returns, County Council single businesses permit. This question on documents helped the researcher to establish if the SMEs in Uasin Gishu County are legally compliant. The researcher intended to establish if the businesses have the minimum government requirements. The results show that these SMEs have the documents which ensure that they operate smoothly with no harassment by authorities for non compliance on the requirement.
Participant No. 50
One week ago, I paid the fine to the municipal council of Uasin Gishu County, due to lack of compliance of rule and regulation of the municipal council. Example is where I failed to renew the county council business permit when it expires.
Results
Findings
The study was carried out to evaluate the challenges and the extent of financing of SMEs within Uasin Gishu County-Kenya, taking cognizance of the role and contributions of SMEs; specifically looking at how to identify the main sources of finance for SMEs and assess their effectiveness on business in their respective industry; to determine the positive impact of financing on the business development of SMEs in Uasin Gishu County and to verify the characteristics that influences the financing of SMEs. The study used instruments such as questionnaire for the employees of the firms and the interview guide for managers. The conclusion and recommendation drawn from this study were focused on addressing the research questions of the study.
Summary
The study attempted to bring out the financial management challenges faced by the SMEs in accessing the credit facilities, a study in Uasin Gishu County-Kenya. The study was guided by four research questions.
The first research question addressed the debt financing structure of SMEs in Uasin Gishu County. The study revealed that there was lack of collateral or security (72%), cost and duration of loan processing application (73.3%), lack of availability of loan (58%), high interest rates and lack of proper books. These are the serious challenges that the SMEs face when accessing the loan from financial institutions.
The second research question revealed KRA helping the SMEs on filing the tax returns. The computation and remittance of tax to revenue authority has slight improvement of (64%). The finding revealed that there was lack of tax compliance.
The final research question explored the raising of capital to enhance the effectiveness and efficiency of SMEs. Among the challenges faced by SMEs when raising the capital to start or expand the business included lack of personal savings, lack of property and lack of collaterals.
Conclusions
It was concluded from the findings on the financial challenges faced by the small and medium enterprises during the borrowing of loan from financial institutions, it can be concluded that lack of collateral, lack proper documentation, high interest rates, information asymmetric, lack of capital, lack of securable assets, lack of knowledge by finance providers about the nature of participants business, stringent rules and procedures, lack of knowledge about lending criteria, difficulty in finding out about available finance and bureaucracy. It was concluded that SMEs are more disadvantaged in obtaining external finance.
Developing countries in Africa like Kenya have economic imbalances that lead to excess demand for available domestic savings as well as institutional weakness that encourage large number of individuals to engage in low productivity informal activity. Therefore government action is necessary to correct market failures, and also assist potential start-ups and disadvantaged groups in society.
Recommendation
The following recommendations were drawn from the conclusion of the study;
This study recommended that financial institutions should encourage SMEs to keep accurate and up to date accounting records so that they are aware of the financial performance and financial position of their entities, as well as their ability to generate cash. These records also assist when the entities are applying for loans, as lending bodies want to know the financial performance of the entity over a period of time before they can advance a loan. There is need for SMEs to look at other forms of financing, besides loans and reduce reliance on banks. They should look at facilities such as Leasing, Equity issuance, Government subsidiaries, Business Angels, Venture
Capital Trust Fund (VCTF) and Micro Finance and Small Loans Centre (MASLOC) set up by the state to assist them in terms of finance.
Financial institutions through innovative initiatives should encourage specific training institutions and NGOs to provide training to SMEs on entrepreneurial, management skills in areas like negotiation skills, writing business plans and proposal, effective records management, basic legal training in law of the country, among others.
Financial institutions should encourage SMEs to form strong associations to champion their course since financial institutions believe that being in association can help them to get the right information about the firms towards gaining financial assistance, to reduce financial institutions inability to trace some SMEs to recover their loans, thereby increasing the risk of defaulting by the firms.
The government should therefore come-up with the seminars to educate the entrepreneurs on the importance computing and remitting taxes to the revenue authority and also to ensure that SMEs have the Kenya Revenue Authority documents such as VAT registration certificate, PIN certificate, tax compliance certificate and annual tax returns and also punishing those individual who evade taxes through fines and penalties.
The study recommended owners of the business should investigate the status of the trade debtors and also effective communication with other business owners. The enterprises to set stringent credit policy and offer discount in order to attempt to speed up the payment of receivables. Establishing the terms of sale to be offered, the firm must evaluate individual applicants and consider the possibilities of bad debt or slow payments using the discriminative analysis model. Also the business owners should seek the legal action to be taken against the defaulter.
which enables a company to collect money on credit sales. Factoring as it is well known will help SMEs breathe in, when it comes to the management of their account receivable because it has numerous benefits.
The study recommended the following for the SMEs; saving and trying to reduce expenditures, attending financial seminars, use of merry go rounds, borrowing from friends at zero interest rates, reducing credit period for the firm’s creditors, obtaining credit facilities from suppliers, ploughing back profits, offering stock as security, consulting with other SMEs owners and joining Sacco [6-9].
Suggestion for Further Research
A significant limitation of this study is that it investigated mainly internal factors. External factors of access to credit were not investigated. External factors such as the economic and legal environments can impact on the access to debt finance from financial institutions. The study focused only on debt finance from financial institutions. Furthermore, the study focused on the demand side of access to debt finance (perception of SMEs) and not the supply side (perception of financial institutions). A survey to turn the coin by examine the obstacles to credit as perceived by providers of funds (financial institutions) and SMEs could help to further confirm the findings of this study.
References
1 Macintosh (2003) The rise of small and medium scale sector: a case of smes in the developing world. London: Heinemann. 2 Gichuki, Jane Anne wangui, Njeri Agres &
Onduba Ibrahim Tirimba, (2014) Challenges facing micro and small enterprises in accessing credit facilities in kangemi harambee market in Nairobi City County’ journal published by international journal of scientific and research Publications, 4(12).
3 Musau, Gideon Enock (2015) Effects of microfinancial institutions’ services on sustainability of small enterprise: A survay of small enterprise in Huruma Esatate Eldoret’ journal published by International Journal of Business and Management Invention, 4(1):12-31.
4 Mensah, Kofi. Henry, Azinga Samuel Awuni & Sodji Mawuena (2015) Challenges faced by small and medium-size enterprises in accessing credit facilities from financial institutions: an empirical assessment incorporating the perceptions of both borrowers and financiers in Ghana’, journal published by International Journal of Economics, Commerce and Management. 3(11).
5 Hasnah Saniza, K. Jayaraman & Ishak (2013) Factors influencing small and medium enterprises (SMEs) in obtaining loan. Peninsular Malaysia. Unpublished Journal.
6 Abor J, Quartey A (2010) Issues in SME Development in Ghana and South Africa. International Research Journal of finance and Economics, 39(6):215-228.
7 Cofie, Alfred Addotei (2012) The challenges of financing small and medium scale enterprises (smes) in the Ashanti region a case study of stanbic bank (gh) ltd. Ghana. Unpublished.
8 Gacuiri & Henry (2013) Challenges of credit faced by youth entrepreneurs in Makuyu Division, Murang’a County-Kenya. Master student in Entrepreneurship, Jomo Kenyatta University of Agriculture and Technology, School of Human Resource Development, Entrepreneurship and Procurement Department, Nairobi, Kenya. Unpublished.