International Journal Advances in Social Science and Humanities
Available Online at:
www.ijassh.com
RESEARCH ARTICLE
An Analysis of the Effect of Students’ Geographical Background on
Equity in Form One Admission in National Secondary School
Clusters in Kenya
Wakwabubi Simon, Musera Geoffrey Ababu
Masinde Muliro University of Science and Technology, P.O. Box 190-50100, Kakamega, Kenya.
*Corresponding Author: Email: [email protected] and [email protected]
Abstract: Through its educational policies and plans, Kenya is among countries whose aim is to achieve equity in access to secondary school education by pupils from different background as envisaged in Vision 2030 and Sustainable Development Goals. However, this dream still remains elusive. This paper provides empirical evidence of the effect of students’ geographical background on equity in form one admission in national secondary school clusters in Kenya using data from a sample of 1935 form one students admitted in Kenyan’s 103 national secondary schools in the year 2016. The results of the multinomial logistic regression indicate that even after holding other predictor variables constant, students’ geographical background significantly affected their admission to the national secondary schools clusters. Consequently, there is need to develop sound and inclusive strategies to accelerate equity in form one admission to national secondary school clusters irrespective of geographical background of the students. The Ministry of Education should design policies that equalise opportunities for students from different geographical background in accessing all national secondary schools clusters.
Keyword: Students’ Geographical Background, Equity, Form One Admission, National Secondary School Clusters.
Article Received: 01 Oct. 2018 Revised: 12 Oct. 2018 Accepted: 20 Oct. 2018
Introduction
The education level in the population has been found to be important determinant of regional economic growth. Using historical evidence from 19th century Prussia, show that educational differences causally explain regional income differences, and also found that pre-industrial regional differences in basic education explain a significant part of regional differences in industrialization. Ciccone and Papaioannou [1] provide evidence of a substantial impact of education on regional growth in modern economies.
Direct evidence on the link between growth and school structure is scarce, but Andersson et al. [2] find that decentralization of Swedish higher education increased regional innovation and productivity growth. Thus, geographical constraints on educational choices may be an important determinant of regional differences in education levels and subsequently regional growth.
Secondary education is widely seen as one of the most promising avenue for individuals to realize better, more productive lives and as
one of the primary drivers of national economic development. Since independence, the Government of Kenya has been committed to reviewing her education policies, planning and tackling emerging issues with a view of enhancing equity, quality, and relevance of education, and access to educational opportunities. Equity in education has two dimensions. The first is fairness, which basically means making sure that personal and social circumstances for example geographical background, gender, socio-economic status or ethnic origin should not be an obstacle to achieving educational potential.
and retention rates than students from metropolitan areas [5].
Despite an adequate number of educational facilities in rural and remote Australia, school children from these areas remain disadvantaged by other factors. Issues affecting access to education in regional areas include costs, the availability of transport and levels of family income support. In addition, inequity exists with regard to the quality of the education that rural students receive, often as a result of restricted and limited subject choice. Furthermore, students may also have limited recreational and educational facilities within their schools. Study by Farooq [6] on Factors Affecting Students’ Quality of Academic Performance: A case of secondary school level found that there are three major geographical aspects that influence the educational system directly.
These are, climatic conditions, population distribution and land configuration. In regard to climatic conditions they influence the system of education in terms of, content of education depend on the continental climate, for example, training of doctors in the tropics is likely to emphasize more on tropical disease like malaria. Extreme low temperatures in Continental Europe, affects accessibility to school by young children. Temperatures also affect the time at which schools can reasonably begin in the morning and when they end.
In Norway, for example, the sun does not rise during winter until ten o'clock in the morning and often temperatures fall to negative 20 degrees. Thus in the Scandinavian countries there are no infant schools or early childhood education departments in some schools because of extreme temperatures. Climatic conditions also influence the education system in relation to time of vacations.
In North America and many countries in Europe take school vacations during cold winter and others during hot summer. In hot climatic conditions especially experienced in arid and semi-arid areas, learning often takes place during morning hours when it is cool. When it is hot in the afternoon very little learning takes place due to excessive heat. In regard to population distribution, which is often as a result of geographical influence also affects the educational system.
Generally, worldwide, population is either concentrated in the urban centers, or scattered in the country side. For example, Australia has two systems of education, that is, one for the urban areas and the other for rural areas. In the urban areas there are Well-equipped schools with adequately
qualified teachers and administrative
personnel. While in the rural areas, schools are small with one teacher for ten up to forty students.
This is because farms are far from the nearest schools and daily attendance is difficult. Therefore, the central government is responsible for their administration and financing. The government also provides the means and organization of correspondence, tuition and traveling teachers. As such most
students receive education through
correspondence and occasional visits by the traveling education inspectors.
In regard to land configuration, this also influences the education system in terms of architectural structure of farm houses, school buildings, village location and also the whole way of life and thinking of people because of the rigours of the climate, in some cases, because of closeness of family ties, boarding schools for children are non-existence, except for the few who come from far and inaccessible places on daily basis.
By and large land configuration determines settlement and location of schools. In European countries, school location and student performance, however, are not strongly related after accounting for
socioeconomic differences in Belgium,
Finland, Germany, Greece, Iceland, Ireland, Israel, the Netherlands, Poland, Sweden, the United Kingdom and the United States and in the partner countries and economy Croatia, Dubai (UAE), Montenegro, the Russian Federation and Serbia.
affect the decision to participate in full-time upper secondary schooling.
The authors find, however, that distance matters for pupils whose grades were mediocre during compulsory education: as the distance to closest school providing academic education increases, these students are less likely to participate in post-compulsory education in general and tend to switch to vocational education. Similarly, they found evidence that distance matters for
individuals that have disadvantaged
backgrounds.
Becker and Siebern-Thomas [8] find that the supply of high schools is higher in urban areas in Germany and this pattern motivates their use of living in urban vs.
Rural areas during childhood as an
instrumental variable for educational
attainment in earnings equations. To their knowledge, the only paper providing a detailed investigation of the effect of distance between home and school on upper secondary education participation is, using data from the U.K. On average, the closeness to the nearest school does not affect the decision to participate in full-time upper secondary schooling.
The authors find, however, that distance matters for pupils whose grades were mediocre during compulsory education: as the distance to closest school providing academic education increases, they are less likely to participate in post-compulsory education in general and tend to switch to vocational education. Similarly, they find
evidence that distance matters for
individuals that have disadvantaged
backgrounds. Ferge, [9] carried out a study in Hungary on the effects of the type and quality of school on future opportunities for children.
The findings show that, the standards of education in rural areas remained below those of urban areas causing disparity in performance due to lack of adequate equipment. As a result, there arose regional inequality between the rural and urban areas. In another study by Mlozi [10] on distribution of educational facilities it was concluded that, the facilities available to the newly independent African countries in early
1960s were unequally distributed between geographical areas.
In Kenya and Tanzania for example, distribution of educational facilities and expenditure favoured minority groups like urban areas, areas of mission settlement and areas of colonial interests leading to disparity in distribution of educational resources. Impacts of location of school to students include; absenteeism, dropout rates, early pregnancies and early pregnancies. Amitava, et al., [11] contend that location of school affects performances of students which results into poor attendance, resulting in low achievement, increases the dropout rate, and amplifies a host of social problems.
In connection to this the altitudes of students towards school become demoralized due to the location of school. Most of school in the areas of study is situated in rural (remote areas) such location hinders and decrease altitudes of students to continue with their study. Hijazi and Naqvi,[12] held the view that student’s performance is “associated with students’ profile like his attitude towards class attendance, time allocation of studies, paren’s level of income, mothe’s age and mother’s education”.
Not only performances, but also location of school accelerates many social issues as commented by Yusuf, M. A. and Adigun, J. T. [13] that poor attendance not only hinders academic achievement but also promotes a poorly educated society and thus leads to many negative social problems. Equity in access to education requires that the costs and benefits of education be equitably distributed among regions, gender, different socio-economic and ethnic groups[14].
Research findings indicate that performance in KCPE among pupils who live in the informal neighborhoods is low compared with those of pupils who live in the formal neighborhoods [15]. For instance, the average KCPE score for students from Korogocho and Viwandani of Nairobi in 2006 was 238 points out of a possible 500.This was 34 points lower than Nairobi province’s average score of 272.
performance and retention rates than students from metropolitan areas disparity in performance due to lack of adequate equipment. However, these studies were conducted in locations outside Kenya. In another study by Mlozi[ 10] on distribution of educational facilities it was concluded that, the facilities available to the newly independent African countries in early 1960s
were unequally distributed between
geographical areas.
In Kenya and Tanzania for example, distribution of educational facilities and expenditure favoured minority groups like urban areas, areas of mission settlement and areas of colonial interests leading to disparity in distribution of educational resources. This study did not look at these factors have affected admission to various categories of schools. Findings by Epari et al [15] indicated that performance in KCPE among pupils who live in the informal neighborhoods is low compared with those of pupils who live in the formal neighborhoods.
For instance, the average KCPE score for students from Korogocho and Viwandani of Nairobi in 2006 was 238 points out of a possible 500.This was 34 points lower than Nairobi province’s average score of 272.This study looked at performance in KCPE but this study sought to determine the effect of students’ geographical background on form one admission in national secondary school cluster in Kenya.
Moreover, while the existing evidence clearly
suggests that distance matters for
participation in secondary school decisions, numerical effects vary substantially between different studies. In addition, there is very limited evidence on the impact of geographical location on admission to secondary schools which is the domain of this study.
Currently Kenya operates three levels of public secondary schools existing in a hierarchical manner, namely; National, County and Sub-county secondary schools. National secondary schools are categorized into cluster 1,2,3, and 4. Cluster 1 is the former provincial secondary schools that were performing very well in Kenya Certificate of Secondary Education (KCSE). Cluster 2 and 4 are mainly former provincial secondary schools found in marginalized
areas. Cluster 3 are the original 18 national secondary schools.
In terms of Kenya Certificate of Secondary Education (KCSE) performance, national schools perform far better than schools in other categories. For instance, recent figures show that on average students in national schools scored a mean score of 9.6 out of a possible 12. Besides, 90 per cent of students in national schools scored at least a mean grade of C+ with a nil gender gap [16]. Due to this comparative edge in KCSE examination performance and the fact that national schools are considered elite and prestigious public secondary schools in the country there is cutthroat competition for admission into national schools.
Moreover, the bruising competition has gone further to national school clusters where some parents feel that the recently upgraded national secondary schools are not as good as the eighteen earlier ones in cluster 3, in terms of facilities and teachers [17].
This competition has elicited intense public debate over which student joins cluster 1, 2, 3 or 4 of national schools in Kenya. A section of the public argues that some national schools clusters admit a larger proportion of students from certain counties. To promote equity in form one selection, the Kenya Ministry of Education employs a system based on merit, quotas, affirmative action and student choice [18].
Although form one admission to national schools criterion is based merit, student choice and affirmative action, serious concerns have been registered in relation to the form one selection criterion. For instance, the catholic Bishops in Kenya claim that the selection criteria and especially the quota system discriminate against pupils from private schools [19].
While the numbers and percentages of students admitted to all categories of secondary school are known, little is known about the effect of students’ geographical background on admission into national secondary schools clusters in Kenyan. This paper reports findings of how students’
geographical backgrounds affect their
admission to national schools clusters in Kenya. The empirical results seeks to address arguments of a section of the public that there is no equity in accessing National Secondary School clusters in Kenya which is against the education goal of enhancing social equity through education.
Methodology
The paper utilized stratified, Probability Proportion to Size (PPS) and simple random sampling techniques to draw a sample of 1,935 from a population of 20,650 form one students of the year 2016 in the 103 national secondary schools in Kenya. Kenya is a country in Africa and a founding member of the East African Community (EAC). Its capital and largest city is Nairobi.
Kenya's territory lies on the equator and overlies the East African Rift covering a diverse and expansive terrain that extends roughly from Lake Victoria to Lake Turkana and further south-east to the Indian Ocean. It is bordered by Tanzania to the south, Uganda to the west, South Sudan to the north-west, Ethiopia to the north and Somalia to the north-east. Kenya covers 581,309 km2 (224,445 sq mi), and had a
population of approximately 45 million people in July 2014.
The climate of Kenya varies by location; from mostly cool every day, to always warm/hot. The climate along the coast is tropical. This means rainfall and temperatures are higher throughout the year. At the coastal cities, Mombasa, Lamu and Malindi, the air changes from cool to hot, almost every day. The further inside Kenya, the more arid the climate becomes. An arid climate is nearly devoid of rainfall, and temperature swings widely according to the general time of the day/night.
For many areas of Kenya, the daytime temperature rises about 25oC, almost every
day. There are at least 2 national secondary schools in every county giving a total of 103 national schools across the country with a
student population of 81,230 established for
purposes of stimulating educational
excellence as well as fostering national cohesion. The 103 national schools are categorized into four clusters with cluster 1, 2, 3 and 4 having 30, 25, 18 and 30 national secondary schools. Before embarking on data collection the authors used face and content
analysis to validate the student’s
questionnaire and further ensured its reliability using the test-retest technique.
The (r) coefficient of 0.85 was large enough to surpass the set threshold of r = 0.7. The authors utilized 47 counties in Kenya to categorise form one students in national secondary schools into different geographical background.
The authors also collected data on form one student’s secondary school cluster (cluster 1, cluster 2, cluster 3 and cluster 4). Besides, the authors collected data on form one student’s demographic background (age, gender, disability, KCPE scores and admission status). The student geographical background was the explanatory variable, their national secondary school cluster was
the outcome variable while their
demographic data was the control variable.
This paper uses this data to test the null hypothesis that a student’s geographical background has no statistically significant effect on their form one admission in national secondary school cluster in Kenya. A sequential multinomial logistic regression was fitted to model the effect of students’ geographical background on admission in national schools clusters.
Result and Discussion
The authors preferred Multinomial Logistic Regression (MLR) because the outcome variable is a four level categorical variable and it allowed simultaneous comparison of more than one alternative. That is, the Relative Risk Ratio (RRR) of the alternatives was estimated simultaneously by comparing admission to cluster one, cluster two and cluster four national schools with that in cluster three national schools which was the reference category (base category).
national secondary schools and cluster four versus cluster three national secondary schools. Multinomial logistic regression gave separate coefficient estimates for each independent variable for each category of comparison. The estimated coefficients represented the relative risk of being in the comparison category versus being in the base category associated with a one-unit increase in the independent variable. The multinomial logistic model in this study took the form:
Where i is the ith individual, yi is the
observed outcome, Xi the independent variables and βj are the beta coefficients that are estimated using maximum likelihood. Once the coefficients are exponentiated they give odds ratios (OR) reported as the RRR in MLR. The beta coefficients βj are interpreted as the increase in Relative Risk Ratio of being in category j vs the base category resulting from a one-unit increase in the ith
covariate, holding the other covariates constant.
In this case, βj are the increases in relative risk of admission clusters one, cluster two
and four national secondary schools vs admission to cluster three national secondary schools. To be able to fit the multinomial logistic regression, the authors first established which variables to pursue in the model by establishing the association between national school clusters and the geographical background of the respondents using a Chi-square test statistic.
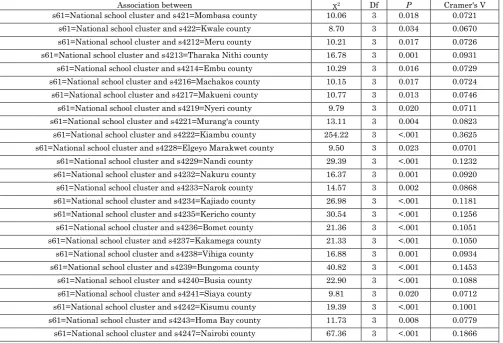
The Chi-square results in Table 4 in appendix indicate that in more than half of the counties 25(53%) out of 47 there was a statistically significant association between predictor variable (Geographical background) and the outcome variable (national school cluster). The Chi-square results (χ2 (3, 1935)
=254.22, p=<.001 and Cramer's V value of 0.362) suggested that there is significantly moderate association between Kiambu county and national secondary school clusters.
The rest of statistically significant counties had a weak association between national school clusters and students’ geographical background. Since these 25 counties were statistically significant, these were modeled in the MLR model to establish their effect on admission to national secondary school clusters. The MLR results are presented in Table 1.
Table1. MLR Relative Risk Ratios for the Effect of Geographical Background on Admission to the Four National School Clusters
Varia
ble Variable label
Cluster 1 vs Cluster 3 Cluster 2 vs Cluster 3 Cluster 4 vs Cluster 3
Model 1
(s61) Model 2 (s61) Model 1 (s61) Model 2 (s61) Model 1 (s61) Model 2 (s61) RR
R p
RR
R p
RR
R P
RR
R p
RR
R p
RR
R p
s421 Mombasa 1.22 0.73 1.04 0.94 1.22 0.73 1.04 0.94 2.3 0.106 2.01 0.181
s422 Kwale 2.37 0.288 2.32 0.307 2.37 0.288 2.32 0.307 0.3 0.332 0.25 0.268
s4212 Meru 0.7
6 0.5
85 0.7
3 0.5
34 0.7
6 0.5
85 0.7
3 0.5
34 0.0
8 0.0 16
0.0 9
0.0 22 s4216 Machakos 0.2 0.017 0.19 0.014 0.2 0.017 0.19 0.014 0.06 0.008 0.06 0.007
s4217 Makueni 0.19 0.043 0.2 0.048 0.19 0.043 0.2 0.048 0.09 0.023 0.1 0.036
s4221 Murang'a 0.1
7 0.0
07 0.1
8 0.0
1 0.1
7 0.0
07 0.1
8 0.0
1 0.0
5 0.0 04
0.0 5
0.0 03 s4222 Kiambu 0.07 <.001 0.08 <.001 0.07 <.001 0.08 <.001 0.03 <.001 0.02 <.001
s4228 Elgeyo-Marakwet 2.03 0.391 2.45 0.28 2.03 0.391 2.45 0.28 3.94 0.074 4.25 0.061
s4229 Nandi 2.71 0.13 3.19 0.078 2.71 0.13 3.19 0.078 1.21 0.788 1.42 0.627
s4234 Kajiado 0.2 <.001 0.21 <.001 0.2 <.001 0.21 <.001 0.09 <.001 0.08 <.001
s4235 Kericho 3.9
5 0.0
03 4.6 0.0
01 3.9
5 0.0
03 4.6 0.0
01 3.9
4 0.0 03
3.9 5
0.0 03 s4237 Kakamega 3.77 0.002 4.01 0.001 3.77 0.002 4.01 0.001 1.99 0.123 1.61 0.29
s4238 Vihiga 3.38 0.058 3.32 0.063 3.38 0.058 3.32 0.063 4.24 0.021 4.34 0.02
1 23 3 19 1 23 3 19 3 06 8 61
s4240 Busia 7.78 0.006 8 0.006 7.78 0.006 8 0.006 9.09 0.003 7.63 0.006
s4241 Siaya 1.76 0.296 1.69 0.34 1.76 0.296 1.69 0.34 1.58 0.399 1.6 0.39
s32 1=Student's primary school was within municipality
0.8 9
0.4 25
0.8 9
0.4 25
0.9 5
0.7 46 s33 1=Student's primary school was single sex 2.07 <.001 2.07 <.001 1.01 0.948
s52a Student's age in years 0.9 0.1
72 0.9
0.1 72
1.1 2
0.1 62
s55 1=Student is disabled 2.24 0.007 2.24 0.007 2.54 0.002
s56 Respondent's admission status (Ref. 1=1st selection)
2=2nd selection 1.7
3 0.004 1.73 0.004 2 <.001
3=Sought for admission 0.69 0.064 0.69 0.064 1.71 0.004
Consta
nt 1.48 0.001 6.45 0.124 1.64 <.001 29.31 0.007 1.65 <.001 0.24 0.234
N 1935 1935 1935
LR chi2(df); Value (57)
588 <.0
01 (75
) 750
<.0 01
(57 ) 588
<.0
01 (75) 750 <.001 (57
) 588
<.0 01
(75 ) 750
<.0 01
Pseudo R2 0.1096 0.1400 0.1096 0.1400 0.1096 0.1400
Note. LR=Likelihood Ratio; df=degrees of freedom; RRR=Relative Risk Ratio Source: Stata Output, 2018
The results in Table 1 for Cluster 1 vs Cluster 3 indicate that even after holding all other predictor variable constant, the relative risk ratio of being in cluster1 relative to cluster 3 for a student from six counties decreased. These counties were: Machakos by -0.19 (p=0.014), Makueni by -0.20 (p=0.048), Murang’a by -0.18 (p=0.01), Kiambu by -0.08 (p=<.001), Kajiado by -.21 (p=<.001) and Nairobi by -0.39 (p=<.001). However, there was an increase RRR after holding all other predictor variables in the model constant, in Kericho by 4.60, -0.19, (p=0.001), Kakamega by 4.01, (p=0.001), Bungoma by 2.83, (p=0.019), Busia by 8.00, (p=0.006) and Kisumu by3.39, (p=0.036).
Holding all other predictor variables in the model constant, the relative risk ratio of being in cluster 1 relative to cluster 3 for a student who was in a single sex primary school relative to the one in a co-educational increased by up to 2.07, (p=<.001). Similarly, holding all other predictor variables in the model constant, the RRR of being in cluster 1 relative to cluster 3 for a student who is disabled increases by up to 2.24 units, (p=0.007) and for a student who was in the second selection RRR increases by up to 1.73 times, (p=0.004).
The rest of the covariates were not statistically significant. The results in Table 1 for Cluster 2 vs Cluster 3 revealed that students from Bungoma, Nandi and Vihiga counties, with their RRR being 6.151
(p=0.013), 5.87 (p=0.005), and 4.29 (p=0.02) respectively were more likely to be admitted in cluster 2 relative to cluster 3 if all other predictor variables are held constant. In addition, students who were disabled, with RRR of 2.06 (p=<0.016) and those admitted by 2nd selection, with RRR of 2.08 (p=<.0001)
are likely to be admitted in cluster 2 relative to cluster 3. However, students from Kiambu county, with RRR of up to 0.12 (p=<0.001), and Nairobi county, with RRR of up to 0.17 (p=<.001) are least likely to be admitted in cluster 2 relative to cluster 3 when holding all other predictor variables in the model constant.
Holding all other predictor variables in the model constant, the relative risk ratio of being in cluster 2 relative to cluster 3 for a student who sought for admission relative to the one in the first selection decreased by up to -0.58 (p=0.007). Further, the results in Table 1 for cluster 4 vs cluster 3 suggested that holding all other predictor variables in the model constant, the relative risk ratio of being in cluster 4 relative to cluster 3 for a
student from the following counties
decreases: Meru, 0.09 (p=0.022), Machakos -0.06 (p=0.007), Mkueni -0.10 (p=0.036), Murang’a -0.05 (p=0.003), Kiambu -0.02 (p=<.001), Kajiado -0.08 (p=<.001) and Nairobi 0.28 (p=<.001).
relative to cluster 3 for a student from the following counties increased: Kericho 3.95 (p=0.003), Vihiga 4.34 (p=0.02), Busia 7.63 (p=0.006) and Kisumu 4.38 (p=0.007). in addition, the results in Table 1 indicate that holding all other predictor variables in the model constant, the relative risk ratio of being in cluster 4 relative to cluster 3 for a student who is disabled relative to the one who is not increases by up to 2.54, (p=<0.001). Also, holding all other predictor variables in the model constant, the relative risk ratio of being in cluster 4 relative to cluster 3 for a student who was in the second selection relative to the one in the first selection increases by up to 2.00 units, (p=<.001) and for a student who sought for
admission relative to the one in the first selection, the RRR increases by up to 1.71 units, (p=0.004). The rest of the covariates are not statistically significant. These findings suggested that, students from Busia County are most likely to be admitted to cluster 4 relatives to cluster 3 while those from Kiambu are least likely to be admitted to the same cluster relative to cluster 3. Besides, the authors fitted a mlogit of national school clusters and student’s
geographical background to establish
whether the MLR full model was statistically significant. Table 2 presents measures of fit for mlogit of national school clusters and student’s geographical background.
Table 2: Measures of Fit for mlogit of National School Clusters, Objective 3
Log-Lik Intercept Only: -2681.83 Log-Lik Full Model: -2306.43
D(1831): 4612.87 LR(75): 750.80
Prob > LR: 0.00
McFadden's R2: 0.14 McFadden's Adj R2: 0.10
Maximum Likelihood R2: 0.32 Cragg & Uhler's R2: 0.34
Count R2: 0.32 Adj Count R2: 0.09
AIC: 2.49 AIC*n: 4820.87
BIC: -9243.89 BIC': -183.21
Note. AIC = Akaike Information Criterion; BIC = Bayesian Information Criterion; Adj = Adjusted; LR = Likelihood Ratio; Lik = Likelihood
Source: Stata Output, 2018
The measures of fit for mlogit of national school clusters and student's geographical background test in Table 2 shows that our full model is statistically significant (p=<.001) and about 0.34 (34.0%) (Cragg & Uhler's R2) of outcome variability (national school clusters) could be explained by predictor variables (student’s geographical background and control variables) used in the full model. In addition, the authors’ established the average marginal effect of each of the regress or variables on the probability of each of the four national school
clusters. The marginal effects were used to
determine increases/decreases in the
probability of selecting an alternative in outcome variable, based on a certain predictor variable, expressed as a percent. A positive marginal effect implies an increase in probability of admission while a negative marginal effect implies a decrease in probability of admission to national school cluster. Table 3 presents the average marginal effect of each of the regress or variable on the probability of each of the four national school clusters.
Table 3: The Average Marginal Effect of each Regress or on the Probability of each of the Four National School Clusters.
Varia
ble Variable label
Cluster 1 Cluster 2 Cluster 3 Cluster 4
dy/ dx
Std.
Err P
dy/ dx
Std.
Err P
dy/ dx
Std.
Err p
dy/ dx
Std.
Err p
s421 Mombasa
-0.0
5
0.08 0.56 1
-0.0
3
0.08 0.71 6
-0.0
4
0.08 0.5 99
0.1 2 0.06
0.0 51
s422 Kwale 0.3
7 0.14 0.00
7 -0.2
4
0.21 0.27 0.0 9 0.14
0.5 22
-0.2
2
0.2 0.2 64
s4212 Meru 0.2
5 0.12 0.03
3 -0.1
8
0.16 0.26 2
0.2 4 0.09
0.0 08
-0.3
1
s4216 Machakos
-0.0
5
0.15 0.75 0.0 7 0.12
0.54
7 0.3 0.08 <.0
01 -0.3
3
0.19 0.0 86
s4217 Makueni
-0.1
7
0.17 0.29 5
0.2 7 0.11
0.01
5 0.2 0.09 0.0
26
-0.3 0.19 0.1 19
s4221 Murang'a
-0.0
7
0.14 0.60 5
0.1 8 0.11
0.10 7
0.2 9 0.08
<.0 01
-0.3
9
0.19 0.0 38
s4222 Kiambu
-0.0
8
0.07 0.22 2
0.0 2 0.06
0.76 9
0.4 4 0.04
<.0 01
-0.3
8
0.08 <.0 01
s4228 Elgeyo-Marakwet 0.0
2 0.1
0.83 2
-0.0
1
0.1 0.92 1
-0.1
6
0.12 0.1 71
0.1 5 0.08
0.0 46
s4229 Nandi 0.0
8 0.08 0.32
8 0.2
3 0.06 <.00
1 -0.1
8
0.1 0.0 66
-0.1
3
0.09 0.1 21
s4234 Kajiado
-0.0
4
0.09 0.62 3
0.0 1 0.08
0.88 8
0.2 9 0.05
<.0 01
-0.2
5
0.1 0.0 1
s4235 Kericho 0.1
7 0.05 0.00
1 -0.0
8
0.06 0.18 -0.1
9
0.07 0.0
06 0.1 0.04 0.0 22
s4237 Kakamega 0.1
8 0.05 <.00
1 0.0
4 0.05 0.47
2 -0.1
5
0.07 0.0 2
-0.0
7
0.05 0.1 71
s4238 Vihiga 0.0
3 0.07 0.65
4 0.1 0.06 0.10
2 -0.2
2
0.1 0.0 22
0.0 9 0.06
0.1 11
s4239 Bungoma 0.1 0.05 0.06
3 0.2
1 0.05 <.00
1 -0.1
4
0.07 0.0 34
-0.1
7
0.06 0.0 03
s4240 Busia 0.1
4 0.07 0.03
4 0.0
7 0.06 0.24
3 -0.3
2
0.11 0.0 05
0.1 1 0.06
0.0 57
s4241 Siaya 0.1
7 0.08 0.04
1 -0.3
1
0.12 0.01 1
0.0 1 0.08
0.8 9
0.1 3 0.07
0.0 8
s32 1=Student's primary school was within municipality
-0.0
7
0.02 0.00 2
0.0 7 0.05
0.16 8
-0.2
1
0.08 0.0
11 0.1 0.05 0.0 46
s33 1=Student's primary school was single sex
0.1 2 0.03
<.00 1
-0.3 0.15 0.03
9 -0.0
2
0.09 0.8 48
0.0 8 0.09
0.3 68
s52a Student's age in years
-0.0
1
0.01 0.32 6
-0.1
9
0.04 <.00 1
0.2 1 0.03
<.0 01
-0.0
6
0.03 0.0 9
s55 1=Student is disabled 0.0
4 0.04 0.28
1 0.0
2 0.04 0.63
7 -0.0
2
0.02 0.2 36
-0.0
4
0.02 0.0 53
1=1st selection)
2=2nd selection 0.0
1 0.03 0.81 0.0
6 0.03 0.02
8
-0.1 0.03 <.0
01 0.0
4 0.03 0.1 09
3=Sought for admission
-0.0
7
0.03 0.03 1
-0.1
1
0.03 0.00 1
0.0 3 0.03
0.3 43
0.1 6 0.03
<.0 01
Note. n=1935; Marginal effects determined through the Delta-method; dy/dx at the means of the explanatory variables Source: Stata Output, 2018
In the cluster 1, the marginal effects results in Table 3 showed that the probability of admission to cluster 1 national school for students from the following counties increased: Kwale 0.37 (37.0%), Meru 0.25 (25.0%), Kericho 0.17 (17.0%), Kakamega 0.18 (18.0%), Busia 0.14 (14.0%) and Homa Bay 0.24 (24.0%). However, the probability of admission to cluster 1 national school for students from the primary school within the municipality decreases by - .07 (-7. 0%) while the probability of admission to cluster 1 national school for students from the primary school which were single sex increases by 0.12 (12%).
The rest of the covariates in cluster 1 had statistically insignificant average marginal effect. In the cluster 2, marginal effects results in Table 3 showed that, the probability of admission to cluster 2 national school for students from the following counties increases: Makueni 0.27 (27.0%), Nandi 0.23 (23.0%) and Bungoma 0.21 (21.0%). However, the probability of admission to cluster 2 national schools for students from Siaya 0.31 (31%) and Nairobi -0.19 (19.0%) counties decreased.
Moreover, there was an increase in probability of admission to cluster 2 national schools for students from the primary school within the municipality by 0.14 (14.0%) and those admitted on 2nd selection 0.06 (6.0%).
Besides, there was a decrease in probability of admission to cluster 2 national schools for a unit increase in student’s age - 0.04 (4.0%) and those who sought admission by -0.11 (11.0%).
The rest of the covariates in cluster 2 had statistically insignificant average marginal effect. In the cluster 3, marginal effects results in Table 3 suggested that, the probability of admission to cluster 3 national schools for students from the following counties increased: Meru 0.24 (24.0%), Machakosi 0.30 (30.0%), Makueni 0.20 (20.0%), Murang’a 0.29 (29.0%), Kiambu 0.44
(44.0%) and Nairobi 0.21 (21.0%). To be able to test the study hypothesis for objective three this authors further conducted post estimation tests to test the effect of the individual geographical background proxy variables on students’ admission to national secondary schools clusters so as to test the hypothesis that a student’s geographical background has no statistically significant effect on their form one admission in national secondary school cluster in Kenya.
The chi-square results (χ2 (57) = 429.59,
p<.001) of at least one of the counties on admission to the three national schools clusters relative to cluster 3 is statistically significant. Consequently, this study rejected the null hypothesis that a student’s geographical background has no statistically significant effect on their form one admission in national secondary school cluster in Kenya and concludes that controlling for other covariates in the final model, there is indeed a statistically significant effect of the student's home county on admission into the national school clusters.
These findings have suggested that even after holding all other predictor variables in the model constant, the effect of students’ home county on admission to national secondary schools cluster was significant. The study found that students from Nairobi and central region are more likely to be admitted to the most prestigious cluster 3 national secondary schools while other regions may get more admission in clusters 1, 2 and 3. These findings are in tandem with those by Ferge [9] study carried out in Hungary on the effects of the type and quality of school on future opportunities for children.
areas. The findings also agree with a study by Mlozi [10] on distribution of educational facilities and it was concluded that, the facilities available to the newly independent African countries in early 1960s were unequally distributed between geographical areas. In Kenya and Tanzania for example, distribution of educational facilities and expenditure favoured minority groups like urban areas, areas of mission settlement and areas of colonial interests leading to disparity in distribution of educational resources.
The findings also agree with the study by Epari et al., [15] which indicate that performance in KCPE among pupils who live in the informal neighborhoods is low compared with those of pupils who live in the formal neighborhoods (For instance, the average KCPE score for students from Korogocho and Viwandani of Nairobi in 2006 was 238 points out of a possible 500. This was 34 points lower than Nairobi’s region average score of 272.
The education level in the population has been found to be important determinant of regional economic growth. Using historical evidence from 19th century Prussia, show that educational differences causally explain regional income differences, and also found that pre-industrial regional differences in basic education explain a significant part of regional differences in industrialization. Ciccone and Papaioannou [1] provide evidence of a substantial impact of education on regional growth in modern economies. Direct evidence on the link between growth and school structure is scarce, but Andersson et al. [2] find that decentralization of Swedish higher education increased regional innovation and productivity growth.
Thus, geographical constraints on
educational choices may be an important determinant of regional differences in education levels and subsequently regional growth. These results imply that regional
disparities in terms of educational
achievements and consequently economic
empowerment is likely to be exacerbated by the current national secondary school admission criterion. Some regions like Nairobi and Central region take a bigger proportion of their students to national schools compared to other regions. This could be due to these regions having well-resourced primary schools and therefore they are able to post higher KCPE scores, which is the main determinant of admission to national schools, compared to other regions.
In addition, national schools in this region might have created additional streams for the local students. Also these larger proportions in Nairobi and Central region could be because students from this region access bursaries and scholarships more than other regions and therefore majorities are able to join national schools. This unproportioned distribution of students in national schools from different regions may make some region lack behind in many aspect of development.
Conclusions and implications for policy The MLR results showed that the effect of students’ home county on admission to national secondary schools cluster was significant. The study findings indicate that students from Nairobi and central region are more likely to be admitted to the most prestigious cluster 3 national secondary schools while other regions may get more admission in clusters 1, 2 and 4.
It was therefore concluded that there exists inequities in students admission in the national secondary school clusters based on their geographical counties with students in Nairobi and central region dominating the prestigious schools in cluster 3.The findings therefore suggest the need for concerted effort by the ministry of education through its policies to equalise opportunities for all learners to be admitted in any of the four national school clusters irrespective of the county they come from. This may address the existing regional differences in educational attainment and job opportunities.
References
1.Ciccone A, E Papaioannou (2009) Human capital, the structure of production, and Growth, Review of Economics and Statistics 91:66-82. 2.Andersson R, JM Quigley, M Wilhelmsson (2009)
Urbanization, productivity, and innovation:
Evidence from investment, Journal of Urban Economics 66:2-15
978-92- http://www.academicjournals.org/ERR64-03259-0, € 24, 155.
4.Chiuri LW, Kiumi JK (2005) Planning and Economics of Education. Egerton.
5.Cheers B (2000) Rural disadvantage in Australia. Australian Social Work, 3(1):5-13. 6.Farooq MS (2011) Factors Affecting Students’
Quality of Academic Performance: A case of secondary school level; Journal of Quality and Technology Management.VII
7.OECD (2011) “Does where a student lives affect his or her reading performance?” in PISA 2009 at
a Glance, OECD Publishing.
http://dx.doi.org/10.1787/9789264095250-24-en 8.Becker SO, F Siebern-Thomas (2007) Schooling
infrastructure, educational attainment and earnings. Mimeo.
9.Ferge Z (1980) ‟Regional Disparity of Education Development in Hungary‟. In Regional Disparity in Educational Development: Diagnosis & Policies for Reduction, UNESCO: IIEP, Paris. 10. Mlozi MRS, Kaguo FE, Nyamba SY (2013)
Factors Influencing Students’ Academic Performance in Community and Government Built Secondary Schools in Tanzania: A case of Mbeya Municipality; .
11. Amitava R, Manojit D, Saswata S, Braja GM (2010) Factors Affecting Students’ Academic Performance: A case study in Agartala Municipal Council Area. Journal of Sociology; Volume 7, Number 2. Bangladesh.
12. Hijazi ST, Raza Naqvi SMM (2006) Factors Affecting Students’ Performance: A case of Private Colleges, Bangladesh E-Journal of Sociology, 3-1.
13. Yusuf MA, Adigun JT (2010) the influence of school sex, location and type of students’ academic performance. International Journal of education Science. (2):81-85.
14. Psacharapoulos G, Woodhall M (1985) Education for Development. An Analysis of Investment choice, Washington D.C.: Oxford University Press.
15. Epari E, Maurice M, Alex E, Moses E, Moses O, Moses N (2011) Factors Associated With Low Achievement Among Students From Nairobis Urban Informal Neiborhoods .Urban Education,
42(5):1056
-1077.doi:10.1177/0042058911400323.
16. Onderi H, Makori A (2014) Understanding Realities, inequalities and implications associated with policy and practice in form one selection in secondary schools in Kenya. British Journal of Arts and Social Science. 17(1):146-164. Retrieved on 30/05/2017 from http://www.bjournal.co.uk/BLASS.aspx
17. Muindi B (2012) Parents doubt new national schools. Daily Nation, January 15th2012.[URL:http://www.nation.co.ke/News/pa
rents+doubt+new+national+schools+/-/1056/1306220/-/7y2xw1z/-/index.html (Accessed on03/03/2017)]
18. In2 East Africa (2013) Kenya: Form one intake puzzle after end of ranking order. www.in2eastafrica.net/kenya-form-one-intake-puzzleafter- end-of ranking-order.
19. Catholic News Agency for Africa (CANAA) (2015) www.canaafrica.org/ index.php/home/16-
latestnews/192-church-in-kenya- antsgovernment-to-review-criteria-for-secondary-school-admission.
20. Alari OJ, Migosi J, Evusa Z (2013) Teachers’ and students’ perceptions about form one placement of students in public secondary schools in Mumias Division, Kakamega County, Kenya. Universals J. du .General Studies, 2(5):167- 174.
Appendices 1
Table 4: Chi-square Association Between the Outcome Variable and Statistically Significant Counties.
Association between χ2 Df P Cramer's V
s61=National school cluster and s421=Mombasa county 10.06 3 0.018 0.0721
s61=National school cluster and s422=Kwale county 8.70 3 0.034 0.0670
s61=National school cluster and s4212=Meru county 10.21 3 0.017 0.0726
s61=National school cluster and s4213=Tharaka Nithi county 16.78 3 0.001 0.0931
s61=National school cluster and s4214=Embu county 10.29 3 0.016 0.0729
s61=National school cluster and s4216=Machakos county 10.15 3 0.017 0.0724
s61=National school cluster and s4217=Makueni county 10.77 3 0.013 0.0746
s61=National school cluster and s4219=Nyeri county 9.79 3 0.020 0.0711
s61=National school cluster and s4221=Murang'a county 13.11 3 0.004 0.0823
s61=National school cluster and s4222=Kiambu county 254.22 3 <.001 0.3625
s61=National school cluster and s4228=Elgeyo Marakwet county 9.50 3 0.023 0.0701
s61=National school cluster and s4229=Nandi county 29.39 3 <.001 0.1232
s61=National school cluster and s4232=Nakuru county 16.37 3 0.001 0.0920
s61=National school cluster and s4233=Narok county 14.57 3 0.002 0.0868
s61=National school cluster and s4234=Kajiado county 26.98 3 <.001 0.1181
s61=National school cluster and s4235=Kericho county 30.54 3 <.001 0.1256
s61=National school cluster and s4236=Bomet county 21.36 3 <.001 0.1051
s61=National school cluster and s4237=Kakamega county 21.33 3 <.001 0.1050
s61=National school cluster and s4238=Vihiga county 16.88 3 0.001 0.0934
s61=National school cluster and s4239=Bungoma county 40.82 3 <.001 0.1453
s61=National school cluster and s4240=Busia county 22.90 3 <.001 0.1088
s61=National school cluster and s4241=Siaya county 9.81 3 0.020 0.0712
s61=National school cluster and s4242=Kisumu county 19.39 3 <.001 0.1001
s61=National school cluster and s4243=Homa Bay county 11.73 3 0.008 0.0779
s61=National school cluster and s4247=Nairobi county 67.36 3 <.001 0.1866