Research Article
a
April
2018
Special Issue: National Conference on Emerging Trends in Engineering 2018
Conference Held at Sri Venkatesa Perumal College of Engineering & Technology, Puttur, A.P., India
Computer Science and Software Engineering
ISSN: 2277-128X (Volume-8, Issue-4)
Transmission Loss Allocation by Shapley Value Method
K. Janardhan1, Dr. Y. N Vijay Kumar2, G. Venkat Pradeep3
1
Assistant professor, Dept of EEE, S.V.C.E.T, Chittoor, A.P, India (Email: [email protected])
2
Associate professor, Dept of EEE, S.V.C.E.T, Chittoor, A.P, India
3
Assistant professor, Dept of EEE, S.V.C.E.T, Chittoor, A.P, India
Abstract: The introduction of deregulation and subsequent open access policy in electricity sector has brought competition in energy market. Allocation of transmission loss has become a contentious issue among the electricity producers and consumers. A closed from solution for transmission loss allocation does not exist due to the fact that transmission loss is a highly non-linear function of system states and it is a non-separable quantity. In absence of a closed form solution different utilities use different methods for transmission loss allocation. These schemes fall into the following categories: Prorate, proportional sharing, incremental transmission loss, and loss formula and circuit theory. Some approaches are based on DC power flow, while some use AC load flow for matching the calculation results and actual power flows. Some schemes are branch power-flow based, while some focus on the branch-current based allocation techniques. Different viewpoints and approaches may end up with different results and most of the existing allocation schemes face the problem due to a lack of economic foundations. Most of these techniques involve complex mathematical operations and time consuming computations. This paper proposes fair schemes for the transmission loss allocation under a pool-based electricity market. The power generations or loads associated with the market are modelled as individual current injections based on a real time solved AC power flow solution. Each load can be modelled as a current injection or equivalent constant impedance depending on whether it is required to be responsible for the system loss. Each current injection is then treated as an individual player of the transmission loss allocation game.
The concept of Shapley value adopted from cooperative game theory is utilized to deal with the fairness of loss allocation. The basic models will be proposed in this thesis: one basic model allocates losses to the power supply side (each generation) only, and the other attributes losses to both supply and demand sides (each generation and each load). The main difference is that the former treats the load demand as equivalent constant impedances based on a real-time solved AC power flow solution and accordingly the bus impedance matrix (Zbus) is then modified, while the later formulates the load demand as equivalent current injections. In this thesis the effectiveness of Shapley value method was tested by using test systems such as such Six bus.
I. INTRODUCTION
The electric power industry is undergoing a series of challenging changes due to deregulation and competition. One of the , important issues is the allocation of transmission losses among market participates since system losses can typically represent from five to ten percents of the total generation and cost millions of dollars per year. However, it is not a trivial task to “fairly” allocate a component of system losses to an individual participant of the market. The main difficulty of loss allocation is caused by the highly nonlinear and no separable properties of the loss function.
To deal with the loss allocation problem, a number of allocation schemes have been proposed in the literature. These schemes fall into the following categories: Pro rata, proportional sharing, incremental transmission loss, and loss formula and circuit theory. Some approaches are based on DC power flow, while some use AC load flow for matching the calculation results and actual power flows for matching the calculation results and actual power flows. Some schemes are branch-current based allocation techniques. Different viewpoints and approaches may end up with different results and most of the existing allocation schemes face the problem due to a lack of economic foundations. The motivation this paper is then to offer an alternative scheme with economic features to handle the fairness issue.Game theory provides well-behaved solution mechanisms with economic features for assessing the interaction of different participants in competitive markets and resolving the conflicts among players. In particular, cooperative game theory is a most convenient tool to solve cost allocation problem. Some game theory basic solutions have been proposed for power engineering problems, such as transmission cost allocation and wheeling transactions. The application of Shapley-value concept arisen from cooperative game theory was investigated to allocate losses and the work is extended in this paper. Two basic models will be proposed in the paper. One basic model allocates losses to the power supply side (each generation) only, and the other attributes losses to both supply and demand sides (each generation and each load). The main difference is that the former treat’s the load demands as equivalent constant impedances based on a real-time solved
AC power flow solution and accordingly the bus impedance matrix (Zbus) is then modified, while the later formulates
the load demand as equivalent current injections.
ISSN(E): 2277-128X, ISBN: 978-93-87396-07-4, pp. 43-49
assumptions like those made for a DC power flow or proportional sharing, the proposed approaches utilize the method of Shapley value adopted from cooperative game theory to deal with the fairness issue of loss allocation. Some modified or alternative allocation approaches with or without a normalization procedure are also proposed to deal with the aggregated player of ancillary services and to speed up the computation when the number of players is large. The proposed approaches are consistent with the real-time AC power flow solution and recover the total system loss. The Kirchhoff’s laws and Superposition principle are satisfied and both the network configuration and the voltage-current relationships are reflected. The interactions of players are naturally and fully considered. Moreover, the effect of reducing transmission loss can be identified from the negative loss allocation and the negative allocation can provide economic signals for the players.
The remainder of the paper is organized as follows: section II introduces generation, load and branch loss models. In addition, the transmission loss allocation game is established, and the proposed approaches are presented. Section III demonstrates the application of the proposed schemes via several numerical tests. Discussions and one alternative version are also included.
II. METHODOLOGY
A. Generation and Load Models:
Based on a solved AC power flow solution for a pool-based electric power market, let the complex power
injection into a generator bus i be then Generation current injection is written as
* -(1) Where Vi is its bus voltage. Similarly, let the complex power injection into a
load bus j be we can then have the load current injection.
(3)
Accordingly, two basic models are proposed:
1. Basic Model A (BMA)
BMA attributes losses to each generator and each load using the generation and load current injection models calculated by(1) and (2) respectively.
2. Basic Model B (BMB)
BMB allocates losses only to the power supply side (each generator) under generation current injection and load impedance models calculated by (1) and (3) respectively. The bus impedance matrix is modified by including the equivalent load impedance and then denoted as
B. Individual Voltage Contribution:
The voltage contribution to bus i by current injection can be easily computed by
Where is the i-k element of . By the superposition principle, the actual voltage of any bus i is
equal to the sum of the individual voltage contribution to that bus by all current injections. Note that Kirchhoff’s laws remain satisfied.
C. Transmission Branch Loss Model
Consider a transmission line π-model between buses m and n as shown in Fig. 1, where the
serial impedance and j is the shunt suceptance. After calculating the individual voltage contribution to each bus from every and reasonable allocating mechanism for each current injection, we can then calculate the individual current contribution to each line from every current injection.
The current contribution to transmission line m-n, measured at bus m, by current injection Ii can then be
expressed as
+ = + . (5)
And by the superposition principle, the line current equals the sum of the individual currentcontribution to that line by all current injection, i.e.,
+ = (6)
Consequently, the active loss of line m-n can be sum of calculated by , and the individual
transmission loss contribution by a current injection , while all of the other current injections are represented by open circuits, can be calculated by
ISSN(E): 2277-128X, ISBN: 978-93-87396-07-4, pp. 43-49
Fig1:Transmission line π-model between buses m and n.
In addition, the reactive power loss of the line can also be calculated by
-(⃒ + ) (8)
D. Transmission Loss Allocation Game:
For an n-participant cooperative transmission loss allocation game, let N= {I1, I2 ...In} be the set of all players (current injections), and any nonempty subset S of N is called a coalition. The real-valued characteristic function of each possible coalition S for one transmission element is defined as: V(S) is the transmission loss contribution of the coalition
current injection to that transmission branch element while all the rest current injections are open-circuited. Note
that by the superposition principle, the voltage (or current) contribution of to a bus (or branch) equals
the sum of individual voltage (or current) contributions of all Ii in V(S) are obtained by plugging the associated
into (7). Under such a game setting, when the characteristic functions of all coalitions are completed, we can set up one fair and reasonable allocating mechanism for each player
E. Proposed Loss Allocation Schemes:
Let a fair and reasonable loss allocation for each player on the transmission element be denoted as
X=( ) ,i.e. the loss allocation for player Ii is xi can be calculated by the Shapley value (8) as follows:
(9)
Where [V(SU{Ii})-V(S)] represents the loss increment or decrement due to player Ii joining the coalition S; and
Probn(S)= is the probability that player Ii is the participant joining the game, given that there have
been S players in coalition S already, which can be seen as the sharing factor of the loss impact for one player joining
the other coalition. Note that the self-induced loss of player Ii is v (Ii) and is taken into account in the term [V (SU {Ii
})-V(S)] when S is empty. Moreover, the loss impacts between one player and other different coalitions are all considered in (9). Especially, when S contains only one player, the interaction losses between any two players or current injections
are expressed in [V(SU{Ii})-V(S)]. Such a loss allocation X satisfies the following condition:
V(N) = (10)
Which means that the total loss equals the sum of every player’s loss allocation, i.e., the exact amount of loss is allocated if all current injections are included in N.
The loss allocation process according to (9) is then repeated for every transmission branch. Consequently, the system loss allocation for one player is the sum of the associated loss allocation of all transmission branches. The flow chart of the proposed loss allocation schemes is shown in Fig.2.
Note that for a pool-based market, the bid result of the generation dispatch and market clearing price may be determined initially through a merit-order approach that neglects network constraints, transmission losses, are defined first according to the market rules. In (1), the generation current injection model may contain some power injections from ancillary services such as generation-demand balance, reactive supply or loss compensation. One possible modification may be made by aggregating those supplementary power injections as one aggregated player in the loss allocation game. However, the allocated loss of the aggregated player might be re-allocated to the original winning bidders of the energy market. Thus, the market may agree on allocating the system loss to the bid winners without re-allocation by initially excluding the aggregated player from the allocation process; but, a normalization procedure will be needed to guarantee that the exact amount of losses is allocated. That is, the branch loss allocation would then be the product of the normalized Shapley value and the exact amount of branch loss. For instance, assume that initially there are n players Ii
(i=1, 2… n) and the actual branch active loss is | R. If the line loss is allocated to only m (m<n) players. Say
m=n-1, then their Shapley values are normalized as accordingly the loss allocation to Ii is computed by
.R), and the exact amount of loss equals the sum of every player’s allocation.
III. NUMERICAL RESULTS AND DISCUSSIONS:
ISSN(E): 2277-128X, ISBN: 978-93-87396-07-4, pp. 43-49
Fig 3: One line diagram of a six-bus system is presented and discussed.
ISSN(E): 2277-128X, ISBN: 978-93-87396-07-4, pp. 43-49
TABLE –I SOLVED POWER FLOW SOLUTION
Bus no. P(pu) Q(pu) V(pu) Angle (rad)
1 1.0788 0.1596 1.0500 0
2 0.5000 0.7436 1.0500 -0.0641
3 0.6000 0.8963 1.0700 -0.0746
4 -0.7000 -0.7000 0.9894 -0.0732
5 -0.7000 -0.7000 0.9854 -0.0921
6 -0.7000 -0.7000 1.0044 -0.1038
System real power loss=0.07876pu
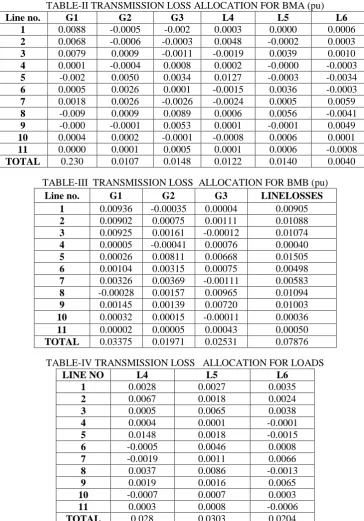
The one-line diagram of a six-bus system with three generation buses, three load buses, and eleven transmission lines (numbered (1), (2), …, (11)) is shown in fig (3) and solved power flow solution is shown in Table-I The players of the loss allocation game are defined as the bus injected complex powers according to the solution. The losses allocated to all generators and loads for each transmission line and the total system loss allocations using BMA (allocated to generator and load buses) and BMB (allocated to generator buses only) and allocated to loads are listed in Table-II, Table-III and Table-IV respectively.
TABLE-II TRANSMISSION LOSS ALLOCATION FOR BMA (pu)
Line no. G1 G2 G3 L4 L5 L6
1 0.0088 -0.0005 -0.002 0.0003 0.0000 0.0006
2 0.0068 -0.0006 -0.0003 0.0048 -0.0002 0.0003
3 0.0079 0.0009 -0.0011 -0.0019 0.0039 0.0010
4 0.0001 -0.0004 0.0008 0.0002 -0.0000 -0.0003
5 -0.002 0.0050 0.0034 0.0127 -0.0003 -0.0034
6 0.0005 0.0026 0.0001 -0.0015 0.0036 -0.0003
7 0.0018 0.0026 -0.0026 -0.0024 0.0005 0.0059
8 -0.009 0.0009 0.0089 0.0006 0.0056 -0.0041
9 -0.000 -0.0001 0.0053 0.0001 -0.0001 0.0049
10 0.0004 0.0002 -0.0001 -0.0008 0.0006 0.0001
11 0.0000 0.0001 0.0005 0.0001 0.0006 -0.0008
TOTAL 0.230 0.0107 0.0148 0.0122 0.0140 0.0040
TABLE-III TRANSMISSION LOSS ALLOCATION FOR BMB (pu)
Line no. G1 G2 G3 LINELOSSES
1 0.00936 -0.00035 0.00004 0.00905
2 0.00902 0.00075 0.00111 0.01088
3 0.00925 0.00161 -0.00012 0.01074
4 0.00005 -0.00041 0.00076 0.00040
5 0.00026 0.00811 0.00668 0.01505
6 0.00104 0.00315 0.00075 0.00498
7 0.00326 0.00369 -0.00111 0.00583
8 -0.00028 0.00157 0.00965 0.01094
9 0.00145 0.00139 0.00720 0.01003
10 0.00032 0.00015 -0.00011 0.00036
11 0.00002 0.00005 0.00043 0.00050
TOTAL 0.03375 0.01971 0.02531 0.07876
TABLE-IV TRANSMISSION LOSS ALLOCATION FOR LOADS
LINE NO L4 L5 L6
1 0.0028 0.0027 0.0035
2 0.0067 0.0018 0.0024
3 0.0005 0.0065 0.0038
4 0.0004 0.0001 -0.0001
5 0.0148 0.0018 -0.0015
6 -0.0005 0.0046 0.0008
7 -0.0019 0.0011 0.0066
8 0.0037 0.0086 -0.0013
9 0.0019 0.0016 0.0065
10 -0.0007 0.0007 0.0003
11 0.0003 0.0008 -0.0006
ISSN(E): 2277-128X, ISBN: 978-93-87396-07-4, pp. 43-49
TABLE-V LOSS ALLOCATION RESULTS FOR TWO MODELS
Gen. G1 G2 G3 SUM
Model
0.0230 0.0107 0.0148 0.0485
BMA
47.4% 22.1% 30.5% 100%
BMB 0.0337 0.0197 0.0253 0.0787
The losses allocated to generators are0.0230, 0.0107, and 0.0148 pu, and those to loads are 0.0122, 0.0140, and 0.0040 pu, respectively. Table III shows that the losses allocated to generators are 0.03375, 0.01971, and0.02531 pu, respectively. The total allocated loss is consistent with the power flow solution and can reasonably reflect the amounts of transactions. According to Tables II and III, the solved power flow solution, and its network configuration, most of the heavily loaded lines are directly connected to G1 (lines 1, 2, and 3)and G3 (lines 8 and 9), and thus the losses allocated to G1 andG3 are high. In addition, high loss shares indicate that the associated shared transmission branches are heavily loaded. It can also be seen that the loss allocated to a generator or load bus is mainly contributed by those lines which are directly connected with that bus and are heavily loaded., The loss allocations of lines 1, 2, and 3for G1 are adding up to about 82% and 98% of its total allocations, respectively. The results can reasonably reflect the transaction positions, the
network Configuration, and the operation status of transmission. From Tables-II&III, negative lossallocations for some
branches are presented and can be explained using the phasor diagram of the individual current contributions. For
example, the individual current contributions on line 4 for BMBshow that the current contribution by G2 plays a role of
reducing the net transmission loss and can be interpreted as contributing a counter flow to that branch against to the net flow direction as shown in Table-V and Table-IV shows the losses allocated to loads. The allocation percentage of each generator with respect to the sum of all generators’ allocations is consistent in both models. Also, for BMA, the 61.6% of the total system loss, and about 38.4% of the system loss is allocated to the loads. Since the network configuration and the location of each player are taken into account by the proposed schemes, the system loss is not evenly allocated to the supply side and the demand side. In addition, for those lines directly connected between one generator bus and one load bus, the corresponding branch losses are mainly allocated to their supply (generation) sides, respectively. For example, the losses of lines 3, 6, and 9 are mostly allocated to G1, G2, and G3, respectively. Thus, there is no need to specify the sharing factors of losses to be allocated to the supply side and demand side.
ALTERNATIVE VERSION:
To speedup the allocation process, one slightly different but acceptable alternative version of (9) for BMA and BMB is then proposed as follows:
Where,
is the loss impact when the player is the first one joining the game and can also represent the self-induced
term; is the term when the player is the last one joining the game and also stands for the
cross-induced term.
Note that when (11) or (12) is utilized to speedup the allocation process, a normalization procedure is needed.
Such a simplified version is still reasonable and acceptable since the self-induced term and the interaction with the rest of players of the game are both considered and followed by a normalization procedure.
IV. CONCLUSION
Based on the concept of Shapley value and the widely used current injection models some fair and acceptable transmission loss allocation schemes were proposed. It is consistent with a solved AC load flow and recovers the total system loss. . No special approximations or assumptions are needed, such as those made for a DC power flow or proportional sharing. The solution is branch-current based, not branch-power-flow based, i.e., emphasizes on the
interactions among complex currents rather than power flows. The Kirchhoff’s laws and superposition principles
ISSN(E): 2277-128X, ISBN: 978-93-87396-07-4, pp. 43-49
SCOPE FOR FUTURE WORK
The proposed schemes are also applicable to bilateral or hybrid pool-bilateral environments. The branch with negative loss allocation may provide one interesting application on congestion management, which is currently under investigation.
REFERENCES
[1] Shih-Chieh Hsieh “Fair transmission loss allocation based on equivalent current injection and Shapley value”
Power Engineering Society General Meeting, 2006.
[2] Rezaul Haque, “Transmission loss allocation using artificial neural networks”, A Ph.D. thesis, Department of
Electrical Engineering, University of Saskatchewan, march2006
[3] A. J. Conejo, J. M. Arroyo, N. Alguacil, and A. L. Guijarro, “Transmission loss allocation: a comparison of
different practical algorithms,” IEEE Trans. Power Syst., vol. 17, no. 3, pp. 571-576, Aug.2002.
[4] Michal chmela, “Transmission loss allocation methods” A Ph.D. thesis, Department of Electrical Engineering,
BRNO University of Technology, march2003
[5] RM Saloman Danaraj, Shankarappa F Kodad and Tulsi Ram Das “Analytical solution to balanced quadratic
cooperative game and its application to transmission loss allocation”
[6] BAO Xin-zhong CUI Wei Allocation of Transmission losses in electricity System Based on Cooperative Game
Theory,”
[7] A. Gomez Exposito, J. M. Riquel me Santos, T. Gonzalez Garcia, and E.A. Ruiz Velasco, “Fair allocation of