Crystal Structure, Visualization, ESR, Thermal, and Spectral Studies
and Microstructural Features of Thorium-Doped Pb
1-xTh
xZrO
3Perovskite
Khaled M.Elsabawy
[a,b]Keywords: Crystal Structure; Thorium-doped lead zirconate; Doping; Perovskite
The pure lead zirconate (PbZrO3) and low concentrations thorium-doped samples with general formula (Pb1-xThxZrO3) where x=0.05, 0.1,
0.2, 0.25 mole were synthesized by the conventional solid state method and sintering procedures. Experimental XRD-measurements indicated that Thorium dopant can substitute successfully on the A-sites of lead zirconate without damaging the main crystal structure which found to be orthorhombic phase with Cmmm space group. Scannin electron microscopy indicated that the average grain size of thorium-doped-lead zirconate ranged in between 0.35 and 1.43 µm. A Visualized studies were made to confirm success of thorium doping in the A-sites of perovskite structure. Theoretical investigations done were concerned by matching and comparison of bond distances ,torsions on angles of investigated compound to clarify success of thorium doping on the perovskite structure. Thermal analyses TGA&DTA were also attempted and incorporated to clarify the effect of thorium doping on thermal behavior of doped perovskite. Furthermore the effect of low concentration thorium dopings on the magnetic order, grain size and vibrational modes frequencies of infrared-spectra were studied.
Corresponding Authors Tel; +9660503252190 E-Mail: [email protected]
[a] Chemistry Department,Faculty of Science,Tanta University-31725-Tanta-Egypt
[b] Chemistry Department-Faculty of Science-Taif University-Taif City –888-Alhawyah-Saudi Arabia
Introduction
Perovskite antiferroelectric (AFE) materials usually display larger field-induced strains, higher energy storage density, considerable pyroelectric coefficient and giant electro-caloric effect due to its unique electric-field-induced phase transformation characteristics between ferroelectric (FE) and AFE. Hence, AFE materials have potential applications in micro-actuators, IR-detectors, digital memories, high energy storage capacitors and cooling devices. Pure PbZrO3 (PZ) with a Curie point of 230 C is the most stable AFE material at room temperature.5 PZ-based materials in bulk and film forms are also the most extensively investigated AFE materials at present. There are a lot of reports on PZ-based AFE materials, such as: (Pb,La)ZrO3 (PLZ), (Pb,Ba)ZrO3 (PBZ), (Pb,Sr)TiO3 (PST), (Pb0.97La0.02)(Zr,Ti,Sn)O3 (PLZST) and (Pb0.99Nb0.02) (Zr,Ti,Sn)O3 (PNZST), and so on.6-14 Most of the compounds with the general formula ABO3 have the perovskite structure15 in which "A" may be a mono-, di-, or tri-valent cation and "B" may be a penta-, tetra-,or tri-valent cation.16. Solid solutions of lead zirconate-titanate (PbZrO
3 – PbTiO3 system) attract the attention of researchers and developers in various fields of science and technology because of their potential applications in memories, microwave tunable capacitors, micro-electromechanical systems (MEMS), pyroelectric sensors and electro-optical switches17-27 It is also reported that the antiferroelectric (AFE) to ferroelectric transition leads to significant
energy storage for a dc field. This feature of PbZrO3 makes it a specific material for energy storage applications.28
Preparation of lead zirconate or (PZ) by conventional processes requires the use of high temperatures at which PbO volatility becomes significant. It is reported that the full development of pure PbZrO3 phase occurs after sintering at temperatures above 1200c° for at least 2h in controlled PbO atmospheres.29-32 PZ powders can also be prepared by wet-chemistry based process routes, which include chemical co-precipitation33,34, micro-emulsion35 and sol-gel technique.29
Matthes et al.35 prepared PZT thin films by the deposition a sol slurry, this method consists of a PZT-sol on acetic acid basis and PZT powder .Kong et al.36 prepared PZ by a high-energy ball milling process using oxides as starting materials.
Bharadwaja et al.37 studied the X-ray diffraction (XRD) for lead zirconate and La-doped lead zirconate thin films and reported that pure lead zirconate thin films showed a pseudo-cubic (110) orientation, whereas all the La-modified films showed a pseudo-cubic (111) orientation. The XRD analysis for lead lanthanum zirconate titanate (PLZT) thin films has been studied38 and showed that the PLZT thin films are polycrystalline and the lattice parameter a decrease slightly with increasing La concentrations.
Boutarfaia39 studied XRD, differential thermal analysis (DTA) and thermal gravimetric analysis (TGA) for
Spectral and thermal studies and microstructural features of Th-doped Pb1-xThxZrO3 Section B-Reseacrh Paper
signal at 560 °C which is related to Pb3O4 final decomposition.
The scanning electron microscope (SEM) has been studied33 for PbZrO
3 and showed the sub-micrometer and spherical nature of the PbZrO3 powder.
Akimov40 studied the IR spectra of lead zirconate- titanate with a rhombohedral and a tetragonal structures and it has been established that with increase in the content of lead titanate in solid solutions of lead zirconate-titanate with a tetragonal structure, the frequency of the ferroelectric- active mode shifts toward higher frequencies.
The essential goal of present studies are studying the effect of low concentration thorium doping tetra-valent dopant on the A-site of perovskite on:
a) crystal structural of pure and Th-doped lead zirconate tetragonal- orthorhombic phases .
b) micro-structural feature and grain size of Th-doped samples ( Pb1-xThxZrO3 ).
c) magnetic order and thermal behavior of Th-doped-samples .
d) spectroscopic IR-absorption spectral
frequencies of Th-doped samples .
Experimental
Samples Preparation
The pure lead zirconate (PbZrO3) and thorium-doped samples with general formula (Pb1-xThxZrO3) where x = 0.05,0.1,0.2,0.25 mole were synthesized by the conventional solid state method and sintering procedure using appropriate amounts of PbCO3, zirconyl carbonate, ZrOCO3 and ThO2 each of having purity >99%. The mixtures were ground in an agate mortar for 1h. The finely ground powder were subject to heating at 800 C° for 20 hrs then reground and pressed into pellets under compressive strength 8 ton/m2 having the pellet dimensions (thickness 0.2 cm & diameter 1.2 cm). Sintering was carried out at 850 C° for 48 hrs. Then the furnace is cooled down slowly to room temperature. 10% more off-stoichiometric Pb3O4 were used in order to compensate lead deficient due to its sublimation during sintering process.
X-Ray diffraction (XRD)
The X-ray diffraction measurements (XRD) were carried out at room temperature on the fine ground powders of pure lead zirconate ( PbZrO3 ) and thorium-doped samples with general formula (Pb1-xThxZrO3) where x = 0.05, 0.1, 0.2, 0.25 mole in the range (2θ =10-90o) using Cu-Kα radiation source and a computerized [Steo-Germany] X-ray diffracto-meter with two theta (2θ) scan technique. A visualized studies of crystal structure were made by using Diamond Molecular Structure version 3.2 package, Germany and Mercury 2.3-BUILD RC4-UK . A visualization study made
is concerned by matching and comparison of experimental and theoretical data of atomic positions, bond distances, oxidation states and bond torsion on the crystal structure formed . Some of these data can be obtained free of charge from The Cambridge Crystallographic Data Centre via
www.ccdc.cam.ac.uk/data_request/cif, or by emailing data request @ccdc.cam.ac.uk, or by contacting ICSD-Fiz-Karlsruhe-Germany .
Scanning Electron – Microscope (SEM):
Scanning electron microscope (SEM) measurements were carried out using small pieces of prepared samples on different sectors to estimate the actual molar ratios by using "TXA-840,JEOL-Japan" attached to XL30 apparatus with EDX unit, accelerant voltage 30kv, magnification 10x up to 500.000x and resolution 3 nm. The samples were coated with gold.
Thermal Analyses Measurements
The thermo-gravimetric analysis (TGA) and the differential thermal analysis (DTA) measurements were carried out on the green mixtures of the prepared samples using a computerized Shimadzu (Japan) TGA/DTA analyzer and Al2O3 as reference for DTA measurements. The heating rate was 3 degree/min and the cooling rate was 1degree/min.
Solid Infrared Absorption Spectra Measurements
The IR absorption spectra of the samples were recorded using "Perkin Elmer" Infrared Spectrophotometer, Germany in the range 200-1500 cm-1 using spec. Pure KBr matrix.
Magnetic Order Measurements
The electron spin resonance spectra (ESR) were recorded at x-band frequencies on a "Bruker-Germany" ESR Spectrometer at room temperature at the National Research Center, Egypt. The magnetic field was swept from 0 to over 8 KG and the calibrated energy was 1 KG with a digital gaussmeter. Several selected samples were investigated.
RESULTS AND DISCUSSION
Phase Identification
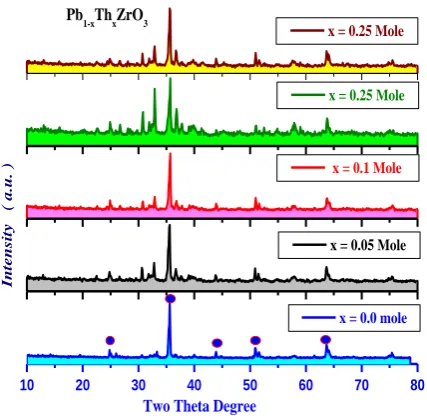
Fig.1 displays the X-ray diffraction patterns of pure lead zirconate (PbZrO3) and Th-doped PbZrO3 (Pb1-xThxZrO3) perovskite where x=0.05, 0.1, 0.2, and 0.25 mole. Analysis of the corresponding 2θ values and the inter-planar spacing d
(Å) proved that, the compound mainly belongs to orthorhombic crystal structure with Cmmm space group.
Spectral and thermal studies and microstructural features of Th-doped Pb1-xThxZrO3 Section B-Reseacrh Paper
to be tetragonal41 at room temperature, single-crystal studies revealed the structure to be orthorhombic.42 The present XRD patterns of PZ are in full agreement with results reported by Fang et al.34 and Kong et al.36
Figure 1. Room temperature XRD-patterns: (a) PbZrO3; (b)
Pb0.95Th0.05ZrO3; (c) Pb0.9Th0.1ZrO3; (d) Pb0.8Th0.2ZrO3; (e)
Pb0.75Th0.25ZrO3.
It was observed that c-axis exhibits slight length compression by increasing Th-content as shown in Fig.(1a) due to ionic radius of Th-ion (Th4+=102 pm) which is smaller than that of Pb-ion such that, Pb2+=120pm.
0.00 0.05 0.10 0.15 0.20 0.25
8.25 8.30 8.35 8.40 8.45 8.50 8.55 8.60 8.65
c
L
a
tt
ic
e
P
a
ra
m
e
te
r
A
o
Th-content Mole
Pb 1-xThxZrO3
Figure 1a. Variation of c-axis lattice parameter as function of thorium content .
Although most of the compounds with the general formula ABO3 have the perovskite structure15 in which "A"may be a mono-, di-, or trivalent cation and "B" may be a penta-, tetra-, or trivalent cation.16 In the present investigation tetravalent thorium successes within the investigated range to replace lead (Pb+m, where 2 < m < 4) in the main crystalline structure of perovskite without damaging the original orthorhombic perovskite crystal.
Structure Visualization
To confirm the success of tetravalent thorium to replace lead on the lattice structure of perovskite (A-site) a visualized crystal structure investigations were made depending upon single crystal data of lead zirconate supplied from ICSD-data bank Karlsruhe-Germany code number ICSD# 8644343 see Figs.2a,b .
Figure 2a 2D-frame net and side view of thorium-doped lead zirconate perovskite unit cell.
Fig.2a shows 2D-frame net structure of orthorhombic perovskite structure displaying the different geometries of (Pb/Th)=A-sites and Zr=B-sites beside displaying the different orientation of polyhedron-zirconate inside unit cell of perovskite structure as clear in Fig.2b.
Figure 2b. Unit cell of Th-doped zirconate displaying ZrO6
-polyhedral units
Fig.2c shows the indexed XRD-profile for pure lead zirconate with Io index = {318} which lies at 2 ~ 35.8 . The most intense reflection peaks ( fingerprint ) of lead zirconate were represented by red circles as clear in Fig.2c .It was noticeable that at two theta (2θ) ~ 51.4 there is doublet
1020304050607080
Two Theta Degree
x = 0.0 mole
x = 0.05 Mole
Pb
1-x
Th
x
ZrO
3
In
t
e
n
si
t
y
(
a
.u
.
)
x = 0.1 Mole
x = 0.25 Mole
x = 0.25 Mole
10 20 30 40 50 60 70 80
Two Theta Degree
x = 0.0 mole
x = 0.05 Mole
Pb1-xThxZrO3
In
te
n
si
ty
(
a
.u
.
) x = 0.1 Mole
x = 0.25 Mole
Spectral and thermal studies and microstructural features of Th-doped Pb1-xThxZrO3 Section B-Reseacrh Paper
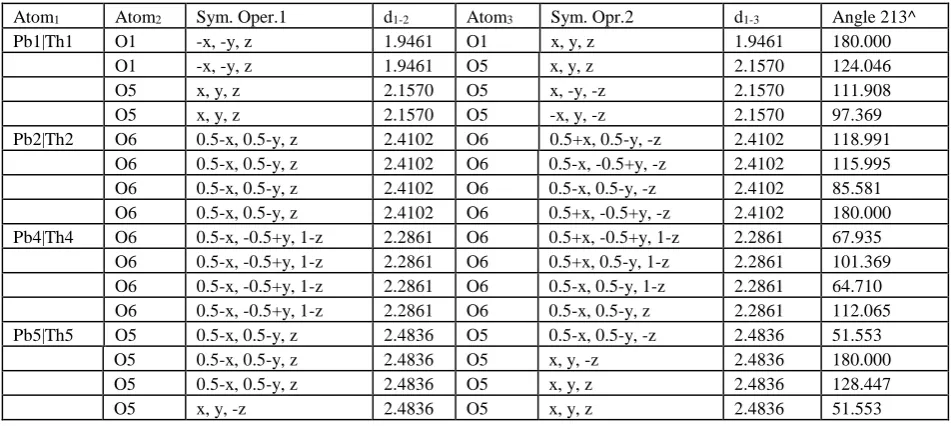
Table 1. Selected bond distances and angles inside crystal lattice of Th-doped-lead zirconate .
Atom1 Atom2 Sym. Oper.1 d1-2 Atom3 Sym. Opr.2 d1-3 Angle 213^
Pb1|Th1 O1 -x, -y, z 1.9461 O1 x, y, z 1.9461 180.000
O1 -x, -y, z 1.9461 O5 x, y, z 2.1570 124.046
O5 x, y, z 2.1570 O5 x, -y, -z 2.1570 111.908
O5 x, y, z 2.1570 O5 -x, y, -z 2.1570 97.369
Pb2|Th2 O6 0.5-x, 0.5-y, z 2.4102 O6 0.5+x, 0.5-y, -z 2.4102 118.991 O6 0.5-x, 0.5-y, z 2.4102 O6 0.5-x, -0.5+y, -z 2.4102 115.995 O6 0.5-x, 0.5-y, z 2.4102 O6 0.5-x, 0.5-y, -z 2.4102 85.581 O6 0.5-x, 0.5-y, z 2.4102 O6 0.5+x, -0.5+y, -z 2.4102 180.000 Pb4|Th4 O6 0.5-x, -0.5+y, 1-z 2.2861 O6 0.5+x, -0.5+y, 1-z 2.2861 67.935
O6 0.5-x, -0.5+y, 1-z 2.2861 O6 0.5+x, 0.5-y, 1-z 2.2861 101.369 O6 0.5-x, -0.5+y, 1-z 2.2861 O6 0.5-x, 0.5-y, 1-z 2.2861 64.710 O6 0.5-x, -0.5+y, 1-z 2.2861 O6 0.5-x, 0.5-y, z 2.2861 112.065 Pb5|Th5 O5 0.5-x, 0.5-y, z 2.4836 O5 0.5-x, 0.5-y, -z 2.4836 51.553
O5 0.5-x, 0.5-y, z 2.4836 O5 x, y, -z 2.4836 180.000
O5 0.5-x, 0.5-y, z 2.4836 O5 x, y, z 2.4836 128.447
O5 x, y, -z 2.4836 O5 x, y, z 2.4836 51.553
Table 2. Selected bond distances and angles inside crystal lattice of Th-doped-lead zirconate
Atom1 Atom2 Sym. Oper.1 d1-2 Atom3 Sym. Opr.2 d1-3 Angle 213^
Zr1 O3 x, y, z 1.5066 O1 x, y, z 1.8329 140.289
O1 x, y, z 1.8329 O5 x, y, z 2.2210 56.003
O5 x, -y, z 2.2210 O5 x, y, z 2.2210 79.761
Zr2 O2 x, y, z 1.5781 O4 x, y, z 1.6000 153.370
O4 x, y, z 1.6000 O5 -x, y, z 2.0079 94.843
O5 -x, y, z 2.0079 O5 x, y, z 2.0079 73.944
O6 -x, y, z 2.0294 O6 x, y, z 2.0294 78.010
O1 Zr1 x, y, z 1.8329 Zr1 x, -y, -z 1.8329 122.436
O5 x, y, z 1.9338 O5 x, -y, -z 1.9338 135.099
O2 Zr2 -x, y, -z 1.5781 Zr2 x, y, z 1.5781 145.486
O5 -x, y, -z 1.9460 O5 x, y, -z 1.9460 76.71
O3 Zr1 x, -y, 1-z 1.5066 Zr1 x, y, z 1.5066 158.142
O4 Zr2 -x, y, 1-z 1.6000 Zr2 x, y, z 1.6000 161.253
O5 O1 x, y, z 1.9338 O2 x, y, z 1.9460 109.573
O2 x, y, z 1.9460 Pb1|Th1 x, y, z 2.1570 74.958
Zr2 x, y, z 2.0079 Pb1|Th1 x, y, z 2.1570 106.153
Pb1|Th1 x, y, z 2.1570 O5 x, y, -z 2.1600 59.954
Zr1 x, y, z 2.2210 O5 -x, y, z 2.4152 136.875
O6 Zr2 x, y, z 2.0294 Zr10.5 -x, 0.5-y, z 2.0946 164.190
Zr1 0.5-x, 0.5-y, z 2.0946 Pb4|Th4 -0.5+x, 0.5+y, z 2.2861 98.639 Pb4|Th4 -0.5+x, 0.5+y,z 2.2861 Pb2|Th2 -0.5+x, 0.5+y, z 2.4102 82.106 Pb2|Th2 -0.5+x, 0.5+y,z 2.4102 O6 x, 1-y, z 2.4468 59.495
peak characteristics for lead zirconate perovskite structure indexed by {318), the same doublet peak was observed also nearly in the same location in the visualized theoretical patterns constructed for thorium-doped zirconate as clear in Fig.2d which confirm that thorium can substitute successfully on A-sites of perovskite structure without destroying the original orthorhombic phase .
The comparison between theoretical pattern Fig.2d and the experimental XRD-profile of thorium-doped lead zirconate Fig.2c one may conclude that there are moderate to strong fitting between the both profiles which confirm success of thorium doping within investigating range (0.05-0.25 mole).
Tables.1 and 2 show some selected bond distances and angles inside unit cell of Th-doped –perovskite zirconate.
These results are in full agreement with Coker et al.44 who reported that the average bond distances recorded inside the crystal lattice of lead zirconate were found 2.47 Å for lead type 1 Pb1-O and 2.58Å for lead type 2 Pb2-O respectively .
10 20 30 40 50 60 70 80
[481] [800]
[138] [003] [504] [318]
[002] [221]
[130]
Two Theta Degree
XRD-Pure PbZrO3
Figure 2c. Indexed XRD-profile recorded for pure lead zirconate
The analysis of bond distances and angles inside unit cell of Th-doped-lead zirconate indicated that there are two types of zirconium environment nominated as Zr1 and Zr2 as described in Table 2. This is beside six types of oxygen environment symbolized as O1, O2, O3, O4, O5 and O6 respectively .
Figure 2d. Visualized XRD-profile recorded for Th-doped lead zirconate
It was noticed that the bond distances between Zr-O recorded minimum for (Zr1-O3 =1.50 Å) and maximum one is for Zr1-O5 with bond length = 2.22 Å while the other type was found to be 1.57 is for Zr2-O2 and 2.029 for Zr2-O6 respectively.
From Table 2 it was observed also that there are six types of oxygen symbolized as O1, O2, O3, O4, O5 and O6 are found inside lattice recorded bond distance values 1.83, 1.57, 1.5, 1.6, 2.007 and 2.029 Å for O1-Zr1, O2-Zr2, O3-Zr1 , O4-Zr2, O5-Zr2 and O6-Zr2 Å respectively .
These results are compatible with average bond distances recorded for the two types of zirconium (Zr1and Zr2 )-Oxygen inside crystal lattice was reported44 for lead zirconate with small differences due to thorium doping
effect. The authors44 recorded the following bond distances for the two different types of zirconium Zr1-O2 = 2.111 Å ,Zr1-O1= 2.098 Å ,Zr2-O3= 2.162 Å ,Zr2-O4 = 2.140 Å and Zr2-O5 = 2.044 Å respectively .
The analysis of visualized structure concerning by XRD-pattern, bond distances, angles, torsion and lattice volume confirmed that stability of doped-lead zirconate lattice is relatively high specially there is no violation in most data
recorded for thorium-doped- lead zirconate and
consequently reflects success of thorium doping in the investigated range (x=0.05-0.25 mole).
SEM Measurements
Fig. 3 shows the SEM-micrographs for pure and Th-doped PbZrO3 with (x=0.05, 0.1, 0.2 and 0.25) applied on the ground powders that prepared by solid state route (SSR) and it shows the sub-micrometer and spherical nature of the PbZrO3 powder. The average grain size was calculated and found in between 0.35 and 1.43 µm.
These results are in agreement with results reported by Rao et al.32 and Fang et al.34 in which the conventionally PbZrO3 powder is covering the size range from 0.2 to 1.3 µm. From Fig.3a-e it is so difficult to observe inhomogeneitiy within the micrograph due to that the powders used are very fine and the particle size estimated is too small. It was noticeable that the surfaces of all samples have bubbling nature as clear in Figs.3a-e due to precursor of the lead zirconate contains both of zirconium and lead as carbonates .And as result of raising temperature carbonates decomposes converting into CO2 which make as bubbling agent .
Figure 3. SE-micrographs captured for (a) PbZrO3; (b)
Pb0.95Th0.05ZrO3; (c) Pb0.9Th0.1ZrO3; (d) Pb0.8Th0.2ZrO3; (e)
Pb0.75Th0.25ZrO3.
The grain size for Th-doped PbZrO3 was calculated according to Scherrer’s formula:
B
=0.87
/
D
cos
...(1)
Spectral and thermal studies and microstructural features of Th-doped Pb1-xThxZrO3 Section B-Reseacrh Paper
diffraction peak which is equal to the difference of full width at half maximum (FWHM) of the peak at the same diffraction angle between the measured sample and standard one. From SEM-maping, the estimated average grain size was found to be in between 0.35 and 1.43 µm which is relatively large in comparison with that calculated applying Scherrer’s formula for pure 123-phase (D ~ 0.39 µm). This indicates that, the actual grain size in the material bulk is smaller than that detected on the surface morphology.
Furthermore, in our EDX (energy disperse X-ray) analysis, Th4+ was detected qualitatively with good approximate to the actual molar ratio but not observed at PbZrO3 grain boundaries which confirm that, thorium (IV) has diffused regularly into material bulk Th-doped PbZrO3 perovskite-phase and induces in the crystalline structure of PbZrO3 perovskite through solid state reaction.
Infrared Absorption Spectra Measurements
Fig. 4 shows the solid Infrared spectra for pure and Th-doped PbZrO3 powders, the spectra for pure PbZrO3 displays some characteristics bands at 417,551,750 and 812 cm-1 which have been assigned generally to ZrO
3 torsions and those at 551 and 750 cm1- are due to Zr-O stretching and the other weak and much weaker bands appearing at higher wavenumbers result from the valent oscillation of metal-O bands.45
400 450 500 550 600 650 700 750 800 850 900 950 1000 0
10 20 30 40 50 60 70 80 90 100
IR-Frequencies 417 cm-1 551 cm-1
750 cm-1
812 cm-1
T
ra
n
sm
it
ta
n
ce
Wavenumber cm-1 x = 0.05 mole
x = 0.0 mole x = 0.25 mole x = 0.2 mole x = 0.1 mole
Figure 4. Infrared absorption spectra (a) PbZrO3; (b)
Pb0.95Th0.05ZrO3; (c) Pb0.9Th0.1ZrO3; (d) Pb0.8Th0.2ZrO3; (e)
Pb0.75Th0.25ZrO3
For Th-doped lead zirconate , absorption bands of FT-IR spectrum are related to the lattice vibration of BO6 (B¼Zr) octahedron groups,46-48 a strong and broad band within 700–
400 cm-1 indicated the presence of ZrO
6 oxygen-octahedral groups, absorption bands within 700–500 and 500–400 cm-1 represented the stretching frequencies of ZrO6 oxygen-octahedral groups. Therefore, these observed infrared spectrum bands were all the characteristic bands of the perovskite PZ structure, further proving that the formation of perovskite-phase PZ via the solid state chemical reactions in heterogeneous multi-material powder mixtures.49 It was noticed that some of Zr–O bond length decreased, so the bond force constant of K increased, and vibration frequency of ZrO6 oxygen-octahedral groups got bigger, thus the
strongest adsorption band shifted to a higher wave number for synthesized powders.
Based on these observations, it could be inferred due to which the crystal structure of synthesized powders is distorted. Thus the powders have high activity, which can reduce sintering temperature.
Electron Spin Resonance (ESR) Measurements
Fig. 5 displays the electron-spin resonance (ESR) spectra recorded for pure and Th-doped PbZrO3 powders with ( x= 0.0 ,0.05 ,0.1 and 0.2 mole ), the g-values parallel and perpendicular to the symmetry axis and the effective g -values which nominated as (giso) are calculated as shown in Table 3.
Figure 5. ESR-signals recorded for pure and selected thorium doped zirconates; (a) PbZrO3; (b) Pb0.95Th0.05ZrO3; (c)
Pb0.9Th0.1ZrO3; (d) Pb0.8Th0.2ZrO3.
It was obvious to observe that the values of (giso) is inversely proportional to the dopant ratio, recording minimum value (giso) =2.13 for highest dopant content Th=0.2 mole.
Table 3.The effective g-values (giso) of some prepared samples of
Th-doped PbZrO3.
This decrease in the paramagnetic content is due to that thorium dopant has tetra-valent oxidation state which means the outer shell is vacant since the electronic configuration of thorium is [Rn] 6d27s2 , for tetra-valent thorium (Th4+)=[Rn] 6d07s0 and consequently the diamagnetic character is increased remarkably as Th-doping ratio increased .
Material giso values
PbZrO3 2.31
Pb0.9Th0.05ZrO3 2.28
Pb0.8Th0.1ZrO3 2.24
Figure 6. TGA/DTA curves: (a) PbZrO3;(b) Pb0.95Th0.05ZrO3;(c)
Pb0.9Th0.1ZrO3; (d) Pb0.8Th0.2ZrO3.
Analysis of its ESR spectra indicates that Th4+ substitution occurs at the Pbn+ at many different ESR-distinguishable locations. All factors, namely could be for the Pb4+>Pb2+, Pb3+>Pb2+ or Pb4+>Pb2+ Pb4+>Pb3+ conversions which are responsible for the large microstrains and the deterioration of crystalline structure is observed in these ceramics, which seemed to play a crucial role for reading large piezoelectric anisotropy within thorium-doped perovskite system. Although Pb3+ is not real valency for lead but it is really observed in visualised calculation as average oxidation state for lead (Pb4+ and Pb2+) inside crystal lattice .
These results are partially in agreement with the results of Rosales et al.50 who investigated the effect of Eu-and Ti-doping on the ESR spectra of lead manganate perovskite structure.
Thermal Analyses Measurements
The TGA and DTA analyses were carried out on the green mixtures of pure and Th-doped PbZrO3 powders with (x=0.0, 0.05, 0.1 and 0.2 mole ) symbolized as a, b, c and d respectively in Fig. 6.
From TGA/DTA curves Fig.6 the TGA analysis can be divided into four steps. The first step occupies the region from room temperature up to 230°C for which the weight loss occurred is attributing to the humidity of samples and partial decomposition of both of ZrOCO3 and PbCO3 The second region lies between 240~390 °C at which lead carbonate decomposed moderately into PbO and CO2.39. The third region of temperature ranging from 390-680 °C at which the weight loss occurred attributing to the onset of the crystallization process and partial volatilization of lead oxide.39,51 The last region is between 680~800 °C for complete decomposition of both of Zr(CO3)2 and PbCO3 into metal oxide accompanied with solid state reaction of solid metal oxide (Pb-oxide,ThO2 and ZrO2) .
The same trend was observed52-54 for the endothermic peak, which always observed at approximated range of ~ 780-820 °C which refers to the phase formation and this range could be shifted up or down according to the system composition under investigations.
Conclusions
The conclusive remarks within this article can be summarized under the following points;
Tetravalent thorium got success in the investigated range to replace lead in the main crystalline structure of perovskite without damaging the original orthorhombic perovskite crystal.
The analysis of visualized structure determined by XRD-pattern, bond distances, angles, torsion and lattice volume confirmed that stability of doped-lead zirconate lattice is relatively high, specially there is no violation in most data
recorded for thorium-doped- lead zirconate and
consequently reflects success of thorium doping in the investigated range (x=0.05-0.25 mole )
The SEM measurements indicated that the average grain size of thorium-doped-lead zirconate ranged in between 0.35 and 1.43 µm.
Decreasing of paramagnetic content is due to the diamagnetic character is increased remarkably as Th-doping ratio increased .
References
1Park, S. E. Markowski, K. Yoshikawa S. and Cross, L. E. J. Am.
Ceram. Soc. 1997, 80, 407.
2Parui, J. and Krupanidhi, S. B., J. Appl. Phys. 100 (2006), pp.
044102.
3Xu, Z. K. Zhai, J. W. and Chan, W. H., Appl. Phys. Lett.2006,
88, 132908.
4Love, G. R. J. Am. Ceram. Soc. 1990, 73 323.
5Chattopadhyay, S., Ayyub, P., Palkar, V. R., Multani, M. S., Pai,
S. P., Purandare S. C., Pinto, R., J. Appl. Phys. 1998, 83, 7808.
6Bharahwaja S. S. N. and Krupanidhi, S. B. Thin Solid Films 2003,
423, 88.
7Xu, B. M., Ye, Y. H. and Cross, L. E., J. Appl. Phys. 2000, 87,
2507.
8Zhai, J.W. Cheung, M.H. Xu Z.K. and Li, X. Appl. Phys. Lett.
2002, 81, 3621.
9Chen, H. W., Yang, C. R., Zhang, J. H., Pei, Y. F. and Zhao, Z. J.
Alloys Compd. 2009, 486,. 615.
10Hao, X. H. and Zhai, J. W., J. Cryst. Growth, 2008, 310, 1137. 11Hao, X. H., Zhai, J. W. and Yao, X. J. Cryst. Growth, 2008, 311,
90.
12Kong, L. B., Ma, J., Zhu, W. and Tan, O. K., J. Alloys Compd.,
Spectral and thermal studies and microstructural features of Th-doped Pb1-xThxZrO3 Section B-Reseacrh Paper
13Charoonsuk, P., Wirunchit, S., Muanghlua, R., Niemcharoen, S.,
Boonchom B. and Vittayakorn, N., J. Alloys Compd.3, (2010)pp.23-28 .
14Hao, X. H. Zhang, Z. Q. Zhou, J. An, S. L. and Zhai, J. W. J.
Alloys Compd. 2010, 501, 358.
15Smoluchowski R. and Kurti N., Solid State Physics, vol.5:
Structure, Properties, &Preparation of Perovskite-Type Compounds, Pergamon Press Inc., 1969, 3-11.
16Wold A. and Dwigh, K., Solid State Chemistry, Chapman and
Hall Inc., 1993. p. 127, 136, 137.
17Scott, J. F. Araujo, C. A., Science, 1989, 246, 1400.
18Xu, Y. H. Ferroelectric Materials and Their Applications,
North-Holland, Amsterdam, 1991, 206.
19Watton, R. Manning, P., Proc. SPIE 3436, 1998, 541.
20Wood, V. E. Bush, J. R., Ramamurthi, S. D. Swartz, S. L., J.
Appl.Phys. 1992, 71, 4557.
21Preston, K. D., Haertling, G. H., Appl. Phys. Lett., 1992, 60,
2831.
22Liu, W. G., Ko, J. S., Zhu, W. G., Infrared Phys. Technol., 2000,
41, 169.
23Dimos, D. Muller, C. H., Ann. Rev. Mater. Sci., 1998, 28, 397. 24Polla, D. L., Microelectron. Eng., 1995, 29, 51.
25Nemirovsky, Y., Nemirovsky, A., Muralt, P., Setter, N., Sensors
Actuators, 1996, A56, 239.
26Heartling, G., J. Am. Ceram. Soc., 1999, 82, 797. 27Singh, K. Ferroelectrics, 1989, 94, 433.
28Lanagan, M. T., Kim, J. H., Jang, S. and Newnham, R. E., J. Am.
Ceram. Soc., 1988, 71, 111.
29Wakino, K., Murata, M. and Tamura, H., J. Am. Ceram. Soc.,
1986, 69, 34.
30Lawless, W. N., Phys. Rev., 1984, B30, 6555.
31Ibrahim, D. M. and Henniek, H. W., Trans. J. Br. Ceram. Soc.,
1981, 80, 18.
32Rao, Y. S., Sunandana C. S., J. Mater. Sci. Lett., 1992, 11, 595. 33Oren, E. E. Taspinar E. and Tas, A. C., J. Am. Ceram. Soc., 1997,
80(10), 2714.
34Fang, J., Wang, J., Ng, S. M., Gan, L., Quek C. and Chew, C. H.,
Mater. Lett., 1998, 36, 179.
35Matthes, B. Tomandl, G. and Werner, G., J. Eur. Ceram. Soc.,
1999, 19(6-7), 1387
36Kong, L. B., Ma, J., Zhu, W. and Tan, O. K., Mater. Lett., 2001,
49(2), 96.
37Bharadwaja, S. S. N., Krupanidhi, S. B., Thin Solid Films 2003,
423, 88.
38Hu, Z. G., Shi, F. W., Lin, T., Huang, Z. M., Wang, G. S., Wu,
Y. N., Chu, J. H., Phys. Lett. A, 2004, 230, 478.
39Boutarfaia, A. Ceram. Int., 2001, 27, 91.
40Akimov, A. I., Savchuk, G. K., and Akimova, T. M., J. Appl.
Spectr., 2003, 70, 4.
41Megaw, H. D., Proc. Phys. Soc. London., 1946, 58, 133.
42Sawaguchi, E., Maniwa, H. and Hoshino, S., Phys. Rev., 1951,
53, 1078.
43Fujishita, H., Shiozaki, Y., Achiwa, N., Sawaguchi, E., J. Phys.
Soc. Japan, 1982, 51, 3583.
44Corker, D. L., Glazer, A. M., Kaminsky, W., Whatmore, R. W., Dec, J., Roleder,K., Acta Cryst. 1998, B54,18.
45Rao, C. Perovskites Ceramics ,Academic Press, 1963, p. 356 . 46Ghasemifard, M., Hosseini, S. M., Zak A. and Khorrami, G. H.,
Physica E 2009, 41, 418.
47Chang, T., Huang, J. L. and Lin, H. P., J. Alloys Compd.2006,
414, 224.
48Smitha, P., Pandey P. K. and Gajbhiye, N. S. Mater. Chem.
Phys., 2008, 109, 500.
49Chen, F., Yang, S. Y., Wang, J. X., He, H. L. and Wang, G. C., J.
Inorg. Mater. 2007, 22, 827.
50Ramírez-Rosales, D., Zamorano-Ulloa R., and Pérez-Martínez,
O., Solid State Comm. 2001, 118,.371-376
51Pandey, D., Singh, A. K., Srivastava, P., Singh, A., Inbanathan, P., and Singh, G., Physica 1995, C241, 279.
52Sekkina, M. M. A., Elsabawy, K. M., Physica C 2002, 377, 254. 53Sekkina, M. M. A., Elsabawy, K. M., Mater. Science Eng., 2003,
B103, 71.
54Elsabawy, K. M., Kandyel, E. E. and Sekkina, M. M. A.,
Current Appl. Phys., 2009, 9, 238.