International Journal of Advances in Management and Economics Available online at: www.managementjournal.info
RESEARCH ARTICLE
Total Factor Productivity Analysis in Food Sector
Halim Tatli
1*, Riza Bayrak
21Faculty of Economics and Administrative Sciences, Department of Economics ,Bingol University.
2Turkish Armed Forces General Staff.
*Corresponding Author: Halim Tatli
Abstract
In this study we to try to analyze the total factor productivity of 22 firms listed in Borsa Istanbul (BIST) in terms of economics perspective with the 2011-2015 years data. Equity, raw material cost and personnel cost were used as input variables; total sales and total export values also as output variables in accordance with the data acquired from BIST. Malmquist Total Factor Productivity Index was applied to data with input oriented models. According to research findings; all firms seems to have decreasing values only in technical efficiency; but on the contrary increasing values in technological efficiency, pure efficiency, scale efficiency and total factor productivity. The most improvements was observed to be approximately 4.5% in total factor productivity. A.V.O.D, Tarım and Dardanel were seen to be firms improving their values in all efficiency forms for five years; whereas Kent, Oylum and Pınar Et were observed to have decreasing values in all efficiency forms for five years.
Keywords: Borsa Istanbul, Food Industry, Efficiency, Malmquist Total Factor, Productivity.
Introduction
Moving by the fact that food is of great importance for the continuation of human lives, it can be said that first and foremost phase of social prosperity is to maintain the need of food and drinks sufficently and healthily. In other words, the truth of food being the most basic need of human lives allows this sector to be more important and strategic than the other sectors of economy. Food and beverage sector; with its nearly 290 billion liras in gross domestic product, over 42000 producing firms and over 480000 employers, is at the position of the largest production industry in Turkish economy. Turkish food sector also increased its percentage of exports by 3,5 times and became the 15th largest food and beverage sector all over the world with its %7 additional percentage on exports as of 2014 (Ministry of Sciens, Industry and Technology). Moreover, since the sector is a part of manufacturing industry and is labor-intensive, it is of quite substantial importance in terms of employment. The percentage of employees of food and
beverage sector in Turkish manufacturing industry is % 12,4 (Social Securitiy Institution). Apart from that, these firms producing in the food and beverage sector provide significant added value to Turkish economy. While the total added value created by the sector was 13,9 billion TL in 2013; this amount increased with the rate of %41 and became 23,5 billion TL in 2014 (Turkish Statistical Institution).
Additionally, because of the rapid changes on information and communication technology and globalization, competition between the firms gets tougher. Therefore, the only way to survive in this highly competitive environment can be managed with efficient production. In other words, the sustainability of these firms can be related to the terms of efficiency and productivity.
Generally, efficiency can be handled with two approaches in the literature. First one is economical efficiency approach and the other is firm sided approach. Economical efficiency approach mostly consists of the terms of Pareto optimum, and it expresses production and distribution efficiency. In firm approach, efficiency is defined as the accurate production of the firm by means of inputs and oputputs (Yükçü and Atağan, 2009:2). At this point, it this possible to describe efficiency to be ratio of actual output to the potential output [1].
With these thoughts it is highly possible to say that the determination of productivity and efficiency of the firms is of great importance. With this purpose, firms of the Istanbul Stock Exchange were selected. Because these firms have valid financial, executive and legal norms for productivity and efficiency analysis. As the decision making unit in our study, food and beverage producing firms within manufacturing industry were chosen.
Firstly, the studies conducted in the literature concerning this subject until this time were examined. Analysis method was introduced afterwards. In the third part of the study, variables and related data were explained. In the part of findings and discussion, findings of the analysis were discussed. In the last part, conlusion part, findings of the study were summarized and some future implication was developed for the next studies.
Summary of the Literature
Examining the literature, it can be seen that the number of studies, using Data Envelopment Analysis and Malmquist Total Factor Productivity analysis that measured the efficieny of food and beverage sector, are limited. However, there are many studies taht measured efficiency and productivity of
manufacturing industries and other sectors with these methos. In this section, the studies conducted to measure efficiency and productivity of food and beverages were examined respectively.
Percin and Ustasuleyman [2] used the method of Malmquist Total Factor Productiivity and Data Envelopment Analysis to measurea and evaluate the food and textile firms of Istanbul Stock Exchange between 2000 and 2002. Inputs of the study were number of employers of the firms, total assets and equity capital. Outputs were sales, profits, market value, and profits per share and amounts per share. Analysis revealed that decrease of the efficiency of the food firms were less than that of textile firms, and the most important cause of the decrease of efficiency was observed to be the negativities on technical efficiency changes between 2000 and 2002.
Dizkirici [3] used the method of Data Envelopment Analysis to measure financial efficiencies of the food and beverages firms listed in BIST for the term between 2000 and 2002. Output of the study was profitabilty ratio. Inputs were liquidity, activity ratio and financial structure ratios. At the end of the study, each firm’s productivity rate was compared with the values achived with MTFI for related term. As a result of the evaluations, Ulker was found the only firm both to be productive and have increasing productivity values. Cikar and Percin [4] used efficiency analysis to analyse efficiencies of these firms with the data of 2009. After that, they used Malmquist Total Factor Productivity Index to measure the change of productivity of 25 sugar factories with 2002-2009 data. At the end of the study, under the assumption of constant returns to scale, 12 factories and under the assumption of variable return to the scale, 16 factories were found to be productive. After the MTFP analysis, % 0,6 increase on TFP was observed in mentioned firms for the period of 2002-2009.
method. A decrease of %0,9 on TFP was found in this study.
Different methods were observed in literature about the studies of efficiency and productivity of food sector. The more prominent was Birlik et al. [6] s study. In this study, Stochastic Frontier Analysis was used to predict the technical unproductivity levels of firms of Turkish food sector in the short and long run. In the study, surveys of structured job statistics of Turkish Statistical Institute were used and stochastic frontier function was estimated for the term 2003-2011. According to the results, technical unproductivity on food sector is persistent and the productivity level of the firms did not converge in the long run.
Chang and Robin [7] using the data from the term 1997-2003, examined the influence of innovation on productivity in Taiwan over 48794 firms from 23 industries. Output of the study was total sales; inputs were capital, workforce and intermediate goods of energy and production. Analysis revealed the fact that the innovative character of firms had significant negative effect on TFP both before and after 1990 at all sectors. Examining the empirical studies of the literatüre, it is seen that Malmquist TFP were used to measure efficiency changes in various sectors. For example Georganta [8] measured the corn industry of the Greece; Deliktas [9] examined the private manufacturing industry of Turkey; Lorcu [10] examinde automotive industry in Turkey; Yaylaci [11] examined the automotive industry of 26 developing country; Madden and Savage [12] studied telecomunication sector; Managi et al. [13] worked petroleum and gas industry in Mexican Gulf; Chen [14] automotive industry in USA, Europa, Japan and North Korea; Shen and Shong [15] examined the
steel industry of China; Oh et al. (2014) the efficiency of manufacturing industry of Korea with this method.
Main feature of this study is that it uses data for a larger period than aforementioned studies and it differentiate by the choice of variables. Data used in that study are basically related the cost variables, poduction process and market share values. Therefore it can be claimed that these variable may represent the production process better than financial ones.
Method
Malmquist TFP index, which considers taking time dimension Yalçıner [16] time dependent effects of variables Grifell and Lovell [17] into account while measuring the efficiencies of the decision making units (DMUs), was first developed by Caves et al. [18]. After that, the name of Malmquist was given to it, who proposed the idea of establishing an index with distance functions Grosskopf [19], Cingi and Tarım [20]. This index is described as the ratio of input and output distance functions in order to measure the change in TFP of a firm between the time periods of “s” and “t” Coelli et al [21].
Distance function for the output is defined as d(x, y) = min {δ: (y/ δ) ∈ S} and if the values of d(x, y) are on the “S” boundaries (production frontier) of vector Y, then it is equal 1.0 (=1.0). If vector y is defining a technivally ineffcient point on “S”, it is bigger than 1.0 (>1.0); and if vector y is defining a point outside of the “S” than the value is smaller than 1.0 (<1.0) Cingi and Tarım, [22].
Malmquist TFP index is defined for output oriented models as equation (1) Färe [23] 66-80.
= (1)
If M0> 1; than it can be accepted that TFP
increased from “t” term to “t+1” term. If M0<
1, than it would be said that TFP decreased from “t” term to “t+1” term and
finally if M0= 1, it would be acknowledged no
change in TFP from “t” term to “t+1” term . It is possible to convert equation (1) to equation (2) Grosskopf, [19].
= x (2)
Equation (3) describes the change in technical efficiency and defines the approaching process (catching-up effect) of
decision making units (DMUs) to the efficient frontier. This can be expressed to be catching of production frontier Rezitis, [24].
TED= (3)
Equation (4) describes technological changes and defines the shift of efficient frontier in time (frontier shift or boundary
shift). Meaning, it can be accepted as the shift of production possibilities curve Mahadevan [25].
TD = (4)
Therefore, changes occured in technical efficiency and technological effiviciency are part of changes in TFP and their multiplication gives the index of TFP as
shown in equation (5) (Kök and Şimşek, [26] 5; Herrero and Pascoe [27]. This allows us to observe the impact of both factors on TFP.
= TED x TD (5)
Changes in technical efficiency explains the situation of getting closer to the production frontier under the assumption of constant return to the scale; while changes in technological efficiency express the changes of technologies utilized or the shift of production possibilities curve Mahadevan, [25].
Change in the pure efficiency express technical changes under constant return to the scale; change in the scale efficiency defines the degree of approaching to the most effective scale/optimal scale and
changes in TFP defines the sum of both technical and technological change Akhisar ve Tezergil, [28].
Data
In this section, it can be found the explanations regarding the data used in this study. 5 variables were used totally: equity capital, personnel cost, raw material cost as input variables; total sales and total export value as output variables. Information about these variables is stated on Table 1.
Table1: Variables and Definition
Variable Definition Source
Input
EQ Equity
Borsa Istanbul (BIST)*
PC Personnel Cost
RC Raw Material Cost
Ouput TS Total Sales
TE Total Export
Reference: (*) Obtained from https://www.kap.org.tr
Accessed Date: 01.01.2016-01.03.2016
Results and Discussion
Variables that do not contribute to production and have multicolinearity should
This analysis revealed that correlation between variables was too low.
In this analysis; technical efficiency, technological efficiency, pure technical efficiency, scale efficiency and TFP changes of 22 firms for four terms in five years were examined. Additionally, change of efficiency averages were studied for these terms. Also, by analyzing the five year production process of the firms as a whole, values obtained were compared with each other and interpreted.
Values bigger than 1 (>1) shows the increase of the efficiency and values less than 1 (<1) shows decrease of efficiency for the related term. But, values equal 1 (=1) means no change of efficiency in the related term.
Examining technical efficiency levels, describing the approach to efficient frontier, out of these four terms, only efficiency loss (15 %) were observed in 2013-2014 term, whereas there was an increase of efficiency in other terms. In this five years period, it could be said that firm efficiency levels were observed to be fluctuating up and down rather than purely a constant increase or decrease.
The only firm was Merko Gida to preserve its technical efficiency as a stable in this five years period.
Examining the technological efficiency change, which describes the shift of production possibilities frontier in time; it was observed that firms had efficiency decreases at about 14% reagrding averages fort he period of 2011-2012. But in the other terms, they seemed to inrease their efficiencies, while to have a small efficiency loss only in the last term.
Banvit, Coca Cola, Penguen Gida seemed to be only three firms to increase their efficiency values for all terms. On average a loss of %14 on technological efficiency which can be described as gained by the firms with technological changes and signals to the shift of producttion opportunities curve was observed for 2011-2012 term and an increase of efficiency occured for the following two terms then a little decrease if
efficiency happened in the last term. Banvit, Coca Cola and Penguen are ther firms that gained efficiency in every term within this 5 year period.
Evaluating the pure technical efficiency level, which implies the technical efficiency change under the assumption of variable return to the scale, it may be expressed that the only term in which firms experienced efficiency loss at about 8% was 2013-2014. In other terms, they seemed to have efficiency increases. While no changes were observed in the efficiency level of Banvit, Kerevitaş Gıda, Merko, Selçuk Gıda and Tat Gıda; other firms seemed to have a fluctuating trend at efficiency levels. Considering the relation of changes in pure efficiency with managerial efficiencies/abilities Lorcu, [10] 283, it is possible to put forward that none of them experienced a continuous increases in managerial capabilities.
When examining the scale efficiency acquisitons of the firms, which implies the optimal production scale, firms were observed to have efficiency decreases (about 8%) in only 2013-2014 term, while experiencing efficieny increases in other terms. Of the 22 firms, the only firm was Merko Gida to preserve its conditions, while others seemed to have fluctuated up and down.
In sum, it is possible to declare that none of the firms experienced steady improvements in the optimal production scale for all terms.
If an evaluation based on changes of TFP levels covering the efficiency changes both in technical and technological efficiencies, is made it could be said that firms experienced efficiency decreases only in the 2011-2012 term regarding averages, but efficiency increases in the next terms. It is possible to assosciate that efficiency loss with that of technological loss at the same period.
Halim Tatli et. al.| July.-August. 2017| Vol.6| Issue 4|25-34 30 Table 2: Results of Malmquist Total Factor Productivity Analysis (2011-2015)\
DMUs TECHNICAL EFFICIENCY CHANGE (TEC) TECHNOLOGICAL EFFICIENCY CHANGE (TC)
PURE EFFICIENCY CHANCE
(PTEC)
SCALE EFFICIENY CHANGE
(SEC)
TOTAL FACTOR PRODUCTIVITY CHANGE (TFPC) 2011-2012 201 2-201 3 201 3-201 4 201 4-201 5
2011-2012 2012-2013 2013-2014 2014-2015 201 1-201 2 201 2-201 3 201 3-201 4 201 4-201 5 201 1-201 2 201 2-201 3 201 3-201 4 201 4-201 5 20 11-20 12 20 12-20 13 20 13-20 14 20 14- 20 15 1 Altınya ğ Kom. A.Ş.
0,746 0,7
00 0,8 80
1,1
77 0,340 1,171 1,037 1,110 0,7 54 0,6 96 0,9 37 1,0 35 0,9 90 1,0 06 0,9 39 1,0 70 0,7 54 0,8 20 0,9 12 1,4 16
2 A.V.O.D Gıda ve Tarım
1,390 1,183 1,167 0,936 0,878 0,658 1,277 1,215 1,345 1,379 1,000 0,954 1,033 0,942 1,167 1,000 1,220 1,359 1,457 1,130
3 Banvit 1,362 1,000 0,696 1,017 1,002 1,544 1,356 1,394 1,000 1,000 1,000 00 1,0 1,362 1,000 0,696 17 1,0 0,916 1,544 1,466 1,327
4 Coca
Cola 0,934
0,6
47 0,693 1,107 1,002 1,259 1,581 1,394 1,000 1,000 0,609 1,000 34 0,9 0,647 0,975 1,282 0,935 0,815 0,938 1,023
5 Dardan
el 1,495
1,3 76
0,6 54
0,7
65 1,339 0,762 0,759 1,114 1,1 76 1,3 72 0,5 55 1,0 67 1,4 41 1,0 01 0,9 99 0,7 17 1,2 69 1,0 94 0,7 65 1,3 82
6 Ersu Gıda 1,383 1,4 62
0,9 18
1,2
05 0,739 1,252 1,037 0,715 1,4 21 1,5 78 0,9 90 1,0 10 0,9 74 0,9 51 0,9 27 1,1 93 1,0 22 1,0 56 0,9 52 0,8 61
7 Frigo Pak Gıda
1,066 1,190 0,848 0,687 1,010 0,789 1,666 1,413 1,056 1,109 1,000 0,774 1,009 1,073 0,848 0,667 1,076 0,939 1,275 1,344
8 Karasusan Su Ü.
1,188 0,692 0,730 1,019 0,363 1,271 1,026 0,728 1,000 0,511 0,703 1,453 1,188 1,353 0,657 1,097 0,707 0,879 0,836 1,198
9 Kent Gıda 0,617 1,3 98
1,0 00
1,3
46 0,664 0,667 1,216 1,029 1,0 00 1,0 00 1,0 00 0,7 65 0,4 17 1,3 98 1,0 00 0,7 36 1,1 10 1,1 21 1,2 16 0,7 02
10 Kerevitaş Gıda 1,356 1,000 0,654 1,202 0,538 1,250 0,686 0667 1,000 1,000 1,000 1,000 1,356 1,000 0,754 01 1,2 0,956 1,250 1,364 0,821
11 Konfrut Gıda 0,986
0,6
56 1,136 0,838 1,113 1,169 1,018 0,875 1,105 0,602 1,134 0,855 92 0,8 1,089 1,001 0,980 1,097 0,767 1,156 0,733
12 Kristal Kola 1,120
0,6 57
0,6 47
1,3
04 0,785 1,311 1,465 0,722 1,3 47 0,9 22 0,6 73 1,3 17 1,3 98 0,7 13 0,9 61 1,3 19 1,1 73 1,5 18 0,9 48 1,2 03
13 Merko Gıda 1,000 1,0 00
1,0 00
1,0
00 1,396 0,613 1,642 0,742 1,0 00 1,0 00 1,0 00 1,0 00 1,0 00 1,0 00 1,0 00 1,0 00 1,3 96 0,6 13 1,4 62 0,7 42
14 Mert Gıda 1,120 0,666 0,866 1,389 1,139 1,118 1,337 0,659 1,358 0,783 1,278 1,000 0,825 0,565 0,678 89 1,3 1,276 0,647 1,417 1,404
15 Oylum Sınai 1,429
0,7
76 0,616 0,633 1,446 0,673 1,552 0,611 1,521 0,711 0,710 1,311 51 1,5 0,810 1,015 0,633 1,295 0,772 0,645 0,663
16 Pengue n Gıda 0,769
1,4 83
0,7 54
0,6
64 1,065 0,647 1,407 1,741 0,7 61 1,2 35 0,7 60 0,6 05 1,0 10 1,0 77 0,9 93 0,8 98 0,8 19 1,2 54 1,0 61 0,9 96
17 Pınar Süt 0,956 0,9 58
0,9 59
1,3
53 1,091 1,047 1,162 0,820 1,0 00 0,9 75 1,0 25 0,9 60 0,9 56 0,9 82 0,9 35 1,4 10 1,0 43 1,0 03 1,1 14 1,1 09
18 Selçuk Gıda 0,647 1,485 1,000 1,000 0,504 1,493 1,379 0,708 1,000 1,000 1,000 1,000 0,602 1,493 1,000 00 1,0 0,526 1,557 1,379 0,708
19 Tat
Gıda 0,653
1,5
35 0,733 1,365 0,479 1,428 0,829 1,388 1,000 1,000 1,000 1,000 53 0,6 1,435 0,733 1,365 0,713 1,509 0,645 1,494
20 Vanet Gıda 0,543
0,7 45
0,9 64
1,2
07 0,520 1,229 1,069 0,848 0,5 55 1,6 78 0,8 45 1,2 90 1,1 94 1,4 85 1,1 41 0,6 67 0,6 22 0,9 16 1,0 31 1,0 23
21 Pınar Et 0,655 1,4 23
1,0 42
0,7
08 0,866 1,403 0,667 1,283 0,6 55 1,2 55 1,2 46 0,9 60 0,6 60 1,3 74 0,9 09 0,7 34 1,1 96 1,4 20 1,1 59 0,7 89
22 Pınar Su 1,435 0,937 0,765 1,333 0,823 1,131 1,028 0,755 1,120 0,821 0,750 1,432 0,875 1,141 0,869 64 1,1 1,166 1,059 1,146 1,377
Minimum 0,417 0,6
47 0,6 16
0,6
33 0,34 0,613 0,667 0,611 0,5 55 0,5 11 0,5 55 0,6 05 0,4 17 056 5 0,6 57 0,6 33 0,5 26 0,6 13 0,6 45 0,6 63
Maksimum 1,495 1,535 1,167 1,389 1,446 1,544 1,666 1,441 1,421 1,678 1,278 53 1,4 1,551 1,493 1,167 10 1,4 1,396 1,557 1,466 1,494
Average 1,030 1,044 0,851 1,057 0,868 1,086 1,191 0,983 1,057 1,029 0,919 36 1,0 1,015 1,070 0,918 25 1,0 0,922 1,087 1,107 1,066
Standart
Deviation 0,328
0,3 27
0,1 67
0,2
53 0,326 0,304 0,302 0,298 0,2 44 0,2 97 0,1 94 0,2 12 0,2 91 0,2 64 0,1 40 0,2 51 0,3 42 0,3 01 0,2 58 0,2 79 Source: Obtained by authors with Win4DEAP 1.1.2. programme.
Table 3: Efficiency Values of Four Terms
Years TEC TC PTEC SEC TFPC
2011-2012 1,030 0,868 1,057 1,015 0,922
2012-2013 1,044 1,086 1,029 1,070 1,087
2013-2014 0,851 1,191 0,919 0,918 1,107
2014-2015 1,057 0,983 1,036 1,025 1,066
Minimum 0,851 0,868 0,919 0,918 0,922
Maksimum 1,057 1,191 1,057 1,070 1,087
Average 0,995 1,032 1,010 1,007 1,045
Standart Deviation 0,096 0,138 0,061 0,063 0,084
Making an evaluation covering all of the firms and examining improvements for all efficiency kinds; firms seemed to experience efficiency losses only in technical efficiency averages, but to have efficiency improvements in all other kinds. The most
efficiency improvements was 4,5% in TFP level.Moving by the periodic averages, changes achieved in technical efficiency, technological efficiency and TFP are presented in Table 1 below.
0.8 0.8 5 0.9 0.9 5 1 1.0 5 1.1 1.1 5 1.2 1.2 5
20 11 -2 012 20 12 -2 013 20 13 -2 014 20 14 -2 015
TEC TC TFPC
Figure 1: Trend of technical efficiency, technological efficiency and total factor productivity change
As seen in Table 1; technical efficiency, technological efficiency and TFP values were rising until 2012-2013 term. While technical efficiency hit the bottom on 2013-2014 term, the others were still rising. Technological efficiency value peaked in 2013-2014 term. Technical efficiency were seen to have increased, while the others to have decreased towards to last term.
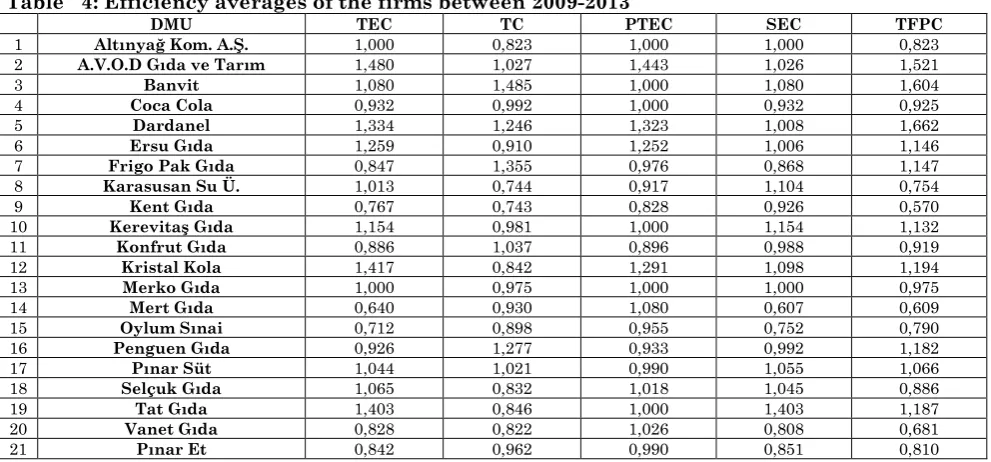
Examining the changes of all efficiency levels of the firms as a whole in Table 4; it is possible to express that the most efficiency increases experienced by all firms were seen in pure technical efficiency level
with an average 5.6%, while the most efficiency decreases were seen in technological efficiency level with an average 2% for these five years. Moreover firms seemed to have efficiency improvement at about 3.7% in TFP. A.V.O.D. Gida and Tarim, Dardanel were seen to have steady improvements in all kinds of efficiencies fo these five years. But on the contrary, Kent Gida, Oylum Industry, Pınar Et were observed to have experienced decreases in all kind of efficiencies. Dardanel was in the first rank with the improvement of 66%, whereas Kent Gıda was in the last place with 43% loss in TFP.
Table 4: Efficiency averages of the firms between 2009-2013
DMU TEC TC PTEC SEC TFPC
1 Altınyağ Kom. A.Ş. 1,000 0,823 1,000 1,000 0,823
2 A.V.O.D Gıda ve Tarım 1,480 1,027 1,443 1,026 1,521
3 Banvit 1,080 1,485 1,000 1,080 1,604
4 Coca Cola 0,932 0,992 1,000 0,932 0,925
5 Dardanel 1,334 1,246 1,323 1,008 1,662
6 Ersu Gıda 1,259 0,910 1,252 1,006 1,146
7 Frigo Pak Gıda 0,847 1,355 0,976 0,868 1,147
8 Karasusan Su Ü. 1,013 0,744 0,917 1,104 0,754
9 Kent Gıda 0,767 0,743 0,828 0,926 0,570
10 Kerevitaş Gıda 1,154 0,981 1,000 1,154 1,132
11 Konfrut Gıda 0,886 1,037 0,896 0,988 0,919
12 Kristal Kola 1,417 0,842 1,291 1,098 1,194
13 Merko Gıda 1,000 0,975 1,000 1,000 0,975
14 Mert Gıda 0,640 0,930 1,080 0,607 0,609
15 Oylum Sınai 0,712 0,898 0,955 0,752 0,790
16 Penguen Gıda 0,926 1,277 0,933 0,992 1,182
17 Pınar Süt 1,044 1,021 0,990 1,055 1,066
18 Selçuk Gıda 1,065 0,832 1,018 1,045 0,886
19 Tat Gıda 1,403 0,846 1,000 1,403 1,187
20 Vanet Gıda 0,828 0,822 1,026 0,808 0,681
21 Pınar Et 0,842 0,962 0,990 0,851 0,810
Halim Tatli et. al.| July.-August. 2017| Vol.6| Issue 4|25-34 32
22 Pınar Su 1,324 0,802 1,321 1,002 1,222
Minimum 0,640 0,743 0,828 0,607 0,570
Maksimum 1,480 1,485 1,443 1,403 1,662
Average 1,043 0,980 1,056 0,987 1,037
Standart Deviation 0,240 0,199 0,161 0,157 0,301
Source: Obtained by authors with Win4DEAP 1.1.2. Programme.
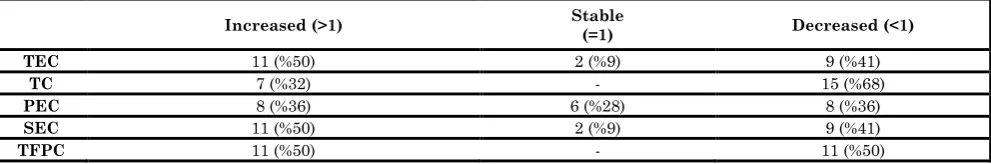
Changes experienced by the firms on the basis of all efficiency kinds for these five
years were presented in Table 5 in terms of direction and numbers.
Table 5: Variation of Efficiencies of Firms (2011-2015)
Increased (>1) Stable (=1) Decreased (<1)
TEC 11 (%50) 2 (%9) 9 (%41)
TC 7 (%32) - 15 (%68)
PEC 8 (%36) 6 (%28) 8 (%36)
SEC 11 (%50) 2 (%9) 9 (%41)
TFPC 11 (%50) - 11 (%50)
Source: Obtained by authors with Win4DEAP 1.1.2. Programme.
It may be said that 11 firms in technical efficiency, 7 firms in technological efficiency 8 firms in pure efficiency, 8 firms in scale efficiency and 11 firms in TFP achieved improvements for this five years period. Comparing numerically, it possible to say that half of the firms made improvements especially on technical efficiency, scale efficiency and TFP levels [28-37].
Conclusion
Food sector exists ar present in the manufacturing industry to be supplier of the basic and primary needs of human beings. This sector is one of the strategical sector of Turkish economy because of its share in GDP and high level of added value and the employment it creates.
It is possible to say that efficiency and productivity analysisis can help develop suggestions for source efficiency and other policies implemented by policy makers. In that frame, this study analyzed TFP and production efficiency of 22 firms of food industry listed in BIST with data belonging the years of 2011-2015.
As a result of the analysis, considering the term 2009-2013 as whole and evaluating
improvements achieved in all kind efficiencies, it is observed that firms had some losses only in the technical efficieny level, while they got improvements in other types of efficiencies.
The highest improvement is at TFP with % 4,5. A.V.O.D. Gida and Tarim and Dardanel were the only firms to have improvements in all kinds of efficiencies; while Kent, Oylum and Pinar Et were the only firms to have efficiency losses in all efficiency types. Ranking firms on the basis of improvement in TFP, while Dardanel is first firm with %66 improvement, Kent Gida is last one with the % 43 loss.
Main restrictions of this study were Malmquist TFP analysis, data set belonging to the period of 2011-2015and Win4DEAP 1.1.2. programme. Additionally the types and numbers of input and output variables can be considered other restrictions. Thus, it can be specified that the validity of the findings of this study can be enhanced with changing of analysis method, analysis programme, data set and the number and type of variables.
References
1. Kalirajan KP, Shand RT (1999) Frontier Production Functions and Technical Efficiency Measures. Journal of EconomicSurveys, 13(2):149-172. http://doi.org/10. 1111/1467-6419.00080
The Journal of Economics, Business and Finance, 22(250):154-171.
3. Dizkırıcı AS (2014) “Measuring the Financial Performances of the Companies Listed on Istanbul Stock Exchange Food, Beverage Index via Data Envelopment Analysis and Their Comparision According to Malmquist Index”. The Journal of Accounting and Finace, July/2014, 151-170.
4. Çakır SP, erçin S (2012) Efficiency
Measurement in Public Sugar
Refineries: Dea-Malmquist Tfp
Application”. Journal of Social Sciences
of Anatolian University, 12(4):49-64. 5. Sevim C (2006) “The Structure of
Turkish Agriculture, Agricultural Policies and Efficiency Comparisons in the Process of Adaptation to European Union”. (Unpublished Thesis of M.Sc., Gazi University Social Sciences Institute, Ankara).
6. Bilik M, Aydın Ü, Kahyaoğlu H (2016) “Short and Long Run Efficiency of Turkish Food Industry: A Stochastic Frontier Analysis”. Çankırı Karatekin University Journal of The Faculty of Economics and Administrative Sciences, http://dx.doi.org/10.18074/cnuiibf.449 7. Chang CL, Robin, S (2008) “Public
Policy, Innovationand Total Factor Productivity: An Application to Taiwan’s Manufacturing Industry”. Mathematics and Computers in Simulation, 79:352-367.
8. Georganta Z (1997) “The Effect of a Free Market Price Mechanism on Total Factor Productivity: The Case of The Agricultural Crop Industry in Greece”. International Journal of Production Economics, 52:55-71
9. Deliktaş E (2002) “Efficiency and Total factor Productivity Analysis in Private Manufacturing Industry in Turkey”. The Journal of METU Development, 29(3-4): 247-284.
10. Lorcu F (2010) “Malmquist Producticity Index: An Application of Turkish Automotive Industry”. Istanbul University Journal of the School of Business Administration, 39 (2): ss.276-289.
11. Yaylacı Ö (2009) “An Empirical Analysis of Efficiency and Productivity Change In The Global Automotive Industry: A Malmquist Productivity Index Approach”. (Yayımlanmamış Yüksek Lisans Tezi, Bilkent Üniversitesi Sosyal Bilimler Enstitüsü, Ankara).
12. Madden G, Savage SJ (1999) “Telecommunications Productivity, Catch- Up and Innovation”. Telecommunications Policy, 23(1):65-81. 13. Managi S, Opaluch D, Grigalunas TA (2006) “Stochastic Frontier Analysis of Total factor Productivity in the Off-Shore Oil and Gas Industry”. Ecological Economics, 60:204-215.
14. Chen Y (2011) “Productivity of Automobile Industries Using The Malmquist Index: Evidence From The Last Economic Recession”. Journal of Centrum Cathedra, 4(2): 165-181. 15. Sheng Y, Song L (2013) “Re-Estimation
of Firms' Total Factor Productivity in China's Iron and Steel Industry”. China Economic Review, 24:177-188.
16. Yalçıner K, Atan M, Boztosun D (2005) “The Relationship between Financial Ratios and Stock Returns”. The Journal of Accounting and Finance, 3 (27):176-187.
17. Grifell T, ve Lovell CA (1995) “A Note on the Malmquist Productivity Index”. Economic Letters, 47,169:175.
18. Caves DW, Christensen LR, Diewert WE (1982)"Multilateral Comparisons of Output, Input, and Productivity Using Superlative Index Numbers". The Economic Journal, 92(365), 73:86.
19. Grosskopf S (1993) The Measurement of Productive Efficiency: Techniques and Applications. H.O.Fried, C.A.K. Lovelland S.S. Schmith (Ed.). New York: Oxford University Press.
20. Cingi S, Tarım A (2000) “Performance Appraisal in Turkish Banking System-A Study of Malmquist TFPI”. Journal of Researches Notification, (01):1-34. 21. Coelli TJ, Rao DSP, O’Donnell TJ,
Halim Tatli et. al.| July.-August. 2017| Vol.6| Issue 4|25-34 34
22. Cingi S, Tarım ŞA (2000) “Performance Appraisal in Turkish Banking System: A DEA Approach with TFP Index”. Journal of the Banks Association of Turkey, (01):1-34.
23. Färe R, GrosskopfS, Norris M, Zong ZY (1994) “Productivity Growth Technical Progress and Efficiency Change in Industry”. American Economic Review Combine with Journal of Economics Literature and Journal of Economic Respect, N.84:66-80.
24. Rezitis AN (2006) “Productivity Growth in the Grek Banking Industry: A Nonparametric Approach”. Journal of Applied Economics, 9 (1):119:138.
25. Mahadevan R (2002) “A DEA Approach to Understanding The Productivity Growth of Malaysia’s Manufacturing Industries”. Asiapasific Journal of Management, 19, 587-600.
26. Kök R, Şimşek N (2006) “Industry Domestic Trade, Patents and International Technological Spread”. UE-TEK International Conference of Economy, Ankara: Turkish Economic Association.
27. Herrero IP, ascoe S (2004) “Analysing the Effect of Technical Change on Individual Outputs Using Modified Quasi-Malmquist Indexes”. Journal of The Operational Research Society, 55:1081-1089.
28. Akhisar İ, veTezergil SA (2014) “Malmquist Total Productivity Index: The Application of Turkish Insurance Sector”. Journal of Financial Researches and Studies, 5 (10), 1:14.
29. Norman M, ve Stoker B (1991) Data Envelopment Analysis: The Assessment of Performance. John Wiley&Sons, New York.
30. Coelli TJ (1996) “A Guide to DEAP Version 2.1: A Data Envelopment Analysis Program”. Center for Efficiency and Productive Analysis Working Paper, No.8.
31. Ministry of Science, Industry and Technolgy, Industry General Directorate. (2016). Food and Beverages Sectoral Report, Sectoral Reports and Series of Analysis. http://sgm.sanayi.gov.tr
/Files/Documents/gida-ve-icecek-sektoru-ra-352016143642.pdf. (Accessed Date: 20.09.2016).
32. OH D, Heshmati A, ve Lööf H (2014) “Total Factor Productivity of Korean Manufacturing Industries: Comparison of Competing Models with Firm-level Data”. Japan and the World Economy, 30:25-36.
33. Özdemir A, Düzgün R (2009) “Efficiency Analysis of Automotive Firms in Turkey According to Capital Structure”.
Ataturk University Journal of
Economics and Administrative Sciences,
23(1):147-164.
34. Rodmaneeand S, Huang WC (2013) “Efficiency Evaluation of Food and Beverage Companies in Thailand: An Application of Relational Two-Stage Data Envelopment Analysis”. International Journal of Social Science and Humanity, 3(3):202-205, DOI:10.7763/IJSSH.2013.V3.227
35. Social Security Institurion (2013).
Statistics Yearbooks 2013.
36. Süleyman Y, Atağan G (2009) “Confusion of Efficiency, Effectiveness and Productivity”. Journal of Economics and Administrative Sciences of Atatürk University, 23(4), 1:13
37. United Nations Department of Economic and Social Affairs. (2015). World Population Prospects: 2015
Revision. United
Nations.https://esa.un.org/unpd/wpp/pu blications/files/key_findings_