CHURN PREDICTION IN MOBILE TELECOM SYSTEM
USING DATA MINING TECHNIQUES
DR. M.BALASUBRAMANIAN *, M.SELVARANI
**Department Of Computer Science,
Annamalai University, Chidambaram Abstract- At present situation, telecommunication department plays vital role in our day today human life. At the same time telecommunication area attains a rapid growth in very short period of years. Due to this fact, Telecom department is one of the senses deciding factor in world market. Because of this reason, this field turned out to be a most profitable area for investment. At the mean time competition between telecom industries is also there in the market. So churn prediction is very essential in telecom industries to retain their customers. This study focuses on data mining techniques for reducing customer churn and also likely to reduce error ratio.
Index Terms- Churn Prediction, Telecom System, Data Mining, Decision Tree, Neural Network
I. INTRODUCTION
Today, telecommunication market all over the world is facing a severe loss of revenue due to fierce competition and loss of potential customers. To keep the competitive advantages and acquire as many customers as possible, most operators invest a huge amount of revenue to expand their business in the very beginning [1]. Therefore, it has become vital for the operators to acquire the amount invested and to gain at least a minimum profit within a very short period of time. Because it is very much challenging and tedious issue to keep the customers intact for a long duration due to the competition involved in this business field. To survive in the market, telecom operators usually offer a variety of retention policies to attract new customers. This is the major cause of the subscribers leaving one network and moving to another one which suits their needs. According to telecom market, the process of subscribers (either prepaid or post paid) switching from continues to happen for any telecom industry, it would lead to the great loss of revenue to the company. In this situation, the only remedy to overcome such business hazards and to retain in the market, operators are forced to look for alternative ways of using data mining techniques and statistical tools to identify the cause in advance and to take immediate efforts in response. This is possible if the past history of the customers is analyzed systematically. Fortunately, telecom industries generate and maintain a large volume of data. They include Billing information, Call detail Data and Network data. These statistical tools are to identify the cause in advance and to take immediate efforts in response. This is possible if the past history of the customers is analyzed systematically. Fortunately, telecom industries generate and maintain a large volume of data. They include Billing information, Call detail Data and Network
data. This voluminous amount data ensures the scope for the application of data mining techniques in telecommunication database. As plenty of information is hidden in the data generated by the telecom industries, there is a lot of scope for the researchers to analyze the data in different perspectives and to help the operators to improve their business in various ways. The most common areas of research in telecom databases are broadly classified into 3 types, i) Telecom Fraud Detection ii) Telecom Churn Prediction iii) Network Fault Identification and Isolation. Moreover, not all the data items of the telecom database are used by all the techniques. Only the relevant data items which really contribute to the specific analysis must be considered for any study. This study focuses on churn prediction, the importance of feature extraction (attribute selection) and the use of data mining techniques in churn prediction in telecomm data.
II. CHURN PREDICTION-PROBLEM DESCRIPTION In a business environment, the term, customer attrition simply refers to the customers leaving one business service to another. Customer churn or subscriber churn is also similar to attrition, which is the process of customers switching from one service provider to another anonymously. From a machine learning perspective, churn prediction is a supervised (i.e. labeled) problem defined as follows: Given a predefined forecast horizon, the goal is to predict the future churners over that horizon, given the data associated with each subscriber in the network [7]. The churn prediction problem represented here involves 3 phases, namely, i) training phase, ii) test phase, iii) prediction phase. The input for this problem includes the data on past calls for each mobile subscriber, together with all personal and business information that is maintained by the service provider. In addition, for the training phase, labels are provided in the form of a list of churners. After the model is trained with highest accuracy, the model must be able to predict the list of churners from the real dataset which does not include any churn label. In the perspective of knowledge discovery process, this problem is categorized as predictive mining or predictive modeling. Churn Prediction is a phenomenon which is used to identify the possible churners in advance before they leave the network. This helps the CRM department to prevent subscribers who are likely to churn in future by taking the required retention policies to attract the likely churners and to retain them. Thereby, the potential loss of the company could be avoided. This study utilizes data mining techniques to identify the churners.
III. PROPOSED METHODOLOGY
KDD (Knowledge Discovery in Databases) is defined as the “non trivial process of identifying valid, novel, potentially useful and ultimately understandable patterns of in data”. The problem of our discussion deals with the discrete valued target variable and our ultimate aim is to declare each subscriber as „potentially churner‟ or “potentially non churner”, so the KDD function for our problem is defined to be the classification problem. The first step in predictive modeling is the acquisition and preparation of data. Having the correct data is as important as having the correct method. The following methodologies are given below
A. Data Acquisition
Data Acquisition is a difficult problem for the researchers to acquire the actual dataset from the telecom industries. This is because the customer’s private details may be misused. The dataset for this study was acquired from a PAKDD – 2006 data mining competition [8]. Since churn prediction models requires the past history or the usage behavior of customers during a specific period of time to predict their behavior in the near future, they cannot be applied directly to the actual dataset. Therefore, it is the usual practice to perform some kind of aggregation on the dataset. During the process of aggregation, in addition to the actual variables, new variables will be generated which exhibit the periodic consuming behavior of the customers. These variables possess vital information to be used by the prediction models in forecasting the behavior of customers in advance. The dataset used here was aggregated for 6 months duration.
B. Data Preparation
In data mining problems, data preparation consumes considerable amount of time. In the data preparation phase, data is collected, integrated and cleaned. Integration of data may require extraction of data from multiple sources. Once the data has been arranged in tabular form, it needs to be fully characterized. Data needs to be cleaned by resolving any ambiguities, errors. Also redundant and problematic data items are to be removed at this stage. Not all fields of the database are always suitable for modeling purposes. Fields with unique values, like addresses or personal unlock codes are need not be used. These do not have predictive value as they uniquely identify each row.Also fields with only one value are left out, as these represent a negligible part of the data. Finally, fields with too many „null‟ values are also excluded. In addition, personal data that is available is assumed to be reliable. Also in training dataset, most of the values for the attribute DAYS_TO_CONTRACT_EXPIRY are undefined and are given the value 0. In the case of AGE attribute, undefined values are filled with the median of the values of the corresponding attribute domain.
C. Derived Variable
Derived variables are new variables based on original variables. The most effective derived variables are those that represent something in the real world, such as a description of some underlying customer behavior [3]. Because the original variables themselves are aggregated, they can also be called as derived
variables. In our dataset, the variable DAYS_TO_CONTRACT_EXPIRY is a derived variable which is calculated by subtracting the starting date of the connection from the current date on which this prediction is applied. There are some general classes of derived variables, like total values, average values, and ratios. Our study considers the average value over the last six months as a derived variable type. Also, the ratio between the average over the last three months and the average over all months before is used as a derived variable. In addition a number of specific derived variables are used. Some examples are:
The average number of calls in last 6 months
The average number of overdue in last 6 months
The ratio of incoming and outgoing calls
Average payment amount for last six months
Average overdue count in last 6 months
The derived variables explain customer behavior in a better way than the original variables. For instance, knowing how many months it was since a customer called his voicemail is much more informative than knowing if a customer called his voicemail this month. In addition to the actual attributes, a number of derived variables are proposed which describe customer behavior in a better way. The data is already aggregated for 6 months time period. Once in every six months aggregation is performed. For modeling purposes this is the desired level of aggregation. Daily or weekly aggregated data will not offer any advantages over monthly aggregated data. For training purpose, a dataset of 18,000 customers are considered and this count is more than sufficient to train the model. And for testing purpose, dataset with 6,000 records are used. Each dataset consisted of 252 attributes and almost 50% of them are derived attributes. Not all the 252 attributes are used for modeling. Only relevant attributes are extracted from (including both actual and derived group) the dataset.
D. Variable Extraction
By referring to the previous research papers regarding this study, based on manual inference and the information gathered from the telecom company’s personals, we have selected possible variables for modeling the decision tree. Among them, the most significant variables that have higher contribution to predict the churn are selected. The selected variables are grouped under 4 categories and are described below
.
(i) Customer Demography
Age - It is found that the customers between the age group of 45 – 48 have high probability to churn.
Line_Tenure - Customers with 25 – 30 months of tenure period are about to churn.
Customer_Class – Generally the churn probability of the corporate account holders is high. This is due to the fact that their account will be maintained by the company and customers who quit the company would churn. The Customer_Class can be any one of VIP /Individual/Corporate.
Days_to_Contract_Expiry - Most of the customers would subscribe to a new service with the intention acquiring new HAND_SET. These people would leave the network after the contract expires.
(ii) Bill and Payment
Average_Bill_Amount - If the customer‟s average bill amount for the past 6 months is less than or equal to 190 NT, there is a high propensity to change.
Avg_Pay_Amount – If the Customer‟s average monthly payment for the past 6 months is less than $100 or between $520 $550, they have a chance to leave the network.
Overdue_Payment_Count – If this count is greater than 0 and less than 4 in the past 6 months, those customers may churn.
iii) Call Detail Record
Avg_Min_OB: If the average out bound call is less than 168 minutes they will churn.
Tot_Past_Delink: If the count of total past delink is greater than 3 then they will churn.
Tot_Dis_Int: If the customers who make more number of distinct international calls then they will churn. If the count is greater than 6 they may churn.
iv) Customer Care Service
Sub_Plan-Change_Flag - Customers who change their subscription plan often may churn. If this flag set to 1, which indicates their dissatisfaction with the current service plan. They may go for other operator’s services.
ID_Change_Flag: Customers who often change their account information may churn. If this flag is set to 1 they will churn.
Black_List_Count - Customers who have been black listed for more than 2 times in the past six months are about to churn.
Tele_Change_Flag – Cutomers who often change their phone numbers shows their dissatisfaction with the operator‟s service. If this count is > 2 those are probable to churn.
Pay_Metd_Change – Customers shows their dissatisfaction by changing their payment method often. If this count > 3 they may quit the service.
IV. MODEL CONSTRUCTION
The model created for this study is shown in Figure 1. The rule set described above for the feature variables are used for training the decision tree model and the neural network model. As there are no statistical methods applied to the selection of feature set, the Information gain and Entropy of the attributes are calculated to prove the effectiveness in finding the churn. As already mentioned, data is aggregated for six months. It means the
customer’s behavior during the past 6 months was used in predicting the churners during the 7th month. Following are the steps to be followed for the churn prediction
1. Initially, for each attribute, a threshold value is assigned. 2. The attribute values of the training dataset are compared with the attribute’s threshold to declare that a customer will churn or not. Simple if…then …else rules are applied in this process. 3. A model is then constructed for the training dataset.
4. The model is then applied on the test dataset and the results are listed.
5. The above steps can be repeated by varying the threshold values of the attributes selected.
Figure 1: Data Mining A Strategic Tool For Mining Telecom System
The term, Data mining is very generic and it refers to mining data to discover knowledge (information). In literature, it is defined as a process of extraction and analysis of patterns, relationships and useful information from massive databases. This mining process is also called as Knowledge Discovery in databases (KDD). In any data mining process, there are four subtasks involved. They are: classification, clustering, regression and association rule learning [4]. Moreover, depending on the domain of application, data mining techniques are divided into two major categories: i) hypothesis) and ii) Discovery oriented (the system finds new rules and patterns autonomously) [5]. Verification Methods deal with evaluation of a hypothesis proposed by an external source. Statistical methods such as
goodness-of-fit test, t-test of means and analysis of variance comes under this category. These methods are less associated with data mining techniques than their discovery oriented counter parts because most data mining problems are concerned with selecting a hypothesis (out of a set of hypotheses) rather than testing a known one [6]. But discovery methods are used to identify patterns in data automatically
Data mining techniques are applied in telecom data base for various purposes. Each uses different type of telecom data depending on the purpose. The data generated by telecom industries are broadly grouped into 3 types. They are: i) Customer data (Demography) ii) Network data iii) Bill data.
V. PERFORMANCE MEASURES
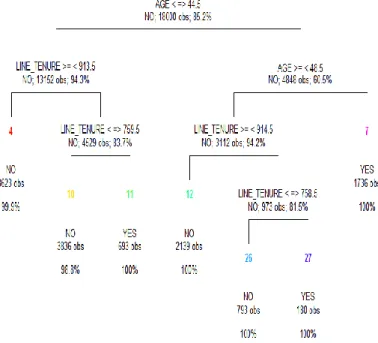
Performance of a classification model is based on the counts of test records correctly and incorrectly predicted by it. These counts are tabulated as a table called confusion matrix. Decision tree graph is shown in Figure 2 and confusion matrix is shown in Table 1.
Figure 2: Decision tree of the training dataset for the customer demographic attributes
Table 1: confusion matrix for decision tree model for demographic data attributes
The accuracy of the model is calculated using the following formula,
Accuracy =
=
Accuracy = 98.88%
Error Rate =
=
Error Rate = 1.116667%
From the above calculations, we observed the predictive accuracy of 98.88% and error rate of 1.11167% for our decision tree model. Also it has the false positive of 0.93% and false negative of 2.23%. Similarly, the predictive accuracy and other measures are calculated for the neural network model.
VI. CONCLUSION
From this study, it is observed that decision tree model surpasses the neural network model in the prediction of churn and it is also easy to construct. Selecting the right combination of attributes and fixing the proper threshold values may produce more accurate results. This study limits itself with prediction of churn and no steps were analyzed to include retention policies. The future research direction may be to analyze the retention policies by selecting appropriate variables from the dataset.
REFERENCES
[1] Yu-Teng Chang, “Applying Data Mining To Telecom Churn Management”, IJRIC, 2009 67 – 77.
[2] Rongbin Zhang, Ronghua, Yanying Zhrng, Michael Berry. “Behavior – Based Telecommunication Churn Prediction with Neural Network Approach”, page 307- 310, ISCCS.2011.
[3] M. Berry and G. Linoff. Mastering Data Mining. John Wiley and Sons, New York, USA, 2000.
[4] Gary Cokins, Ken King, “Managing Customer Profitability and Economic Value in the Telecommunication Indutry”, SAS Institute White paper. [5] Hangxia Ma, Min Qin, Jianxia Wang. (2009), “Analysis of the Business
Customer Churn Based on Decision Tree Method”, The Ninth International Conference on Control and Automation, Guangzhou, China.
Number of Correct Predictions Total Number of Predictions
833+19+48+5100
Number of WrongPrediction
Total Number of Predictions
X 100
48 + 19
6000 833+5100
[6] MO Zan, ZHOA Shan, LI Li, LIU Ai-Jun, 2007, “A predictive Model of Churn in Telecommunications Base on Data Mining”., IEEE International Conference on Control and Automation”, Guangzhou, China.
[7] Yossi Ritcher, Elad Yom-Tov, Noam Slonim, “Predicting Customer Churn in Mobile Networks through Analysis of Social Groups”.
[8] N. kamalraj, A. malathi “A Survey on Churn Prediction Techniques in Communication Sector”.,International Journal of Computer Application, feb 2013.
[9] Hossein Abbasimehr, Mostafa Setak M. J. Tarokh, “A Neuro-Fuzzy Classifier for Customer Churn Prediction” International Journal of Computer Applications (0975 – 8887)Volume 19– No.8, April 2011 [10] Keyvan Vahidy Rodpysh, “Model to Predict the Behavior of Customers
Churn at the Industry” International Journal of Computer Applications (0975 – 8887) Volume 49– No.15, July 2012
AUTHORS
First Author* – DR.M.BALASUBRAMANIAN, PHD, ANNAMALAI UNIVERSITY and [email protected] Correspondence Author** and Second Author** – M.SELVARANI, ME, ANNAMALAI UNIVERSITY and