IMPROVING OUTCOMES FOR PATIENTS ADMITTED THROUGH THE EMERGENCY DEPARTMENT: IMPLEMENTATION OF A STANDARDIZED REPORT PROCESS
Eric Wolak
A dissertation submitted to the faculty at the University of North Carolina at Chapel Hill in partial fulfillment of the requirement for the degree of Doctor of Nursing Practice (Health Care
Systems) in the School of Nursing.
Chapel Hill 2019
©2019 Eric Wolak
ABSTRACT
Eric Wolak: Improving Outcomes for Patients Admitted Through the Emergency Department: Implementation of a Standardized Report Process
(Under the direction of Cheryl Jones)
months (p>0.05). However, patient transfer time had a statistically decreased (p<0.05) time variables, going from 30.5 minutes (SD=18.2) pre-implementation to 24.2 (SD=8.8) and 21.7 minutes (SD=7.4) post-implementation. In addition, the length of time to give/receive report for ED admissions also had a statistically decreased (p<0.05) time variables, going from 3.8
TABLE OF CONTENTS
LISTS OF TABLES ... ix
LIST OF FIGURES ... x
LIST OF ABBREVIATIONS ... xi
CHAPTER 1: INTRODUCTION ... 1
Problem Statement ... 2
Purpose ... 4
Significance to Nursing and Health Care ... 4
Chapter Summary ... 4
CHAPTER 2: REVIEW OF THE LITERATURE ... 6
Chapter Introduction ... 6
Search Strategy ... 6
Themes ... 8
Communication complexity... 8
Tools ... 13
QI strategies and Lean methodology ... 16
Chapter Summary ... 19
CHAPTER 3: THEORETICAL FRAMEWORK ... 21
Chapter Introduction ... 21
Dyadic Power Theory ... 21
Chapter Summary ... 25
CHAPTER 4: METHODS ... 26
Project Design ... 26
Setting ... 27
Intervention ... 27
Population/Sample ... 33
Data Collection ... 33
Ethics and Human Subjects ... 34
Data Analysis ... 34
Chapter Summary ... 35
CHAPTER 5: RESULTS ... 36
Chapter Introduction ... 36
Baseline Data ... 36
A3 Methodology Results ... 39
Tool Implementation Results ... 45
Project Insights... 50
Chapter Summary ... 51
CHAPTER 6: DISCUSSION ... 53
Discussion of Findings ... 53
Limitations ... 60
Implications... 63
Conclusions ... 64
APPENDIX A: LITERATURE REVIEW MATRIX INCLUDING THEMES... 66
APPENDIX B: ED TO INPATIENT HANDOFF GUIDELINE ... 72
APPENDIX C: SBAR COMMUNICATION TOOL ... 73
APPENDIX F: UNCMC NURSING RESEARCH COUNCIL PROJECT
APPROVAL ... 76
APPENDIX G: UNIVERSITY OF NORTH CAROLINA IRB APPROVAL ... 77
APPENDIX H: PROJECT INSIGHTS ... 78
LISTS OF TABLES
Table 1. Steps in the A3 Methodology (Kenney, 2011) ... 29
Table 2. Project Charter ... 29
Table 3. Deployment Plan... 31
Table 4. ED Admissions, Patient Lengths of Stay (LOS), and Wait Times ... 37
Table 5. Gaps and Root Causes ... 42
Table 6. Solution Approach ... 43
Table 7. Developed Tools for Each Gap ... 43
Table 8. ED Length of Stay ANOVA for Inpatient Admission ... 46
Table 9. ED Wait Time for Admission ANOVA ... 47
Table 10. Transfer Time from First Report Attempt to Patient Arrival ... 48
Table 11. Length of Verbal Report and Attempts ... 48
Table 12. First Report Attempt to Patient Arrival ANOVA ... 49
LIST OF FIGURES
Figure 1. PRISMA Diagram ... 7
Figure 2. Negotiation Framework (Hilligoss et al., 2015) ... 11
Figure 3. A3 Tracking Form (Kenney, 2011) ... 26
Figure 4. Unit Education Board ... 32
Figure 5. ED LOS for Admissions Box and Whisker Plot* ... 38
Figure 6. Admission Wait Time Box and Whisker Plot* ... 39
Figure 7. Current State Process Map* ... 40
LIST OF ABBREVIATIONS ANOVA Analysis of Variances
CN Charge Nurse
DNP Doctorate of Nursing Practice DPT Dyadic Power Theory
ED Emergency Department
EHR Electronic Health Record IRB Institutional Review Board LOS Length of Stay
NA Nursing Assistant
PL Project Lead
PRISMA Preferred Reporting Items for Systematic Reviews for Meta-Analysis
RN Registered Nurse
SBAR Situation, Background, Assessment, Recommendations SD Standard Deviation
QI Quality Improvement
CHAPTER 1: INTRODUCTION
The Emergency Department (ED) is often the first point of healthcare contact for many patients before they are admitted to the hospital. Consequently, the problems for which patients are treated in EDs range from very minor, with no admission required, to very serious, with lifesaving measures being required. Because Emergency Departments are required to treat all patients who seek treatment and the severity of their illnesses can vary widely, the milieu in the ED can be fast paced and, at times, chaotic. This environment creates a situation where patient information is shared during the handoff process among care providers, including Registered Nurses (RN), very quickly, and in an abbreviated format or communication style. Patient handoff is defined as the sharing of patient information from one clinician to another, either during shift change or in transitioning the patient from one area of care to another (Sorrentino, 2015).
Others (Apker, Mallak, & Gibson, 2007) point to the potential patient care quality and safety concerns that arise from incomplete or misunderstood patient information.
Problem Statement
Patient handoffs represent a critical time and event. Handoffs in health care organizations occur when patient information is shared between health care professionals -- at change of shift, when patients move from one department to another, or anytime responsibility for a patient’s care is passed from one professional to another. Although a normal part of patient care delivery, patient handoff creates an opportunity for inaccurate information to be transferred, a
misunderstanding of information transferred, and/or a lack of information to be shared (Hilligoss, Mansfield, Patterson, & Moffatt-Bruce, 2015).
Handoffs from the ED-to-inpatient units offer another unique set of challenges, primarily because the differing priorities of ED and inpatient care. For example, ED care typically focuses on triage, meeting immediate patient care needs, and then expeditious patient transition -- to home, an inpatient unit, or another facility -- to ensure ED access to the community at large (Lee et al., 2017). Patients remain in the ED for only minutes to multiple hours until they are
stabilized and can undergo a transition in care. In contrast, the priorities of inpatient care units is focused on treatment, cure and discharge – to home, another facility, or a peaceful death. These priorities mean that inpatient care is typically spread over a longer period of time – days or weeks – to allow for care to occur.
The University of North Carolina Medical Center (UNCMC), the facility where this project will be conducted, has a current average ED LOS for patients being admitted to an inpatient bed of approximately 500 minutes (E. Lawson, personal communication, April 9th, 2018; Medicare.gov, n.d.). This compares with the national average of 336 minutes (E. Lawson, personal communication, April 9th, 2018; Medicare.gov, n.d.). Furthermore, the average time from a decision to admit to the patient leaving the ED (wait time) for an inpatient area is approximately 150 minutes, compared to the national average of 137 minutes (Medicare.gov, n.d.). A potential reason identified by key UNCMC leaders for this delay is the lack of an established and consistent process for how patient transition and reporting is made between ED and inpatient nurses, and how the patient is ultimately transferred between these care areas. For example, there is no established process for how an ED RN calls report to an inpatient unit, or the structure and content of the handoff, or the tools that should be used for reporting critical patient information, or an acceptable process for the transfer, including the time of transfer or the resources needed during transfer (E. Lawson, personal communication, September 13th, 2017). This lack of a standard process not only contributes to increased opportunities for errors, but also introduces delays in care and inefficient use of ED and inpatient beds.
Purpose
The purpose of this Doctorate of Nursing Practice (DNP) quality improvement (QI) project was to implement a standardized, evidence-based ED-to-inpatient RN handoff process that improves process flow and decreases patient ED lengths of stay and wait time for admission. For the purposes of this project, the patient population of focus was ED patients being admitted to all inpatient and observation nursing units at UNCMC.
Significance to Nursing and Health Care
Approximately half of all non-obstetric hospital admissions in the United States enter the hospital through the ED (Hilligoss et al., 2015). This figure represents hundreds of thousands of patients annually who are admitted to hospitals through this path. Each of these admitted patients will have a transition point when they leave the ED and are admitted to an inpatient patient care unit. It is imperative that this transition point be efficient for a variety of key reasons. Not only is the transfer of information imperative for seamless care, but an efficient transition allows for less time in the ED, resulting in increased ED access for the community, and a more timely arrival to inpatient care. The proposed project provides an opportunity to improve patient care as they move through the system from the ED to inpatient units and, if successful, may provide a roadmap for other healthcare systems to improve and streamline their handoff and transfer process.
Chapter Summary
CHAPTER 2: REVIEW OF THE LITERATURE Chapter Introduction
This chapter reviews the current literature related to patient transition and handoff from one department to another, specifically from the ED to inpatient units. The following are included in this chapter: the search strategy, the results of the Preferred Reporting Items for Systematic Reviews for Meta-Analysis and the key themes that emerged from the review. The search strategy will be discussed first.
Search Strategy
In consultation with the health science librarian for the University of North Carolina at Chapel Hill, a search was performed via PubMed and CINAHL to evaluate current literature on patient transitions and handoffs, with a focus on the ED. Inclusion criteria were applied to focus on literature in the topic area, including clinical studies, comparative studies, multicenter studies, observational studies and/or theoretical articles. Search terms included:
(“emergency department” OR “emergency room”) OR ED OR ER AND ((handoff* OR "hand-off" OR report* OR transition* AND (admission OR admit*)) AND inpatient
AND ("length of stay" OR LOS OR “time factors”)
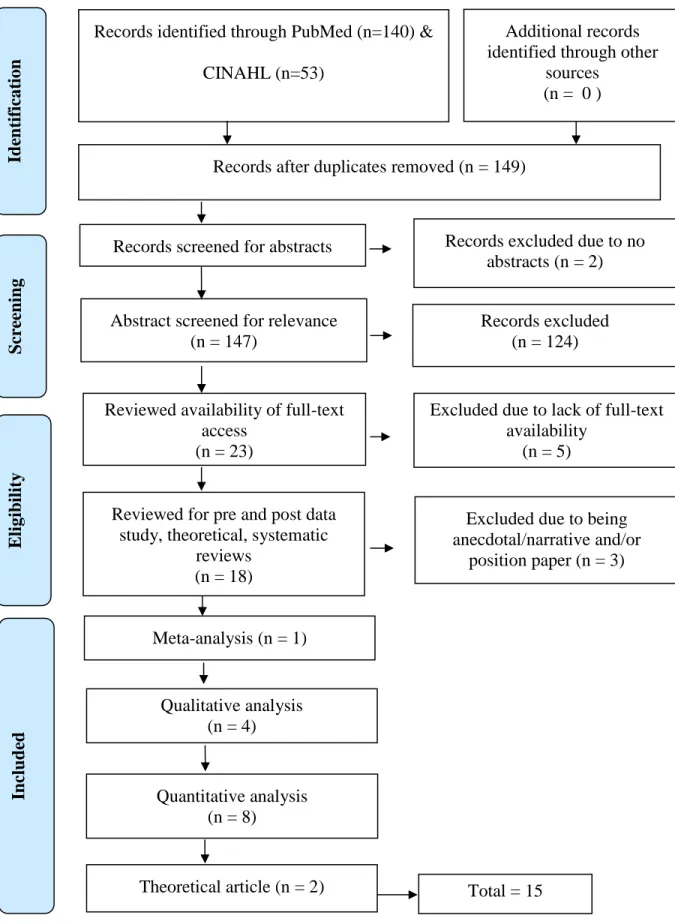
Figure 1. PRISMA Diagram
Records identified through PubMed (n=140) & CINAHL (n=53)
Total records identified (n = 193)
S cr ee n in g In clu d ed E li gib il ity Id en tif icat ion Additional records identified through other
sources (n = 0 )
Records after duplicates removed (n = 149)
Records screened for abstracts (n = 149)
Records excluded due to no abstracts (n = 2)
Abstract screened for relevance (n = 147)
Excluded due to being anecdotal/narrative and/or
position paper (n = 3) Reviewed for pre and post data
study, theoretical, systematic reviews
(n = 18)
Quantitative analysis (n = 8)
Records excluded (n = 124)
Reviewed availability of full-text access
(n = 23)
Excluded due to lack of full-text availability
(n = 5)
Qualitative analysis (n = 4)
Total = 15 Meta-analysis (n = 1)
After the elimination of duplicate articles found in both PubMed and CINAHL, a total of 149 articles were identified to be reviewed for relevance. After reviewing these article’s titles and abstracts, and focusing on articles with an emphasis on handoff theory, qualitative analysis and quantitative studies, a net total of 15 articles were considered significant to the problem and project proposal (see Appendix A).
Themes
These 15 articles were reviewed, critiqued and assessed for themes, commonalities in content, and conclusions. Three primary themes were identified. The first was the general complexity of communication. This complexity is further framed under the contexts of relaying patient acuity, relationships among parties, power distribution between parties, and disciplinary perspectives conveyed during communication (Hilligoss et al., 2015). The second theme
identified was the use of tools to standardize and facilitate handoffs. The third theme identified was a focus on quality improvement process, such as Lean, as a methodological approach to improve the ED-to-inpatient transition. Each of these three areas will be discussed in the following sections.
Communication complexity
It is estimated that approximately 80% of serious medical errors in the United States are a direct result of miscommunications between caregivers during patient handoff (The Joint
Commission, 2018). Articles retrieved in this review of literature emphasized the complexity and ambiguity of communication in healthcare settings.
described communications between ED to inpatient as a “gray zone”, and identified three key study findings: 1) communication barriers; 2) conflicting expectations of ED physicians and hospitalists about important patient information to communicate; and 3) safety concerns related to handoffs, specifically unclear admission guidelines, the high potential for missed information, and a misunderstanding of clinical presentation. These researchers noted that inconsistencies in how two individuals interpret patient information, differences in perceived priorities, and a lack of agreed-upon handoff expectations created ambiguity when information was exchanged. They also noted that the details conveyed during handoff lacked substantive patient information.
Education about communication techniques among and across disciplines is a tacit skill that is assumed to occur during the natural course of training and education, and, in turn,
eliminate the “gray zones”. However, a 2017 study by Lee et al. questioned this assumption. This cross-sectional study surveyed leaders in all physician resident programs across the nation on how they educated and evaluated resident handoffs. While 74% of program respondents indicated that they provided handoff instructions in some way, shape or form, only 37% had a structured handoff orientation process. Further, approximately 49% of educators/leaders in responding programs indicated that they do not formally evaluate resident handoffs (Lee et al., 2017). This study underscores the concern that although communication is a cornerstone of healthcare professionals, there is a lack of attention to its importance in educational programs.
than an exchange of key information. One reason that negotiation becomes more prominent during ED-to-inpatient handoffs is because such a transition requires agreement by both the ED physician and inpatient physician that a patient needs to be admitted; that decision may, at times, conflict (Hilligoss & Cohen, 2013).
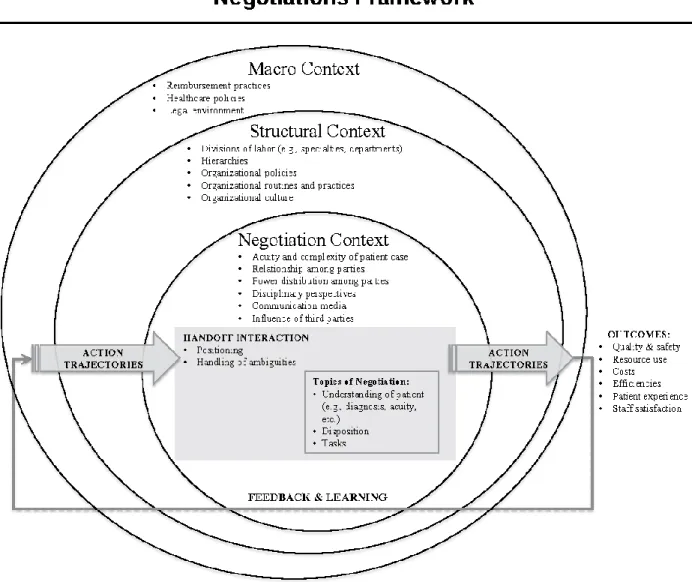
In 2015, Hilligoss et al. published a mental model for handoff negotiations (see Figure 2). Figure 2. Negotiation Framework (Hilligoss et al., 2015)
This framework is modeled after the Dyadic Power Theory (DPT) first described in 1976 by Rollins and Bahr and expanded in 2004 by Dunbar. Hilligoss et al. (2015) creates a visualization of how handoffs are negotiated under the context of patient acuity, peer to peer relationships, peer to peer power distribution, disciplinary perspectives, communication media and any third-party influences. Handoffs are either successes or failures depending upon how patient
perspectives are standardized, and if tools are used to standardize the exchange of information. Specific to ED-to-inpatient handoffs, if the contexts of negotiation are addressed, then handoffs could be expected to improve quality/safety, reduce resource utilization, decrease costs, improve efficiencies, improve patient experience and increase staff satisfaction. However, if they are not addressed, the opposite of these outcomes are at a higher risk of occurring (Hilligoss et al., 2015).
A systematic review by Walker et al. (2016) evaluated 14 articles specific to patient handoff to uncover safety issues and errors. These errors were primarily due to distractions, data omissions, poor construction of messages, failure to take note of important information or misinterpret of data provided. The exchange of information can thus contribute to patient care problems, as well as inefficient handoff reports (Brannen, Cameron, Adler, Goodman, & Holl, 2009). While this study highlighted the lack of information exchange that can often occur in patient handoff, it provided another important point: By creating a process where information on patient safety and acuity is exchanged in a consistent way, ED-to-inpatient unit handoffs could be more comprehensive.
Health care professionals may not realize that inaccurate or inconsistent information may be exchanged during handoff. A 2009 quantitative study by Brannen et al. critiqued 36 recorded handoff communications between ED and inpatient residents to determine how effective
achieving a shared understanding of illness and problems for the most critical patients. These findings suggest that often clinically significant information is not consistently relayed when report is given in an unstructured way, which can cause the receiving physician to infer assumptions.
A 2017, a nursing study evaluated the quality of nursing handoffs in an Italian teaching hospital (Ferrara, Terzoni, Davi, Bisesti, & Destrebecq, 2017). This study used the Handoff Clinical Evaluation Exercise (CEX) scale to assess 48 shift changes and 192 handoff reports by medical-surgical nurses. Nurses were asked to assess handoffs by completing the Handoff CEX scale, composed of six domains: 1) setting, 2) efficiency, 3) content, 4) communication skills, 5) clinical judgment, and 6) professionalism. These areas were scored on a scale of 0 (not relevant) to 10 (very significant). Results indicated the highest agreements were in the areas of content, communication, and efficiency, but only moderately so. The other three domains scored lower than average on agreement about handoff. Of note, this was the only nursing-specific study identified under the theme of communication complexity, which underscores the lacking literature on RN to RN handoff communication.
Tools
clinicians spent an average of 52.9 seconds discussing each patient with the accepting inpatient physician and addressed a minimum of four of the five SOUND components only 26% of the time. After implementation of the SOUND standardized approach, 352 patient admission handoffs were observed. Compliance on at least four of the five components increased to 63.6% (p<0.01) and time spent discussing each patient rose to 73.0 seconds (p<0.01) (Gopwani et al., 2015). Although more time was spent on reporting, this study demonstrated that a standardized tool could help ensure that specific information is discussed for each patient to foster
communication among different types of clinicians.
A prospective interventional study conducted on a medical unit at a general hospital in China implemented a standardized nursing verbal handoff form. This form, or tool, included patient demographics, information on falls risk, oxygen therapy, electrocardiogram monitoring, intravenous catheters or lines, naso- or gastro-intestinal decompression, indwelling catheter and pressure injury risk (Zou & Zhang, 2016). Implementation of this tool correlated with a decrease in nursing error rates from 9.2 to 5.7 per 100 admissions (p<0.001). Additionally, handoff-related error rates decreased from 2.7 to 0.3 per 100 admissions (p<0.001). Other quality metrics,
including pressure injury rates, inappropriate care of lines rates and falls rates, were significantly decreased (Zou & Zhang, 2016). As with Gopwani et al. (2015), this study suggested that a report tool may help standardize handoff reporting to facilitate the consistent exchange of information, and also that such information improves patient care and quality outcomes.
It should be noted, however, that a shared understanding of a patient’s clinical care needs does not need to occur via verbal handoff. In the fast-paced world of healthcare, the challenge of finding a concurrent time for an inpatient and outpatient clinician to exchange patient
2017). This problem was the focus of a 2017 study, which used a handoff report tool integrated in the electronic health record (EHR) to evaluate a model for electronic handoffs between the ED and inpatient units. This study addressed compliance of asynchronous report via EHR, as well as time from admission order placement in the ED to patient admission on the inpatient unit. Results of this study demonstrated consistent compliance with electronic handoff each year, increasing from 77.5% to 87.3%. Time to admission also had a significant decrease each year, resulting in a time-savings of 9 min in 2011, and 18 min in 2013 and 2014, with a p-value of <0.001 (Sanchez et al, 2017). This study supports the use of standardized tools to facilitate patient transition from ED-to-inpatient care, decreases ED LOS, and suggested that such transfer of information does not require verbal exchange/communication.
Relaying consistent information between clinicians is key in mitigating errors. A 2013 prospective study assessed rates of medical errors and preventable adverse events with pediatric patients after implementing an ED resident handoff bundle (Starmer et al., 2013). This study compared medical errors and preventable harm before and after implementation. The bundle implemented was the SIGNOUT? mnemonic (Sick or DNR, Identifying data [age, gender, and diagnosis], General hospital course [brief overview of events in hospital], New events of the day, Overall health status, Upcoming possibilities with plan, and Tasks to complete). Results
demonstrated a significant reduction in preventable medical errors, such as incorrect medications ordered and/or dosage, decreasing from 33.8 per 100 admissions to 18.3 per 100 admission (p<0.001). In addition, preventable adverse events decreased from 3.3 per 100 admissions to 1.5 per 100 admissions (p<0.05) (Starmer et al., 2013). A secondary metric of time spent by
A recurring feature of these studies is the use of standardized tools to facilitate communications, which is consistent with the negotiation conceptual model presented by Hilligoss et al. (2015) (see Figure 2). Use of a standardized report tool was reported to help address patient acuity/complexity, facilitate relationships, and reduce any potential power
distribution. By creating and consistently using an agreed-upon tool, each discipline/unit is asked to provide input into what is important to them to provide optimal patient care. This process allows for all components of patient acuity to be addressed as perceived by both the ED and inpatient arenas. It also helps establish agreed-upon expectations by both parties. Finally, by having these expectations, any form of power inequity between inpatient/outpatient or between nurse to nurse or provider to provider is reduced and/or eliminated. Once expectations are set and there is a checklist of what needs to be discussed, there is less of a “gray zone” that one must navigate (Apker, 2007). Again, it is striking that only one article in the theme of “tools” was specific to nurse-to-nurse handoff, highlighting the need for further evaluation and publication in this arena.
QI strategies and Lean methodology
admit wait time by improving the ED-to-inpatient handoff process. Framing solutions using approaches that bring focus to the quality outcomes of interest was therefore essential.
Lean principles emerged in the manufacturing industry in Japan shortly after WWII as a way of increasing efficiencies and managing costs. By the year 2000, Lean principles were commonplace in manufacturing industries such as Toyota and Boeing, but had not been a focus in health care. Soon thereafter, a handful of health care organizations began using Lean
principles to improve outcomes and the financial bottom line. The core concepts of Lean include: 1) specification of value from the standpoint of the end customer; 2) identification of all steps in a process, eliminating any steps which do not add value; 3) ordering of the steps in tight
sequence so the process flows smoothly; 4) customer-derived value from the subsequent upstream activity; and 5) constant continuation of the process for continued improvement (Kenney, 2011). Since 2000, the use of Lean principles in healthcare settings has increased, as reflected by the increasing number of publications on its effectiveness. Along with this
emergence in the literature has come the clarification of tools and techniques that are used to implement Lean principles.
Within the context of ED-to-inpatient handoffs, failure mode effect analysis (FMEA), a common Lean methodology tool, has been used to map workflow and help analyze case
deficits/failures. A 2015 article described the use of FMEA to evaluate ED-to-inpatient handoff communications and identify opportunities for improvement (Sorrentino, 2016). After a
in a consistent way. Once these gaps were identified, the team then worked with ED staff to streamline the process and ensure key components of the process were used (Sorrentino, 2016).
Although there is literature highlighting the value in using Lean methodologies to evaluate and improve processes within healthcare, very little has been published to evaluate staff perception of Lean. A 2012 quality improvement article assessed staff perception of Lean
methodology specifically related to nursing shift handoff (Klee, Latta, Davis-Kirsch, & Pecchia, 2012). This project was a continuous multi-year quality improvement handoff initiative. Findings from this study on nurses’ perceptions of the quality of shift handoff demonstrated a steady rise in satisfaction with the handoff process, reaching over 80% by study day 90 and remaining at approximately 85% satisfaction at six and 12 months.
In addition to being perceived as valuable by the care team, Lean methodology for quality improvement must also demonstrate sustainability. Klee et al. (2012) reported that using Lean principles to improve handoff demonstrated 100% compliance in safety check audits up to four years post-implementation. The time spent on handoff was also reduced 20% related to reporting, with 77% of staff completing handoff in less than 30-minutes by week 5
post-implementation. Although this article’s focus was on inpatient handoffs and not ED-to-inpatient care transitions, it provides evidence that not only can Lean techniques make the handoff process more efficient, but also that staff perceive value in Lean principles, as well as the immediate and long-term impact on process changes.
Sohal, 2016). Although LOS outcomes of the QI project were successful, demonstrating that the number of patients leaving the ED in eight hours or less increased from 40% to 70%, a main theme identified in the interviews was that staff felt the focus of Lean projects was too much on LOS and moving patients through the system faster, rather than truly improving quality of care. The concern expressed by staff was that Lean projects tended to focus solely on time efficiency, rather than improved patient care (Leggat et al., 2016). This study addressed this concern by evaluating all QI projects related to LOS, not just patient handoffs.
Chapter Summary
The exchange of information is a necessary aspect of patient care delivery in and across all healthcare settings, and the critical component of this exchange is patient handoffs (Hilligoss & Cohen, 2013). However, a comprehensive exchange of information does not always occur. Of the fifteen articles, three key themes emerged: 1) communication and its’ complexity, 2) the tools used to improve communications and handoffs, and 3) the use of QI methodologies for improving the handoff process. Although the literature reviewed and the themes that emerged provide evidence related to ED-to-inpatient handoff, the focus of studies and findings are inconsistent in the addressing the practice problem of interest. Some of the literature only examined shift to shift handoff, rather than ED-to-inpatient handoff (Farrara et al., 2017; Hilligoss et al., 2015; Starmer et al., 2013; Zou & Zhang, 2016). With the exception of five articles (Ferrara et al., 2017; Klee et al., 2015; Leggat et al., 2016; Sorrentino, 2016; Zou & Zhang, 2016), the majority of the literature focused solely on improving physician
metrics for this quality improvement project, this gap in the literature presented an opportunity to further examine this concept and provide data on improving ED-to-inpatient handoff and ED patient LOS.
CHAPTER 3: THEORETICAL FRAMEWORK Chapter Introduction
This project was guided by Dyadic Power Theory (DPT), a communication theory that can be used to predict and help explain the behaviors of two individuals who are attempting to exchange information. The key principle behind DPT is communication behaviors that can either facilitate or hinder the sharing of ideas and decisions (Rollins and Bahr, 1976). For the purposes of this project, DPT was used to identify solutions to the problems with communication handoffs from the ED-to-inpatient nursing care.
Dyadic Power Theory
A key premise behind DPT is the assumption of power distribution and stereotypes (Rollins and Bahr, 1976), specifically between a husband and wife dyad. When goals are aligned, power becomes equalized between the dyads and communication tends to be supportive,
allowing for a smooth exchange of ideas. However, when goals do not align, each individual attempts to gain power over the other, which is asserted through aggressive communication behaviors, resulting in misinformation or reduced information exchange.
Dunbar (2004) expanded DPT from the husband-wife communication deficits that arise from traditional power differentials, to include dyadic communication between individuals of different cultures and subcultures. In this updated interpretation, individuals of two different cultures or subcultures were postulated to create and perpetuate stereotypes based on how they communicate and the expectation one has toward the other.
between providers and hospital departments, and the problems that may arise during
communications. Within the fifteen articles reviewed, Hilligoss et al. (2015) used the DPT to create a negotiation framework focusing on handoffs (see Figure 2). Dyadic Power Theory and this framework underscores the complexity of sharing information and can lay the groundwork for creating norms and expectations around what is communicated about patient needs,
disciplinary perspectives, power distribution within and between clinicians, and relationships. Thus DPT provided a lens through which this project focused on improving communications between and among clinicians working on different patient care units.
Although dyadic refers to two points of communication, with one individual providing information and one individual receiving information, the process is not linear and occurs within the context of multiple, complex layers (Hilligoss et al., 2015). In general, the macro context provides the basis for communication within healthcare and may impact policies; the structural context recognizes communications at an organizational level, and recognizes hierarchal levels that may exist in the organization, the organizational culture and organizational routines and practices; and then the negotiation context considers communication at an individual level (see Figure 2). Typically at the negotiation context level, there is a power balance that develops between the two individuals. The perception of this power balance by both parties is critical to the effectiveness of communications. Individuals who perceive less power tend to demonstrate avoidance behaviors, leading to delayed communications and reduced knowledge sharing and those who perceive power dominance can be lead to an overbearing communication style (Hilligoss & Cohen, 2013).
This theory fits well when attempting to understand and improve ED-to-inpatient
understanding of workflow and agreed upon process, which results in a delay of care. While the majority of the handoff literature centered on the handoffs between physicians, nursing handoffs occur with every shift change and departmental transfer, resulting in the same communication complexities, including the relationship among parties and perceptions of power distribution. Nurses in the ED provide patient information during the handoff process to nurses in the inpatient units. During this process, there can be a perceived power inequity between nurses in these two sub-cultures, resulting in the development of mental stereotypes among individuals that inform communications (Hilligoss et al., 2015).
Often ED nurses are seen, and see themselves, as highly independent clinicians, with a wide breadth of knowledge and ability to care for patients with many different types of problems, at different levels of acuity, and often very quickly. Inpatient care nurses are often perceived, or stereotyped, by ED nurses as being more focused on caring, rather than complex patient
While helping to explain communication barriers, DPT in the context of the negotiation framework can also help facilitate improvement. As outlined in Figure 2, when both parties in the handoff process view their positions as equal and share a belief that ambiguities in the sharing of patient information can be mitigated, such as through handoff tools, then a more productive conversation can occur around the sharing of patient information (e.g. diagnosis, acuity, etc.), disposition, and care needs. By improving this communication process, as highlighted by Hilligoss et al. (2015), the outcomes could include improved quality/safety, resource use, costs, efficiencies, patient experience and staff satisfaction. Therefore, an improved process with standardized communication and behavioral expectations will improve the transfer of information and could also decrease the length of ED stay for patients with admission orders (Hilligoss et al. 2015).
The use of DPT does have some limitations. Besides not originating from a healthcare perspective, the theory is predicated on a consistent dyadic team (e.g., husband and wife). In healthcare, personnel change several times a day. The communication that occurs typically includes very little consistency among individuals. Although a standardized process may be developed to promote mutual understanding during communication, there was a risk that some individuals would not be aware of these agreements and/or not adhere to them. Since
Chapter Summary
Communication in healthcare is very complex, due to the nature of patients and the care they require. Within organizations, each individual clinician maintains his or her own agenda, perspective of the other party, and understanding of information that is important to
communicate (Dunbar, 2004). The use of DPT provides context for addressing the many layers of such complex communications (Rollins & Bahr, 1976). Dyadic Power Theory fosters
understanding of power distribution and stereotyping, to acknowledge and address issues related to the use of communication tools (Hilligoss et al., 2015). Such understanding and knowledge was necessary for this DNP project to avoid making assumptions that could further lead to non-beneficial, or even regressive, behaviors and results. The value of DPT as a theoretical
CHAPTER 4: METHODS Chapter Introduction
This DNP quality improvement project used Lean principles, specifically A3, to create standardized tools for ED to inpatient handoff communications and a consistent ED to inpatient process in order to improve patient flow and decrease ED LOS and admission wait time. The A3 tool (see Figure 3) provided a roadmap to systematically work through this improvement project.
Figure 3. A3 Tracking Form (Kenney, 2011)
Project Design
In this approach, a quality improvement (QI) team representing every inpatient,
Setting
The UNCMC, located in Chapel Hill, NC, is a Level I academic hospital with over 900 beds. UNCMC has received Magnet designation from the American Nurses Credentialing Center (ANCC), which acknowledges the benefits of hospitals that align nursing strategic goals with patient outcomes and empower nurses closest to patient care to drive improvements (ANCC, n.d.). There are eight clinical nursing service lines at UNCMC (Medicine, Oncology, Surgery, Heart and Vascular, Women’s, Children’s, Psychiatry, and Emergency Services) within which 38 inpatient nursing units and two observation units are distributed. The Emergency Department at UNCMC, Chapel Hill, is a 92-bed department that employs approximately 150 nurses and sees approximately 70,000 visits annually. About 30% of these visits get admitted to an inpatient unit, resulting in approximately 1650 admissions per month (UNC School of Medicine, 2016). There are also two short-stay observation units that are part of Emergency Services.
UNCMC also has a campus located in Hillsborough, NC, approximately ten miles away from the main campus. The Hillsborough campus, while located away from main campus, is considered part of UNCMC and was included in this project. The Hillsborough campus consists of a 10-bed ED and three inpatient nursing units that focus on the care of adult patients for the local Hillsborough community. In total, UNCMC employed approximately 2,500 inpatient and ED Registered Nurses during the project period (UNC Health Care, 2018).
Intervention
Psychiatry, and Hillsborough campus inpatient. Each service area, including Hillsborough, was represented by a staff nurse, with two representing the Emergency Department. In addition, there was a representative from the House Administrative Supervisors and flex float staff.
Table 1. Steps in the A3 Methodology (Kenney, 2011) Step 1. Clarify the problem
Develop a problem statement - state how the problem impacts the organization Baseline data supporting the problem statement
Define the boarders of the problem (i.e. in and out of scope) Step 2. Break down the problem
Using words, visuals, etc., map out current process and identify waste Using words, visuals, etc., create an ideal state
Step 3. Primary outcome targets
Based on baseline data, team develops improvement goals
Goal should be specific, measurable, attainable, relevant, and timely Step 4. Root cause analysis
Use root cause analysis (RCA) tools, such as fishbone diagram, 5-Why technique, & Pareto charts to drill down to foundational causes of the problem, as outlined in the problem statement
Step 5. Countermeasures
Based on identified root causes, the development of improvements to target reach root cause (i.e. process steps).
Step 6. Implementation
A list of discrete action items that will lead to improvements Should include a timeline, ownership, and expected outcomes Each action item will have a concurrent measuring process Step 7. Monitor results and processes
Compliance with each process step will be monitored on a routine basis Outcome metric(s) will be monitored on a routine and regular basis Step 8. Sustainability and spread
Team will identify a sustainability plan
Depending upon applicability, action items can be spread across organization/system
Table 2. Project Charter Problem Statement
The UNCMC average ED LOS for admitted patients is approximately 500 minutes, compared with the national average of 336 minutes. The average admit wait time for admission is approximately 150 minutes, compared to the national average of 137 minutes.
Importance Statement
This lack of a standard process introduces delays in care and inefficient use of ED and inpatient beds.
Scope
through brainstorming, the team identified key gaps that were preventing them from reaching or being at the target state. Using the 5-Why technique (Kenny, 2011), the team identified the root causes of identified barriers. With the 5-Why technique, for each identified barrier, the team first asked, “Why does this barrier exist?” Each response was followed by another “why” question until an identified root cause was agreed-upon (Kenny, 2011). In step five, solutions were discussed that targeted each gap, based on the response to the first “why” question in the root-cause analysis process. For the solution approach, for every identified root root-cause, the team asked the question “if we”, followed by “then we”, to help guide the development of countermeasures (i.e. interventions).
In step six, the QI team took these identified countermeasures/interventions and
developed tools to target the identified solution and to implement appropriate tools across service lines. From this approach, four tools were created to help reach the target state. The QI team was divided into two groups. One group developed two of the four tools and the other group
developed the other two tools. After the initial development of each tool, the QI came back together, reviewed each tool, provided group input and came to agreement on the final products. These tools, discussed more thoroughly in Chapter 5, included: 1) ED to Inpatient Handoff Guideline (see Appendix B); 2) Situation, Background, Assessment, Recommendations (SBAR) Communication Tool (see Appendix C); 3) Inpatient Charge Nurse Shadow Guideline (see Appendix D); and 4) ED Charge Nurse Shadow Guideline (see Appendix E). Once these tools were developed, they were presented to UNCMC nursing leadership, which included all Nursing Directors, the Chief Nurse Officer, and the Associate Chief Nurse Officer. All tools were
of the project, tools and next steps. All Nurse Managers supported the project and presented tools, and worked together to agree on a deployment plan (see Table 3). Each service line representative explored the implementation of the tools in their respective areas. All tools were used ubiquitously across the Division of Nursing, except for the shadowing guidelines, which were only implemented in the appropriate area. Specifically, inpatient nursing implemented the inpatient charge nurse shadowing guidelines and the ED implemented the ED charge nurse shadowing guidelines. Each unit also identified a unit-champion to assist with deployment. Education on all tools began in September 1st 2018, and all tools were implemented on October 1st, 2018. Education occurred via Weekly Updates, staff meetings, and unit education boards (see Figure 4).
Table 3. Deployment Plan
Each unit identified a champion to help deploy
Each representative from the QI team from each service was available as a resource Unit champion rolled-out tool and provided education at the unit level
Units provided education to tools in September via huddles, staff meetings & Weekly Updates Each unit displayed QI project information and tools on a bulletin board in the unit
Figure 4. Unit Education Board
In step seven, data were distributed across the Division of Nursing monthly on ED LOS for admitted patients, ED admission wait time, average time from attempt of first report to patient arrival and length of time for verbal report. In addition, data on transfer time from first report attempt to patient admission to unit and length of time for report was distributed
throughout the Division of Nursing via email, monthly Nurse Manager meetings, and staff meetings. In step eight, sustainability, the PL, QI team, unit champions, and unit nurse managers monitored data distributed, highlighted successful stories related to the use of tools and
units and the ED was also implemented in October 2018. Although this intervention is not expected to have immediate impact, it is a key element to ensuring sustainability. Additionally, continuous feedback on the implementation process was solicited from Nursing Directors, Nurse Managers, the QI team, and unit-champions.
Population/Sample
As a Level I academic trauma hospital, patients of all ages and acuity levels access the ED. This quality improvement project focused on standardizing patient reporting and monitoring ED LOS for all patients admitted to an inpatient unit, which was approximately 1,650 patients per month at the start of this project. This QI project involved all UNCMC ED and inpatient nursing units and staff.
Data Collection
The primary outcome metric monitored in this project was ED LOS for all patients admitted to inpatient units, measured as the average time in minutes for total time an admitted patient was in the ED. The secondary outcome metric was the admission wait time, defined as the time in minutes from decision to admit a patient to an inpatient unit to the patient arriving to an inpatient unit. These data were collected through the electronic healthcare record data
Ethics and Human Subjects
Prior to implementation, this quality improvement project was approved the UNCMC Nursing Research Council (May 23, 2018) (see Appendix F). Subsequently, the project was submitted to and approved by the University of North Carolina at Chapel Hill Institutional Review Board (IRB) on June 1, 2018 (see Appendix G). Because data collection was solely based on throughput and handoff time with no identifying patient information used, the project was approved as “exempt” by the IRB.
Data Analysis
The primary outcome metric for this project was ED length of stay (LOS) for admitted patients and the secondary outcome metric was wait time for admission, both measured as time in minutes. In order to account for seasonality, which affects ED volume and acuity, the months for comparison included September 2017, October 2017, November 2017, September 2018, October 2018, and November 2018. In order to evaluate data impacted by interventions within the scope of this project, LOS data was limited to patients in the ED less than 24 hours and admission wait time data was limited to patients in the ED less than 12 hours. An analysis of variance (ANOVA) was used to examine differences in outcomes at these six data points, with the significance value set at 0.05. With approximately 1650 inpatient admissions per month, this provides 80% power at 5% significance and an effect size of 0.002 (G. Knafl, personal
report took was collected from the same manual data collection process and convenience sample. Both of these metrics (transfer time and report length) were analyzed using ANOVA at 5% significance. These data were collected manually in September 2018, the month prior to
implementation of tools, October 2018, the month of implementation, and November 2018, the second month of implementation.
An important part of the A3 process is an assessment of what went well and what could be improved in the quality improvement process (Kenney, 2011). In that vein, members of the quality improvement team were sent an anonymous survey at the end of the project via
SurveyMonkey® (October 2018) asking four questions: 1) What went well or helped?, 2) What didn’t go well or can be improved?, 3) What will we do differently now?, and 4) How will we share lessons learned with others? The responses were reviewed for themes within and across the four questions.
Chapter Summary
CHAPTER 5: RESULTS Chapter Introduction
The purpose of this QI project was to collaborate with hospital stakeholders from multiple nursing service lines to develop and implement a process for improving the handoff process between nurses when admitting and transferring patients from the ED to inpatient units. The project was conducted using Lean methods, namely A3, to: clarify the problem, analyze the problem, identify target outcomes, perform a root cause analysis, identify countermeasures and interventions, implement improvement actions; monitor results, and sustain and spread the findings. This chapter presents the findings of the project that were derived by: mapping of the current process and the target state, identifying system barriers, describing root causes,
examining key outcomes of the process, implementing unit-specific interventions, reporting of quantitative results related to interventions, and obtaining feedback about the project from the quality improvement team. The primary outcomes examined in this project were ED length of stay for admitted patients and wait time for admission once an admission order was placed (i.e., admit wait time). In addition, data on length of time from first admission report attempt to patient arrival on the unit and length of time verbal handoff report took were also examined.
Baseline Data
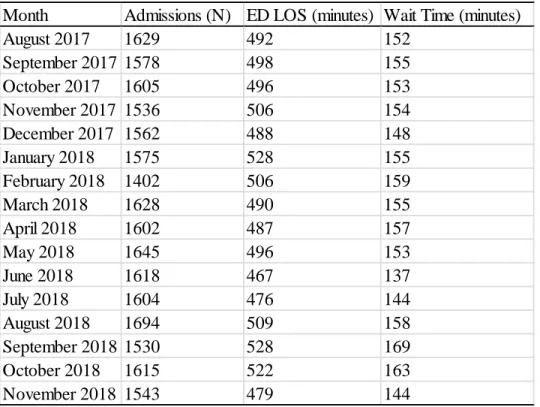
average from 467 to 528 minutes per month. The average admission wait time (i.e., the time interval between entry of an admission order by an inpatient medical team for an ED patient and the patient’s departure from the ED) was 154 minutes, with monthly averages ranging from 137 to 169 minutes (see Table 4).
Table 4. ED Admissions, Patient Lengths of Stay (LOS), and Wait Times
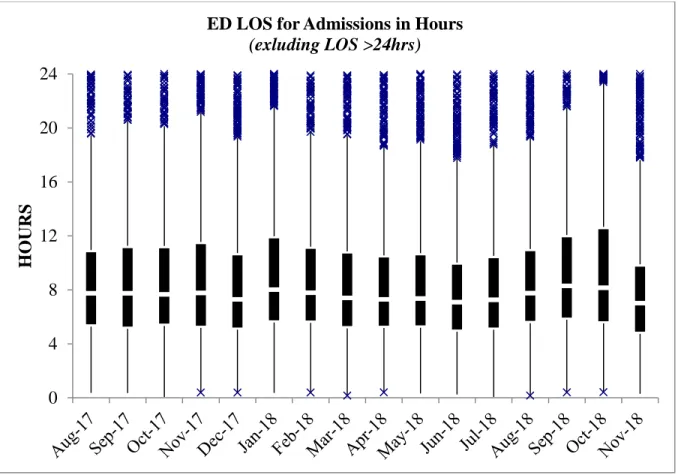
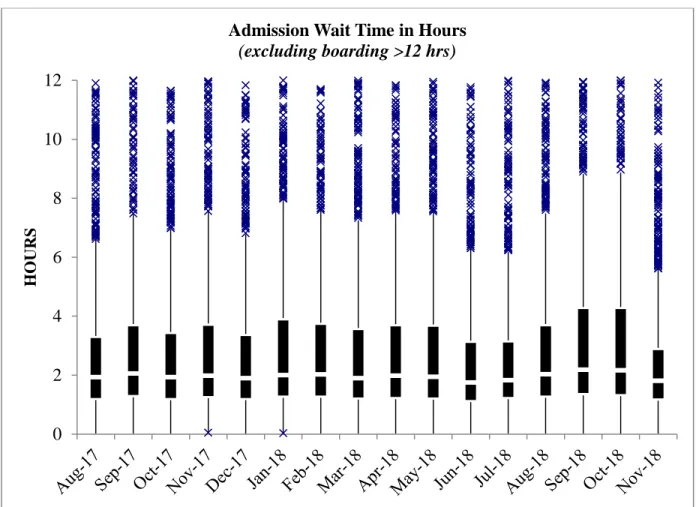
A box and whisker plot was used to assess variation of these baseline data. The box and whisker plot graphs data into four quartiles, with extreme values outside upper and lower quartile ranges represented by an “x” on the graph. Both ED to inpatient admission data and wait time for admission data had extreme outliers, sometimes extending to weeks, as opposed to hours. These extremes in variation are related to a multitude of factors outside of nursing’s control, such as medical team availability and bed availability. Since this QI project was specific to the ED to inpatient process between nursing personnel, it was determined that ED LOS for admitted patients would be limited to 24 hours (see Figure 5) and admission wait time to 12 hours (see
Month Admissions (N) ED LOS (minutes) Wait Time (minutes)
August 2017 1629 492 152
September 2017 1578 498 155
October 2017 1605 496 153
November 2017 1536 506 154
December 2017 1562 488 148
January 2018 1575 528 155
February 2018 1402 506 159
March 2018 1628 490 155
April 2018 1602 487 157
May 2018 1645 496 153
June 2018 1618 467 137
July 2018 1604 476 144
August 2018 1694 509 158
September 2018 1530 528 169
October 2018 1615 522 163
Figure 6), to allow visualization of data and data variation more relevant to the scope of this project. These time limits were chosen to allow for ED LOS and admission wait times that could be impacted by this project, as ED LOS and admission wait time are influenced by multiple variables outside of the scope of RN workflow. These graphs represent the mean time for ED LOS for admitted patients (Figure 5) and mean wait time for admission (Figure 6), the lowest two and highest two quartile ranges, with extreme values outside of quartile ranges represented by “x”.
Figure 5. ED LOS for Admissions Box and Whisker Plot*
*Note: “x” indicates values outside of quartile ranges 0
4 8 12 16 20 24
H
O
URS
Figure 6. Admission Wait Time Box and Whisker Plot*
*Note: “x” indicates values outside of quartile ranges
A3 Methodology Results
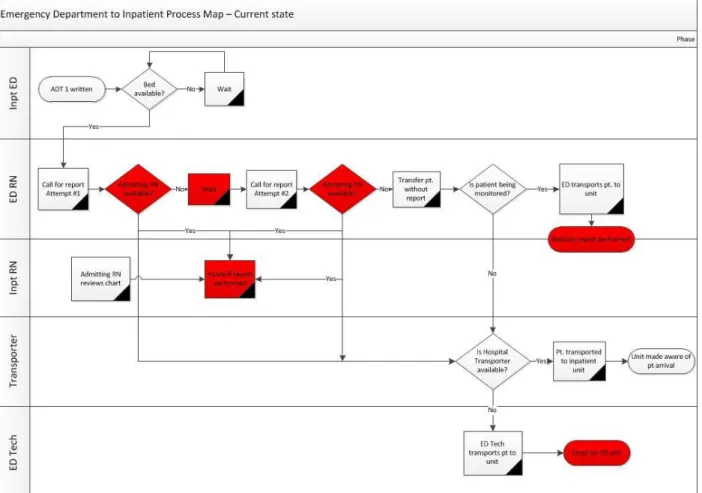
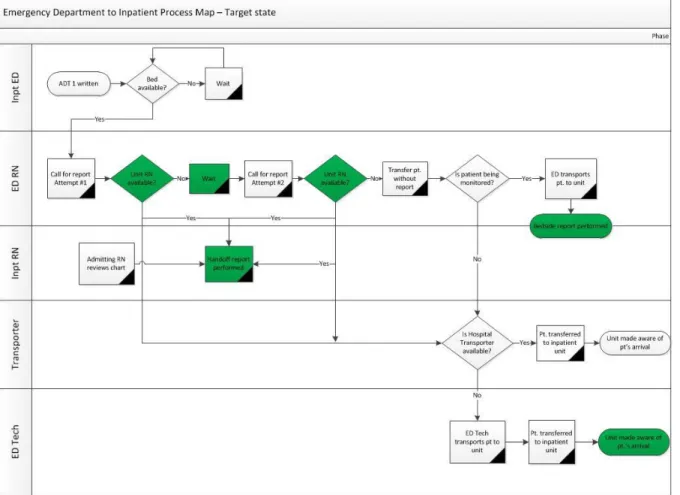
This project used A3 methodology (see Figure 3 and Table 1) to examine ED to inpatient handoffs between nurses. The quality improvement team first mapped out the current state of patient flow from ED to inpatient admission (see Figure 7), and then mapped a target, or desired, state of ED to inpatient admission flow (see Figure 8). In Figure 7, the decision points and steps in the process highlighted in red indicate gaps in consistent practices from nurse-to-nurse and department-to-department. In Figure 8, the green decision points and steps in the process indicate implementation of standard work and consistent practice.
0 2 4 6 8 10 12
H
O
U
R
S
Figure 7. Current State Process Map*
Figure 8. Target State Process Map*
*Note: Green indicates standard work
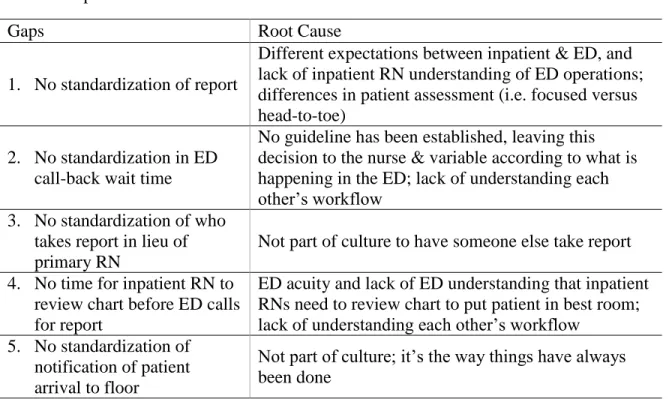
inpatient unit (see Table 5). Each gap was assessed using the “5-why” technique to identify the root cause of each gap (Kenney, 2011).
Table 5. Gaps and Root Causes
Gaps Root Cause
1. No standardization of report
Different expectations between inpatient & ED, and lack of inpatient RN understanding of ED operations; differences in patient assessment (i.e. focused versus head-to-toe)
2. No standardization in ED call-back wait time
No guideline has been established, leaving this decision to the nurse & variable according to what is happening in the ED; lack of understanding each other’s workflow
3. No standardization of who takes report in lieu of primary RN
Not part of culture to have someone else take report 4. No time for inpatient RN to
review chart before ED calls for report
ED acuity and lack of ED understanding that inpatient RNs need to review chart to put patient in best room; lack of understanding each other’s workflow
5. No standardization of notification of patient arrival to floor
Not part of culture; it’s the way things have always been done
Table 6. Solution Approach Gap
Number Solution (if we) Outcome (then we)
1 Have new CN orientation to include ED & inpatient shadowing
Create more mutual understanding of work environment & flow 1 Provide SBAR education for both
inpatient & ED nurses, to include key points of isolation & PNA
Will have inpatient & ED nurses communication in a more uniform process 2 Standardize call-back time to 10 min Will have a consistent
call-back expectation 3 Create an expectation that if the primary
RN or CN cannot take report on the 1st call, then any available RN will take report on the 2nd call
Will have a consistent expectation of who will take report.
4 Have patients pre-assigned to a unit Then the unit will have time to review the chart for room-specific needs (i.e., isolation) before the ED calls for report 5 Have ED nursing assistants notify an RN
once they arrive on the unit with a patient
The unit and RN will know when a patient has arrived in a bed
Table 7. Developed Tools for Each Gap
Developed Tools Addressed Gap(s)
ED to Inpatient Handoff Guideline 2, 3, 4, 5
SBAR Communication Tool 1
ED Charge Nurse Shadowing Guideline 1, 2, 3, 4, 5 Inpatient Charge Nurse Shadowing Guideline 1, 2, 3, 5
create an expectation that if the primary inpatient RN or charge nurse (CN) on the inpatient unit is unavailable to take report on the first call, then any available inpatient RN will take report on the second call. It also establishes an expectation that the ED nursing assistant (NA) who may transport the patient to the unit will notify an inpatient RN that the patient had arrived, a practice not previously performed (see Table 5, Table 6, and Table 7).
The Situation, Background, Assessment, and Recommendations Communication Tool was developed (see Appendix C) was identified in the review of literature as a mechanism to facilitate a shared understanding of patient needs and standardize key discussion points (Brannen et al., 2009). A unique component with this tool was the creation of must-discuss and nice-to-know discussion points. As indicated on the tool, bold-font items are items that must be discussed (i.e. chief complaint, isolation needs, etc.), and the lower-font items need to be discussed only if applicable to a particular patient - diet, wounds, etc. (see Table 5, Table 6 and Table 7).
important tools, their effectiveness was not measurable for the purposes of this project because of the project’s timeline. However, the guidelines were developed and designed to improve ED RN and inpatient RN relations for the long-term, and will be available for use in the future.
The gap of the inpatient RN lacking sufficient time to review the patient’s chart for appropriateness before the ED calls to provide a patient report was addressed through the ED to Inpatient Handoff Guideline and through the development a secondary, but related, project. The secondary project created a process for the Patient Logistics Center (PLC), a department formed in 2017 that began facilitating internal patient movement in August 2018, to assign an ED patient to an inpatient nursing unit. Once assigned, the nursing unit would assign the patient a specific room and nurse, thus providing the unit time to review the patient’s chart before the patient is assigned to a bed. This secondary process change allows the inpatient unit to review the patient’s chart for unit appropriateness, assign the patient to a specific bed, and notify the ED nurse to call report for the inpatient admission.
Tool Implementation Results
Table 8. ED Length of Stay ANOVA for Inpatient Admission
Month Comparison Month Significance
September 2017 October 2017 0.193 November 2017 0.977 September 2018 0.051
October 2018 0.281
November 2018 0.051
October 2017 November 2017 0.924 September 2018 0.051
October 2018 0.051
November 2018 0.055
November 2017 September 20018 0.281
October 2018 0.635
November 2018 0.053
September 2018 October 2018 0.931 November 2018 0.054
Table 9. ED Wait Time for Admission ANOVA
Month Comparison Month Significance
September 2017 October 2017 0.983 November 2017 0.853 September 2018 0.123 October 2018 0.461 November 2018 0.052
October 2017 November 2017 0.542
September 2018 0.051 October 2018 0.153 November 2018 0.051
November 2017 September 20018 0.113 October 2018 0.339 November 2018 0.051
September 2018 October 2018 0.559 November 2018 0.053
October 2018 November 2018 0.051
admissions were documented before the implementation of the QI tools. Of these 106
admissions, 97 had complete data on transfer time from first report attempt to patient arrival on the inpatient unit, and all 106 admissions had complete data on length of time for verbal report. A total of 76 admissions were documented after the implementation of tools in October 2018. Of these 76 admissions, 71 had complete data on transfer time from first report attempt to patient arrival. All 76 contained data on length of time for verbal report. A total of 35 admissions were documented after implementation of tools in November 2018. Of these 35 admissions all had completed data on transfer time from first report attempt to patient arrival and length of time for verbal report (see Tables 10 and 11).
Table 10. Transfer Time from First Report Attempt to Patient Arrival Admissions Time (minutes) SD
September 2018 97 30.5 18.2
October 2018 71 24.2 8.8
November 2018 35 21.7 7.4
Table 11. Length of Verbal Report and Attempts
Verbal report Time (min) SD Attempts > 1 Attempts > 2
September 2018 106 3.8 1.6 10 0
October 2018 76 2.8 1.2 3 0
November 2018 35 3.1 1.3 2 0
The average time from first report attempt to patient arrival after implementation of the tools in November 2018 (N=35) was 21.7 minutes (SD=7.4). An ANOVA comparing these metrics was statistically significant at p=0.000 for the months following implementation of tools (see Table 10 and 12). This suggests that the implemented tools, specifically the ED to Inpatient Handoff Guidelines and SBAR Communication Tool, provided the standard work necessary to decrease the time used for patient transfers from the ED to inpatient units.
Table 12. First Report Attempt to Patient Arrival ANOVA Month Comparison Month Significance September 2018 October 2018 0.000
November 2018 0.000 October 2018 November 2018 0.664
The average length of time for verbal report before implementation of tools (N=106) was 3.8 minutes (SD=1.6). The average length of time for verbal report after implementation of tools in October 2018 (N=76) was 2.8 minutes (SD=1.2). The average length of time for verbal report after implementation of tools in November 2018 (N=35) was 3.1 minutes (SD=1.3). An ANOVA comparing these metrics was statistically significant at p<0.05 for the months following
Table 13. Length of Verbal Report ANOVA
Month Comparison Month Significance September 2018 October 2018 0.000
November 2018 0.048 October 2018 November 2018 0.371
In addition, the number of report attempts decreased between pre and post
implementation of tools. Of the data collected pre implementation, there were 10 attempts (out of 106 admissions), or approximately 9.4% of the time, when the ED RN had to call an inpatient nursing unit more than once to provide patient report. Of the data collected post implementation of tools, the ED needed to call inpatient nursing units more than once for report only three times out of 76 admissions in October 2018, or approximately 3.9% of the time and twice in November 2018, or approximately 5.7% (see Table 11). This finding suggests that the implemented tools, specifically the ED to Inpatient Handoff Guideline, provided the standard work necessary to decrease the need for multiple report attempts.
Project Insights
process to help ensure that the tools are implemented consistently. The main theme for question #3 was excitement/enthusiasm about having a standard work flow for ED to inpatient nurse handoffs and patient admissions. Lastly, for question #4, the major themes focused on the dialogue that this project created at the unit level about differences in ED and inpatient
workflows, and the perspective that this project was a mechanism for helping both the ED and inpatient unit staff appreciate each other’s work environments. Overall, the responses about the project were very positive as a whole, highlighting the importance of the problem addressed, and the excitement that can be generated around the execution of the project that creates a standard process. There were also comments suggesting improvements, such as having more ED
representation on the QI team, and continued focus of the tools beyond November 2018. Chapter Summary
The results of this project are threefold. First, the A3 methodology led the team to create specific tools to help improve the ED to inpatient handoff process. For this QI project, these tools included an ED to Inpatient Guideline, an SBAR Communication Report Tool, and shadowing guidelines for both ED and inpatient RNs. Second, quantitative data for this project did not demonstrate significant improvements in ED LOS or ED wait time. However, the time from first report attempt to patient arrival on the unit decreased from 30.5 minutes to 24.2 minutes and 21.7 minutes (p=0.000). In addition, the time for giving/receiving report for ED to inpatient
CHAPTER 6: DISCUSSION
The purpose of this quality improvement project was to implement a standardized, evidence-based ED-to-inpatient RN handoff process to improve flow and decrease ED patients’ lengths of stay and wait time prior to inpatient admission. As stated in Chapter 4, a quality improvement team used A3 methodology to develop tools to improve ED to inpatient admissions. Four tools were developed: 1) ED to Inpatient Handoff Guideline, 2) Situation, Background, Assessment, Recommendation (SBAR) Communication Tool, 3) ED Charge Nurse Shadowing Guideline, and 4) Inpatient Charge Nurse Shadowing Guideline. As outlined in Chapter 5, ANOVA was used for ED LOS and admission wait time for September, October, and November the year prior to implementation, one month prior to implementation, and two months following implementation of tools. In addition, ANOVA was used to compare patient transfer time and length of time to give/receive report pre versus post implementation of tools. Members of the QI team were surveyed on strengths and weaknesses of the project and its implementation. This chapter provides an interpretation of the findings and discusses implications for the future, both for nursing as a profession and UNCMC specifically.
Discussion of Findings
Due to the nature of patients and the care they require, communication in healthcare is very complex. Within organizations, each individual clinician maintains his or her own agenda, perspective of the other party, and understanding of information that is important to
concerns around communication when there is a lack of shared understanding, which can result in inefficient communication and frustration. Hilligoss et al. (2015) expanded this concept into the world of healthcare. As outlined in Figure 2, when ambiguities in the handoff processes are mitigated, then a more productive conversation can occur around the sharing of patient
information (e.g. diagnosis, acuity, etc.), disposition, and care needs. By improving this
communication process, there could be improved quality/safety, resource use, cost, efficiencies, patient experience and staff satisfaction.
This framework fits well when attempting to understand and improve ED-to-inpatient communication. With this DNP project, there was a concern that the ED to inpatient handoff process lacked a shared understanding of workflow and agreed upon processes, which was resulting in unnecessarily protracted ED LOS and admission wait time. Therefore, an improved process, with standardized behavioral expectations and communication may improve the transfer of information and could also potentially decrease the length of ED stay and admission wait time for patients with admission orders (Hilligoss et al., 2015).
To achieve a standardized process, the literature supports use of Lean principles (Kenney, 2011; Klee et al., 2012; Leggat et al., 2016; Sorrentino, 2016). Specifically, A3 Lean
methodology was used as a roadmap to systematically guide this quality improvement work. The advantage of A3 methodology is that it provides a step-by-step process to identify the problem, the metrics, the current and target states, process gaps and root causes, solutions to address gaps, implementation action plans for solutions, monitor the impact of the action plan, and standardize the process for sustainability (Kenney, 2011).
and 4) Inpatient Charge Nurse Shadowing Guideline. These tools were implemented throughout the project site in October 2018. The primary purpose of the ED to Inpatient Guideline (see Appendix B) and the SBAR Communication tool (see Appendix C) was to standardize the patient transfer and ED RN to inpatient RN communication process (see Table 6). By making this process more efficient, the intent was that the ED LOS for patients being admitted and wait time for admission would decrease.
Analysis of variances (ANOVA) was used to compare ED LOS and admission wait time among six months: September 2017, October 2017, and November 2017 (one year prior to project implementation), September 2018 (one month prior to project implementation), and October and November 2018 (the months of project implementation). This approach was used to account for patient acuity and volume seasonality in the Emergency Department. Neither ED LOS nor wait time for admission decreased significantly (p>0.05) (see Table 4, Table 8 and Table 9). These results indicate that the ED to Inpatient Handoff Guideline and SBAR
Communication Tool did not contribute to decreased time the patient spent in the ED for patients being admitted.