Capacity Planning
• Capacity Planning Process, page 1
• Capacity Planning–Getting Started, page 2
• Collected Data Categorization, page 3
• Capacity Utilization, page 6
Capacity Planning Process
Figure 1: Capacity Planning ProcessYou should make changes to an existing Unified ICM/Unified CCE deployment in small steps. Then analyze the impact of each step with a well-established, repeatable process. This process includes the following phases (steps):
1 Sample Phase: Initiate data sampling at the same time for the same interval for each change made.
2 Collect and Categorize Phase: Collect the samples and distribute to appropriate buckets.
3 Analysis Phase: Check application resource boundaries–has any component exceeded utilization limits? Determine best fit for new deployment requirements. Estimate solution level capacity utilization for new requirements.
5 Do it all over again. Re-execute the process exactly the same it was done before you ensure that an equal comparison is made..
Capacity Planning
–
Getting Started
The first thing you must do to get started with a capacity management plan is to establish a baseline–answer the question:“what is my capacity utilization today?”To answer this question, you must first determine the busiest, recurring period within a reasonable timeframe. For most business call centers, there is usually a 1-hour period of each day that is typically the busiest. Moreover, there can be busier days of the week (for example Monday vs. Wednesday); busier days of the month (last business day of the month) or busier weeks of the year (for example, the first week in January for insurance companies, or for the IRS, the first two weeks of April). These traditionally busy hours, days, or weeks represent the most taxing period on the deployment; these are the periods during which a capacity utilization calculation is best because you always want to ensure that your deployment is capable of handling the worst.
The steps to getting started are:
1 Set up basic sampling (daily)
Sample the performance counter values: CPU, Memory, Disk, Network, Call and Agent Traffic
2 Determine the busy period
Identify the recurring busy period–worst case scenario–by: Per Component
Solution Wide
3 Establish a baseline of utilization for the target period Determine hardware capacity utilization
Identify components with high capacity utilization
4 Craft a recurring collection plan
Devise a plan that is repeatable–preferably automated–that can be done on a weekly basis whereby samples are obtained during the busiest hour of the week.
After you establish a baseline and identify a busy hour, daily sampling is no longer necessary; you must sample only during the busy hour on a weekly basis. However, if regular reporting shows that the busy hour may have changed, then you must complete daily sampling again so that you can identify the new busy hour. After you identify the new busy hour, weekly sampling during the busy hour can resume.
Finding the Busy Hour
To find the busy hour, you must initiate continuous data sampling to cover a full week, 24 hours a day. The data sampled are the performance counters for CPU, Memory, Disk, and Network as listed inCapacity Utilization, on page 6. You can set up performance counter values to be written to a disk file in comma separated values (.CSV) format, which is easily imported into a Microsoft Excel workbook. Collect the data sample files, import them into Excel and graph them to see the busy hour. You can import the data set into a graph in a matter of minutes and easily determine the busy hour.
Capacity Planning Capacity Planning – Getting Started
For example:
Figure 2: Graph of Samples to Find Busy Hour
Collected Data Categorization
Collected data should be categorized by critical resource for each change event or need. The list below shows the instigators for sampling, collecting, categorizing, analyzing data to determine capacity utilization.
•Current Deployment Design
•Configuration Info
•Traffic Load
•Migration Requirements
•Platform Performance
Current Deployment Design
You must establish and maintain a deployment baseline; this baseline is used to do before/after comparisons. You must establish a new baseline after you make a change in the deployment design.
•Establish an initial baseline–today–with the current deployment design
•Re-establish a baseline after deployment changes occur, such as:
◦Add/delete a Peripheral Gateway
◦Add/delete an Administration & Data Server
◦Clustering over WAN–any change to WAN characteristics Capacity Planning
You can use week-to-week comparisons to identify changes that occurred that you were not aware of. For example, someone adds additional skill groups without prior approval or notification and suddenly utilization jumps, inexplicably, by 5%. Such a change is noteworthy enough to ask the following questions: What changed? When? Why?
When analyzing the current solution, you must maintain deployment information and track changes:
•Topology diagrams (network)
•Peripheral counts
◦Cisco Unified Communications Manager Clusters
◦Unified IP-IVR or Unified CVP peripherals (and port quantity)
•Network devices
•Third-party add ons
Configuration Information
Changes to Unified ICM/Unified CCE configuration can impact computing resources and thus impact the utilization for a hardware platform, an application component and in some cases, the entire solution. Configuration change examples:
•Adding skill groups
•Changing number of skill groups per agent
•Adding ECC data
•Increasing calls offered (per peripheral) per half hour
Using the baseline that you established, you can characterize the impact of the configuration change by comparing utilization before the change to utilization after change.
By making changes methodically in small steps, you can characterize each small change (for example, adding one skill group at a time) and note the impact. In the future, if a change request comes to add 10 skills group, you can make an educated guess at the overall utilization impact by extrapolating: adding one skill group caused a 0.5% increase in PG CPU utilization at the half hour, so adding 10 skill groups can result in a 5% increase in PG CPU utilization at the half hour. Can a 5% increase in PG CPU utilization be accommodated? Configuration changes often have an impact on performance. Ensure that you track ongoing changes and analyze the impact. The following configuration changes are likely to impact utilization:
•Overall Database Size
•Number of Skill Groups per Agent
•Number of Skill Groups per Peripheral
•Number of Call Types
•Number of Dialed Numbers
•Number of Agents per Peripheral
•Total Agent Count
Capacity Planning Configuration Information
•Amount of Attached Call Data
Other configuration factors that can affect utilization:
•Agent level reporting
•Persistent ECC, per call type, per peripheral
•Percentage of call types per peripheral
•Average skill group per agents and total skills per system
•Number of Administration & Data Servers (real time feeds)
•Number of concurrent reporting users
Traffic Load
Examples of impacting traffic load changes:
•Inbound call rate
For example, your marketing department is about to introduce a new discount program for an existing service:“Sign up before July 31 for the new discounted rate!”You have been monitoring inbound call rate (Unified ICM/Unified CCE Router: Calls/sec counter) and see a relatively consistent 4 calls/sec inbound rate during the Monday morning busy hour as compared to an average of 3 calls/sec during the rest of the day. You predict that the new marketing program will increase the inbound call rate to 6 calls per second during the busy hour. You calculated that utilization is at 50% during the busy hour while averaging at 40% during the rest of the day. You determine that the increase in call rate will push utilization as high as 75%, which the system can tolerate.
•Network utilization
The Unified ICM/Unified CCE system is a collection of distributed, dependent software components that communicate by network messaging. Components communicate via a public network connection
–some components also communicate via a private, dedicated network connection. On the public network, the Unified ICM/Unified CCE may be competing for network bandwidth. Any increase in public network utilization may slow the ability of a Unified ICM/Unified CCE component to transmit data on the network, causing output queues to grow more than normal. This can impact memory utilization on the server and timing of real-time operations.
Any change in traffic or load has a corresponding impact on utilization and capacity. Additional examples of impacting traffic include:
•Overall Call Load—BHCA and Calls per Second
•Persistent ECC, per call type, per peripheral
•Percentage of call types per peripheral
•Number of concurrent agents logged in (including monitored IVR ports)
•Number of concurrent reporting users Capacity Planning
Migration Requirements
When analyzing future growth, you must consider all possible migrations:
•Business requirements for migration: Adding a new line of business, additional skill groups
•Expected growth: Recent history has shown a steady 10% increase in agent population
•Resource consolidations or separations:
◦Agents
◦Call Types
◦Reporting
◦Queuing
◦Merging two peripherals into one
•Other requirements:
◦Office moving to new location
◦Network infrastructure change: increased/decrease network latency
◦Splitting PG sides over WAN
◦Changing data retention parameters on the HDS
Platform Performance
Any hardware or software changes in the platform itself can have a corresponding impact on utilization. A“technology refresh”upgrade (upgrading both hardware and software) of the Unified ICM/Unified CCE has a significant effect on capacity utilization. Advances in hardware capabilities and a continued focus on streamlining bottlenecks in the software have yielded significant increases in server and component capacities. In some cases, hardware upgrades (without a software upgrade) may be necessary to accommodate growth in the Unified ICM/Unified CCE deployment.
A“common ground”upgrade (upgrading software while retaining existing hardware) of Unified ICM/Unified CCE may have a differing effect on capacity utilization depending on the changes made to the software from one release to the next. In some components, utilization may increase slightly because new functionality was added to the component, which has slightly decreased its execution performance. However, another component in which performance improvements was introduced, utilization may decrease from one release to the next. You must plan to re-establish a capacity utilization baseline after any upgrade.
Capacity Utilization
Platform resource utilization data is at the foundation of capacity analysis. This data is sampled values of performance counters such as: CPU, Memory, Disk, and Network. The data set is from the busy hour as determined by the steps described above.
Capacity Planning Migration Requirements
To eliminate short-duration spikes that are statistical outliers, use a sample rate of one sample every 15 seconds of each of the listed counters. Of the sample set, base the calculation on the 95th percentile sample. The 95th percentile is the smallest number that is greater than 95% of the numbers in a given set.
Counters are divided into two categories:
• “Measurement”value:
A measurement value is only valid if the indicator values are“good.”If the indicator values are within acceptable levels, then the measurement value is used in the forthcoming calculation to determine utilization.
• “Indicator”value:
An indicator value is a Boolean indication of“good”or“bad” –exceeding the maximum threshold is, of course,“bad.”If the indicator value is“bad,”assume that capacity utilization was exceeded. If so, you must take steps to return the system to < 100% utilization which may require hardware upgrade. Capacity utilization is considered to be >= 100% if published sizing limits are exceeded for any given component. See theCisco Unified Contact Center Enterprise Design Guideathttp://www.cisco.com/en/US/ products/sw/custcosw/ps1844/products_implementation_design_guides_list.htmlfor a quick reference on configuration limits and scalability constraints. For more information seeUnified Communications in a Virtualized Environmentand theCompatibility Matrix for Unified CCEpages on the DocWiki, and theUnified Communications Sizing Toolfor information on system constraints. For example: if the server on which a Unified CC PG is installed has a published capacity of 1,000 agents but there are 1,075 active agents at a particular time, the server is considered to be greater than 100% utilization regardless of what might be calculated using the methods described herein. The reason for this is that although the server/application seems to be performing at acceptable levels, any legitimate change in usage patterns could drive utilization beyond 100% and cause a system outage because the published capacity was exceeded. Published capacities seek to take into account differences between deployments and/or changes in usage patterns without driving the server into the red zones of performance thresholds. As such, all deployments must remain within these published capacities to enjoy continued Cisco support.
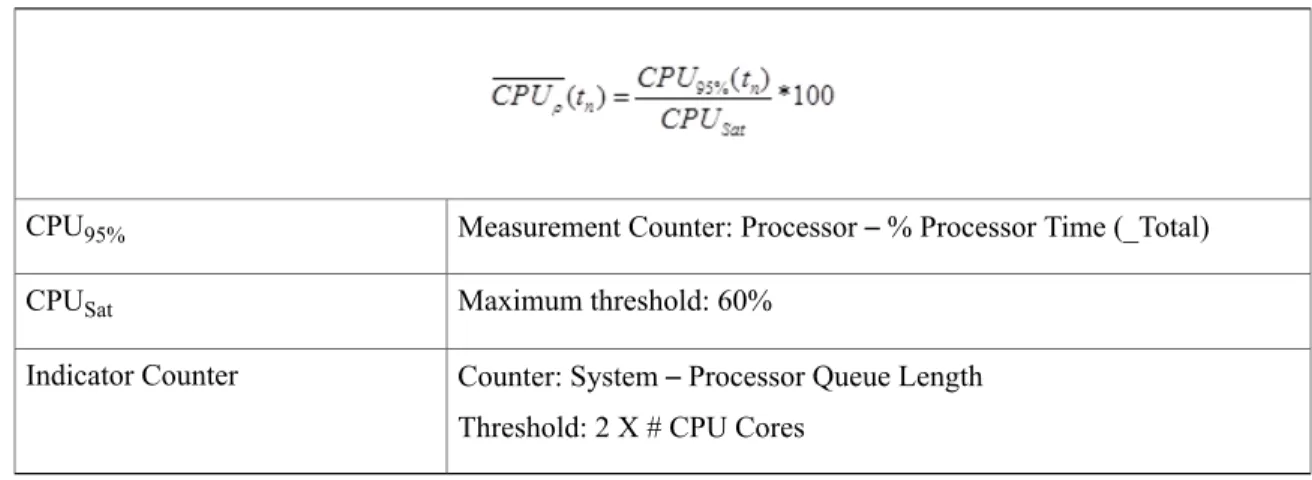
CPU Utilization Calculations
Table 1: Calculating CPU Utilization
Measurement Counter: Processor–% Processor Time (_Total) CPU95%
Maximum threshold: 60% CPUSat
Counter: System–Processor Queue Length Threshold: 2 X # CPU Cores
Indicator Counter Capacity Planning
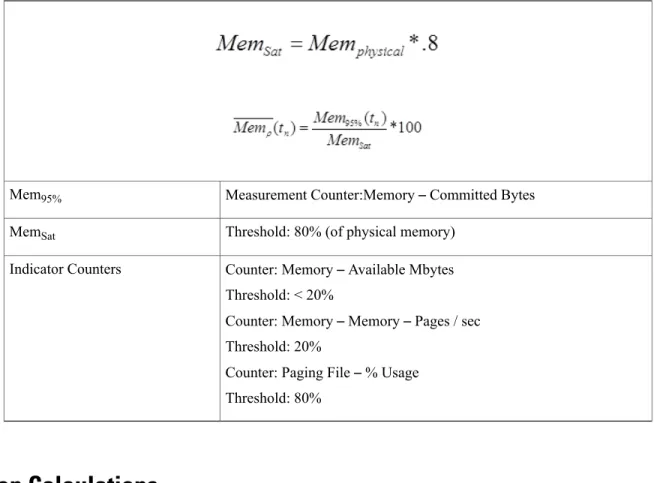
Memory Utilization Calculations
Table 2: Calculating Memory Utilization
Measurement Counter:Memory–Committed Bytes Mem95%
Threshold: 80% (of physical memory) MemSat
Counter: Memory–Available Mbytes Threshold: < 20%
Counter: Memory–Memory–Pages / sec Threshold: 20%
Counter: Paging File–% Usage Threshold: 80%
Indicator Counters
Disk Utilization Calculations
Table 3: Calculating Disk Utilization
Measurement Counter: Processor–% Processor Time (_Total) DT95%
Maximum threshold: 50% DTSat
Counter: Physical Disk–Avg. Disk Queue Length Threshold: 1.5
Indicator
Capacity Planning Memory Utilization Calculations
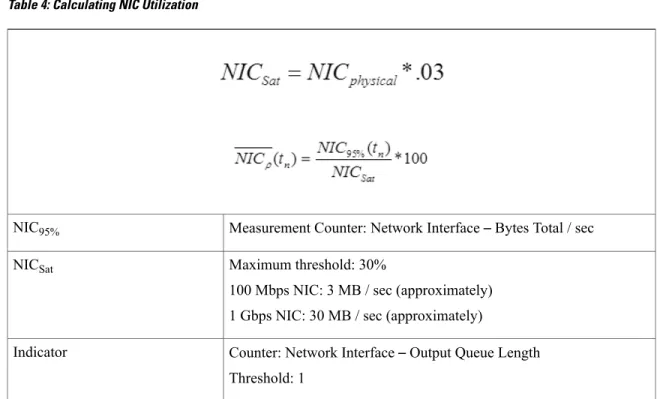
NIC Utilization Calculations
Table 4: Calculating NIC Utilization
Measurement Counter: Network Interface–Bytes Total / sec NIC95%
Maximum threshold: 30%
100 Mbps NIC: 3 MB / sec (approximately) 1 Gbps NIC: 30 MB / sec (approximately) NICSat
Counter: Network Interface–Output Queue Length Threshold: 1
Indicator
Maximum Utilization Calculations
The highest utilization can be determined with
Relating Traffic Load to Resources
Use Unified ICM/Unified CCE Router counters to relate traffic load to resource utilization. The Unified ICM/Unified CCE Router Performance Counters are:
•Calls/sec
•Calls In Progress
•Agents Logged On
Graphing these data sets relative to resource data sets may provide a compelling visual message. Capacity Planning
Capacity Planning Relating Traffic Load to Resources