Predicting required bandwidth for educational institutes using
prediction techniques in data mining
(Case Study: Qom Payame Noor University)
Mohammad Niknam Pirzadeh, Behrouz Minaei , Mohammad Tari , Jafar Pour Amini
Tehran Payame Noor Iran University of Science Tehran Payame Noor Qom Payame Noor
University and Technology University University
Summary
In this paper, we are going to analyze the information of a university's database using prediction techniques in data mining in order to predict internet bandwidth required for future periods. This prediction can help the university apply policies to utilize the existing facilities in the optimal way. Further, considering the high cost of bandwidth, by making a guess at peak hours of traffic in network, the university can formulate a special strategy to purchase or lease the internet bandwidth. In this paper, using Clementine software, we have dealt with application of prediction algorithms to Payame Noor University's database that after the stages of preparation and cleanup has included sixty successive months of the maximum bandwidth used by the university. Finally, we concluded that using these techniques it is possible to predict the bandwidth required for the next month of the university with 94.4 percent accuracy.
.
Key words:
data mining, algorithm, bandwidth, classification, neural network, prediction
1.
Introduction
Regarding students' increasingly dissatisfaction from undesirable internet service in internet sites and payment of very high costs of lease and provision of required bandwidth and information amount by the university, it seems necessary to redesign and restructure managers' policies and strategies in order to use this service better. In recent years, the rate of data output in some data sources especially Payame Noor University of Qom Province as an open university (the university that is based on remote education) that mainly seeks students' using virtual environments (as one of the tools of remote education) has had a quick and remarkable growth. In this university, a large amount of data is stored in web servers into a file named server access log.
There are different algorithms for data classification, including neural networks, decision tree, support vector machine, regression, etc. Considering increasingly
development of IT industry, the approach of most of companies is users who cooperate with the establishment via internet. Since the clients to an educational center (for example the students who refer to a university to use web) have the most informational transaction with the organization's internet site, desirable service and provision of bandwidth and information amount required by students and clients in these sites can be an appropriate scale for the evaluation of managers' policies.
2.
Knowledge discovery and data mining
The amount of data stored in databases is increasing quickly but still the rate of increasing human resources analyzing data is too lower than rate of data increase. There is an essential and necessary need for automatic and intelligent tools and methods. This need directs us to a new area named data mining and knowledge discovery. [4]This inter-field subject uses different methods of research (specially machine learning and statistics) to discover a high-level knowledge from data collections of real world. Data mining is the kernel of a more extended process named knowledge discovery from data (KDD). Knowledge discovery from database is defined as: a nontraditional process of detection of valid, new, inherently useful and very intelligible patterns from data. A KDD process includes the following stages:
1. Developing some detection from the applied program that is related to previous knowledge and final goal.
2. Making a target data collection to be used in knowledge discovery.
3. Data refinement and pre-processing (including controlling invalid data values, disorder in data, calculations of time series and recognized changes)
4. Reducing number of variables and finding similar samples of data, if possible.
5. Selection of data mining process (classification, regression, clustering, etc)
6. Selection of data mining algorithm
7. Exploring favorite patterns (this stage is actual data mining)
8. Interpretation of the discovered pattern; If needed, stages one to seven are repeated.
9. Integration of discovered information and preparation of a report [4]
KDD is related to general process of conversion of low-level data to high-low-level knowledge. An important and basic stage in KDD is data mining. The discovered knowledge should be appropriately intelligible. This matter is important because the discovered knowledge should be offered to a human resource to be used for decision-making processes. Therefore, it should be intelligible to him/her. If the discovered knowledge is a black box that makes various predictions without explaining them, then it is possible that these predictions do not be reliable for the user.
Knowledge intelligibility can be gained through presentation of high-level knowledge. One example of these tools that can also be used in data mining is rules of IF-THEN. Each rule in this method is stated as following:
IF < some conditions are satisfied>
THEN < predict some value for an attribute>
Indeed two principal goals of data mining are Prediction and Description.
"Prediction" includes using values of some variables or characteristics in data collection to predict future undetected values of other variables. On the other hand, "description" is based on finding patterns that describe data in a way that is interpretable for human being. [2]
2.1. Prediction data mining
Regarding database, storage and retrieval of information having time stamps is a complicated process. Moreover, this kind of data leads to increase in dimensions of problem in analysis processes. In these cases, applying methods of prediction data mining seems highly appropriate. [1]
The purpose of prediction modeling is determination (prediction) of especial values of data according to other groups of data; for example, prediction of discovered patterns from data collections can be used in predicting future values of variables.
Nevertheless, it is important to note this point that our prediction power is limited. As an example having the names of data collections including names of clients who have embarked to buy a specific article, we will not be able to predict the name of next client who may embark to buy. Therefore, it is important to determine basic factors that are effective in prediction.
Predictor modeling can lead to modification and optimization of pattern designation methods and statistical analysis methods and other data mining techniques based on feature-oriented methods while description data mining try to find patterns from data.
Prediction data mining using these models tries to predict the values of elements of the new data. In most of technical papers, the words of pattern recognition and classification have the same meaning. However, a more general definition of pattern recognition can be estimation. Estimation is allocation of a numerical value (from some finite numerical labels) to an observation; but there are principal differences between estimation and classification. Namely, the classes existing in a classification problem follow an explicit order (for example, an order of values); moreover, classes existing in problems related to estimation are infinite, while the number of classes in classification is finite. [3]
3.
Classification
The purpose of data classification is organizing and allocating data to detached classes. In this process, a primary model is established according to the distributed data. Then this model is used to classify new data. Thus, applying the obtained model, it can be determined that to which class the new data belongs. Classification is used for discrete values and foretelling. [5]
In the process of classification, the existing data objects are classified into detached classes with partitioned characteristics (separate vessels) and are presented as a model. Then considering features of each class, the new data object is allocated to them; its label and kind becomes determinable.
In classification, the established model is obtained based on some training data (data objects that their class's label is determined and identified). The obtained model can be presented in different forms like: classification rules (If-Then), decision trees, and neural networks.
Marketing, disease diagnosis, analysis of treatment effects, find breakdown in industry, credit designation and many cases related to prediction are among applications of classification. [5]
3.1. Types of classification methods
Classification is
possible through the following methods:• Bayesianclassification • Decision trees
• Regression • Genetic algorithms • Neural networks
• Support vector machine (SVM)
Here, we use the methods of "CART tree", "neural network", "regression", and "SVM"; compare them and finally combining above methods reach the best result for prediction.
As an example, upon such information as having a new individual's credit card, gender, age, and annual income, it can be guessed that if this individual uses life insurance or not; or having information about the individual's to have or not to have credit card and life insurance, and the individual's age, this individual's gender can be determined.
3.2. CART Algorithm
First, Breiman, Friedman, Olshen and Stone designed CART algorithm for trees of regression and classification in 1984.[6] The operation method of this algorithm is named Surrogate Splitting. This algorithm includes a recurrent method. In every stage, CART algorithm divides instructional records into two subsets so that the records of each subset are more homogeneous than previous subsets. These divisions continue until conditions of stop are established. In CART, the best breaking point or assignment of the value of impurity parameter is determined. If the best break for a branch makes impurity less than the defined extent, that split will not be made. Here, the concept of impurity is assigned to the degree of similarity between target field value and records arrived to a node. If 100 percent of the samples in a node are placed in a specific category of the target field, that node is named pure. It is remarkable that in CART algorithm, a foreteller field may be often used in different levels of decision tree. In addition, this algorithm supports categorical and continues types of foreteller and target fields.
3.3. Support Vector Machine (SVM)
In contemporary applications of machine learning, support vector machine (SVM) is known as one of the most precise and most powerful methods amongst well-known algorithms. Support vector machine is one of the methods of learning with supervisor that is used for classification and regression.
This method is among relatively new methods, which in recent years has shown a good efficiency compared to older methods for classification including Multi-Layer Perceptron neural networks. The basis of SVM is to find a linear boundry amongst classes of data objects. This effort
is made to select that line or hyperplane which has a wider safety margin. The solution of equation is finding the optimum line for data through optimization methods that are well-known methods in solving problems subject to constraint. If classes are not linearly separable, data should be taken to a very higher dimensional space so that the machine can classify highly complicated data. In order to solve the problem of very high dimensions using this method, Lagrange theorem is used to transform the intended minimization problem to its binary form that in which instead of the complicated functions, a simpler function named kernel function is used. This algorithm has powerful and flawless theoretical principles but needs a dozen samples to be responsive to problems with a number of dimensions. In addition, efficient methods for SVM learning are growing rapidly. In a learning process having two classes, the aim of SVM is finding the best function for classification so that in data collection, the members of the two classes can be recognized. For data collections that are linearly resolvable, the scale of the best classification is determined geometrically. From sensory aspect, that margin which is defined as part of the space or the same parting between two classes is defined by hyperplane. Geometrically, margin corresponds the least distance between nearest data and a point on hyperplane. This geometric definition authorizes us to find how to maximize margins, although we have incalculable hyperplanes and just a few deserve the solution for SVM. The reason that SVM emphasizes on the biggest margin for hyperplane is that this matter better provides the generalization capacity of the algorithm. This not only helps the efficiency of the classification and its precision on training data but also prepares the ground for better classification of the future data.
One of the problems of SVM is its calculative complexity. Nevertheless, this problem has been solved admissibly. One solution is that a big optimization problem is divided to some smaller problems that each problem includes a couple of precisely selected variables that the problem can utilize them effectively. This process will be continued until all these segmented parts are solved.
3.4. Regression
Doing regression, we are going to predict for future samples according to data, which is the original purpose in data mining through statistical methods.[1] Regression is divided to two kinds of linear and Logistic.
3.4.1. Linear regression
One of the primary goals of many statistical studies is making some dependency to allow predicting one or several variables according to others.
Linear regression method is a supervisory learning technique that by which we are going to model variations of a dependent variable through linear combination of one or several independent variables.
The advantage of linear regression is that it is simple to understand it and work with it. Generally, it is appropriate for strategy and prediction. Applying this method, from outcomes it can be realized that if this method has been appropriate or not. Therefore, we have some criteria by which we can realize that if we can rely on outcomes or not.
In doing regression, what seems important is determination of the degree of correlation that exists among data. Determining the degree of correlation of data related to input and output variables, it can be realized that if the linear regression is appropriate for doing data mining or not, so correlation coefficient and its assessments are important in many statistical studies. Therefore, among input variables those, which highly correlate, should not be applied together to determine the value of output variable.
3.4.2. Logistic regression
This method is one of the supervisory learning techniques. When outcomes are two classes, linear regression is not so efficient; in this state, applying this technique is more appropriate. The other point is that this method is a nonlinear regression technique and it is not necessary for data to have linear state. If we want to say the reason for use of logistic regression, we should argue that in linear regression not only outcomes should be in numerical forms, but also variables should be in numerical forms as well. Hence, the states that are in sort form should change to numerical forms.
3.5. Neural networks
Neural networks having the remarkable capacity to infer meanings from complicated or ambiguous data are used to discover patterns and to detect methods that their knowing is too complicated and difficult for human being and other computer techniques. A trained neural network can be considered a specialist in information topic that has been given to it to analyze.
Its other advantages include the following cases: [1,3] Adaptable learning: The capacity to learn how to do duties based on given information for practice and primary experiences.
Self-organizer: an ANN can establish its organization or presentation itself for the information that receives during learning period.
Real time performance: ANN calculations can be done in parallel; and special hardware is designed and built that can use this capacity.
Error tolerance without making pause during codification of information: minute breakdown of a network leads to fall of corresponding efficiency although some capacities of the network may remain even with a great damage.
3.5.1. Neural networks instruction
Up to here, we spoke about neural networks' capacities. Neural networks can process input signals based on their own design and convert them to intended output signals. Usually, when a neural network was designed and implemented, then parameters for collections of input signals should be adjusted in a way that output signals make a desirable output network. Such a process is named instructing neural network. (In the first stage of instruction, values are selected randomly, because the neural network cannot be used unless these parameters have value.) While instructing neural network (namely, gradually simultaneous to the increase of the times that values of parameters are adjusted to reach a more desirable output) the values of parameters approach to their actual and final values.
Generally, there are three methods to instruct neural networks.
Supervised learning: In this method as it was previously mentioned, an instructional set is intended and the learner acts according to an input and achieves an output. Then, a teacher that can be our intended output evaluates this output; and based on the difference between this output and desirable output, a series of changes is made in learner's performance. These changes can be the lengths of connections.
Unsupervised learning: in this method, simultaneous to learning process, instructional sets are not used and this method does not need information about desirable output. In this method, there is no training labels; and usually it is used to group and compact information.
An instance for this method is Kohonen algorithm. Reinforcement learning: In this method, there is no training labels as an instructor and the learner itself is instructed through trial and error. In this method, a primary strategy is intended. Next, this system acts according to that procedure and receives a response from the environment in which it acts. Then, it is checked that if this response has been proper or not and regarding that response, the learner is punished or rewarded. If the learner is punished, will repeat the act that has led to that punishment less; and if the learner is rewarded, tries to do the act that has led to reward more.
4. Clementine software
SPSS Clementine data mining software is one of the most prominent software in data mining domain. This software is from famous SPSS software series and like previous statistical software has many facilities in data analysis domain.
The last version of this software is 12 that after its publication, next version named PASW Modeler was published. Among advantages of this software, the following cases can be mentioned:
• Consisting highly various methods for data analysis • Very high speed in doing calculations and using
database's information
• Consisting graphical environment for user's more comfort in doing analytic tasks
In new version, data cleanup and preparation are accomplished fully automatically. This software supports all famous database software like Microsoft Office, SQL, etc.
Modules existing in this software are: PASW Association
PASW Classification PASW Segmentation
PASW Modeler Solution Publisher
This software can be installed on both personal computer and server; and supports 32-bit and 64-bit Windows too.
5. Data cleanup
All fields that exist in university's log server are explained in the next section. These data are deduced from Ibsng log software that is internet accounting software on Qom Payame Noor University's server.
5.1. Original raw data: (Table No.1)
date: in this column, the date that the student has visited a site mentioned in url column is determined.
time: in this column, the exact time that the student has visited a site is determined.
id: the identity code of the student that has used the site ip: the address of the computer that the student has used to visit the site
url: the address of the site that the student has used byte: the amount of date transferred in bytes resulting from site visit
2.5. cleansing data
In this stage, using table No.1 that is a table with almost one million records for 5 successive years log of students' use of internet, we can find maximum, minimum, and
average values in terms of kilobytes for students' monthly use.
Table 1 (original raw data)
Here, fields that are not requisite for prediction are omitted and new fields that have been mentioned in table 2 are discovered.
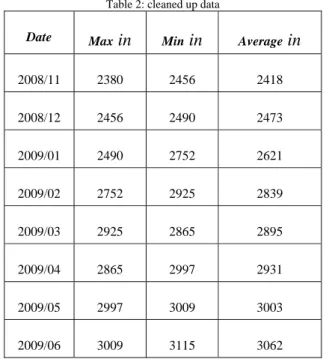
Table 2: cleaned up data
Date Max in Min in Average in
2008/11 2380 2456 2418 2008/12 2456 2490 2473 2009/01 2490 2752 2621 2009/02 2752 2925 2839 2009/03 2925 2865 2895 2009/04 2865 2997 2931 2009/05 2997 3009 3003 2009/06 3009 3115 3062
Date: intended month and year
Max in: maximum bandwidth received in intended month Min in: minimum bandwidth received in intended month Average in: average of bandwidth received in intended month
5.3. Data prepared for software
In order to make table of instructional data for classification algorithms, first we transfer column of Max in completely to an excel column and then transfer the
same values to an opposite column in conditions that the first record is deleted; the result is table 3:
Max in pre field is the same field that the algorithm should be finally able to predict one of them.
Table 3: Data prepared for software Max in Max in pre
2380 2456 2456 2490 2490 2752 2752 2925 2925 2865 2865 2997 2997 3009 3009 3115
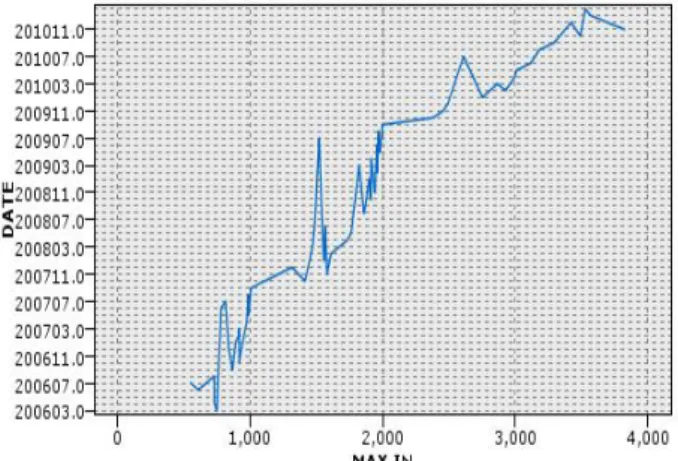
Thus, the graph resulted from cleaned up values is presented in figure 1. As it can be seen, generally, the trend of used bandwidth amount has been increasing but in some months, it has a remarkable decline.
Figure 1: the graph for the used bandwidth amount
Regarding the investigations made during one year, students' use of internet has a remarkable recession in August and February; and in months of October, September, and May has a more percentage of increase. As it is evident in table 4, considering student increase in recent years, the percentage of annual growth of internet use in years 2008 and 2010 is more than three other years.
Table 4: increase percentage of annual bandwidth average year Annual Average Increase
Percentage 2006 791 2007 1163 31.99 2008 1772 34.37 2009 2180 18.72 2010 3303 34.00
6. The model created in Clementine software
Now, applying Clementine software and partition node, we define eighty percent of data as instructional data and ten percent as training data and the ten remained percent as evaluation data from the final table prepared for software. Then we connect the node related to numerical prediction algorithms to related data and in its settings part, we activate the intended methods, namely CART algorithm, neural network algorithm, regression, and SVM. (Figure 2)Figure 2: The procedure for selection of intended algorithms
Here, in order to implement the above algorithms, we should define columns target and input. We present column max in as input and column max in pre as target.
After implementation of algorithms and creating intended models, we create combinational model of used algorithms and compare them to each other. Figure 3 shows the procedure for implementation of the combinational algorithm.
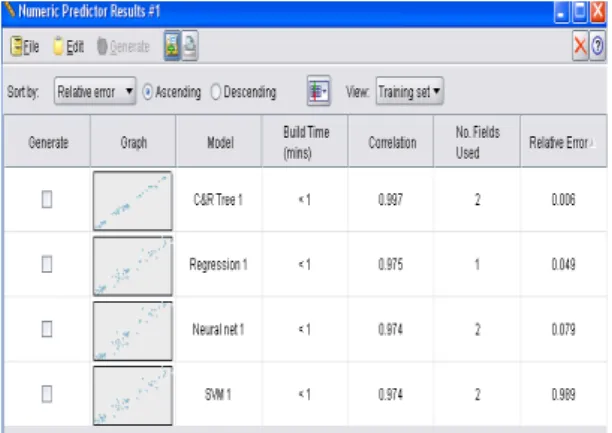
7. Evaluation and results
Results related to evaluation of the created model coming from implementation of combinational algorithm are as follows:
Figure 4: Results and evaluation of algorithms
With respect to values of correlation and relative error obtained for different algorithms, CART algorithm shows the best results so it is the most appropriate algorithm for intended prediction. Regression, neural network, and SVM are placed in next orders, respectively.
In table 5, the results related to combinational algorithm composed of above algorithms are mentioned:
Table 5: results from evaluation of combinational algorithm
As it is evident, in this model, values related to Mean Absolute Error both for instructional and training data and evaluation data are low.
In respect to evaluation of model created in software and investigation of its results, the estimated accuracy of this algorithm in predicting next month's required internet bandwidth is 94.4 percentage that is very appropriate. It means that with less than 6 percent error, suitable next month's required bandwidth can be predicted and purchased according to data related to university's existing bandwidth.
Figure 5 is model analysis that indicates the above matter.
Figure 5: Model Analysis
8. Conclusion
In general, data mining that its application is daily increasing can lead to utilization of existing information in higher education institutions and centers in strategic decision-making fields. Specially, created models from instructional data using data mining algorithms can be utilized as a decision support system for site managers and play an important role in reducing payable costs to purchase and lease universities' internet lines.
9. REFERENCES
[1] Andrew W. Moore. "Regression and Classification with Neural Networks". School of Computer Science Carnegie Mellon University. 2001.
[2] Mosavi, M.R., "A Comparative Study between Performance of Recurrent Neural Network and Kalman Filter for DGPS Corrections Prediction", IEEE Conference on Signal Processing (ICSP 2004), China, Vol.1, pp.356-359, August 31-4, September, 2004.
[3] Ramos, V. and Abraham, A., "Evolving a Stigmergic Self-Organized Data-Mining", Conf. on Intelligent Systems, Design and Applications (ISDA-04), 2004, pp.725-730. [4] Jiawei Han, Micheline Kamber, (2001). Data mining:
Concepts and Techniques.
[5] Zaki, M.J., Gouda, K., "Genmax: an efficient algorithm for mining maximal frequent item sets", Data Mining and Knowledge Discovery, Springer science and Business Media, Inc., Manufactured in Netherlands, pp.1-20, 2005. [6] Breiman, Leo, Jerome Friedman, R. Olshen and C. Stone
(1984). Classification and Regression Trees. Belmont, California: Wadsworth