TEXTILE TECHNOLOGY
Method for the Prediction of the Rate of +b Color Change in Upland Cotton
(Gossypium hirsutum L.) as a Function of Storage Temperatures
G.R. Gamble*
G. R. Gamble, USDA-ARS, Cotton Quality Research Station, P.O. Box 792, Clemson, SC 29633
*Corresponding author: [email protected]
ABSTRACT
Previous studies have indicated that HVI +b values of baled Upland cotton increase due to prolonged storage with uncontrolled temperature conditions. This change in +b is accompanied by decreases in reducing sugar content and pH. The present study attempts to elucidate the depen-dence of this trend on storage temperature and time, and to develop a model capable of predicting +b changes at any given temperature and time. A single bale of cotton was subjected to varying
temperature and time conditions, and resultant values of reducing sugar content, pH, and +b were determined. Exponential regressions gave rate constants that were temperature dependent and obeyed the Arrhenius expression. A model was constructed that allows prediction of +b as a function of time and temperature. The model will be used as a basis for the construction of a more extensive model that can be used to predict color change in any Upland cotton based on initial +b, reducing sugar content, and pH values.
T
he market value of raw cotton is determined by anumber of critical factors, including fiber length uniformity, fiber strength, leaf grade, and color
grade. Color grade is classed by the Agricultural Marketing Service using HVI (Uster Technologies, Knoxville, TN), and is based on measured Rd
(diffuse reflectance) and +b (yellowness) values. Although few published scientific studies have been
performed demonstrating that cotton yellowness
affects yarn processing, yarn quality, or finished
fabric dyeability, it is widely accepted that color is
an indicator for potential difficulties, including the
appearance of barré (Bailey, 2002). A correlation between the increase in cotton yellowness due to warehouse ageing and a decrease in yarn strength
has been reported (Gamble, 2007a). Furthermore,
decreases in reducing sugar levels were significantly
correlated with both decreasing yarn strength and
increasing fiber yellowness. Even though yellowness
in raw cotton is used to set market value, the causes of it have been investigated only in a limited number of studies. Previous studies (Marsh et al., 1958) have
indicated that field-weathered cottons exhibiting
relatively low copper reduction values, which are indicative of low reducing sugar content, display a lower propensity to brown as a result of heating at 160 °C. The authors attributed this lowered sugar content to the growth of microbes on the cotton surface. It was further established that decreasing reducing sugar content due to microbial growth was correlated with increasing pH levels.
for imparting the brown color to cooked meats (Bor-das et al., 2004), baked bread (Mundt and Wedzicha, 2007), and fried potatoes (Quayson and Ayernor, 2007). Results of the previously cited study (Gamble, 2007b) have demonstrated that heating greige cotton yarn results in a decrease in reducing sugars and an increase in absorbance due to browning products. These changes were accompanied by a decrease in
pH and an increase in fluorescence intensity. All of
these factors have been extensively cited (Nursten, 2005) as indicators of the Maillard reaction. Based on these results, it is probable that the yellowing
mechanism producing increases in +b in cotton is
the Maillard reaction. Various techniques, includ-ing addition of sulfur dioxide, bufferinclud-ing at low pH, and refrigeration have demonstrated effectiveness at slowing the reaction (Nursten, 2005). Whether these methods are effective or economically viable treatments of baled cotton have not been extensively explored. It may be more effective to manage the storage conditions of cotton to minimize the rate
at which the cotton undergoes an increase in +b.
Prior to the last several years, storage conditions would not have been expected to affect the quality characteristics to the extent that they do today. The reason for this is the shift in consumption from domestic markets to overseas. This entails, in many cases, extended storage in warehouses at elevated temperatures or residence in cargo containers that likewise may expose the cotton to elevated tempera-tures for extended periods. The goal of the present study is to develop a methodology by which the rate of color change in stored cotton may be predicted as a function of storage temperature. In this study, samples from one bale of cotton were subjected to different temperature conditions for varying lengths of time. Resultant chemical and color data was used to develop a model to predict color changes.
MATERIALS AND METHODS
Accelerated ageing with added moisture. Fif-teen separate 10 g samples from one bale of Upland cotton grown in New Mexico in the 2007 crop year were cleaned on a Shirley Analyzer (Shirley Institute,
Manchester, England) and conditioned at 25 °C and
65% RH for 24 h prior in preparation for accelerated ageing using varying amounts of excess water. An initial moisture content of 6.7% (wet basis) of the cotton was measured according to standard test meth-ods (ASTM, 2001). Three samples were
subsequent-ly placed in glass jars with tight fitting lids without
additional moisture. Three identical sets were also prepared with added moistures of 1, 2, and 3% (wet basis), respectively, resulting in samples of 7.7, 8.7, and 9.7% moisture (wet basis). One additional set without added moisture was prepared and placed in jars without being sealed. These prepared samples were then placed in a laboratory oven at 60 °C. The samples were individually removed from the oven at different time intervals ranging from 24 to 96 h.
Accelerated ageing without added moisture.
Similar 10 g samples were prepared and placed in glass jars without added moisture and sealed. Samples were treated at 50, 60, or 70 °C for times ranging from 2.5 to 418 h.
Color measurement. Following removal of the cotton samples from the oven, the jars were allowed to cool to room temperature and equilibrated at 25 °C and 65% RH for 24 h; after which they were
sub-jected to HVI color measurements for Rd and +b
according to standard test methods (ASTM 1999).
Sugar and pH determinations. Subsequent to HVI measurements, two separate 1 g samples were taken from each of the oven-treated samples and extracted using 20 ml deionized water per gram of
cotton. Each sample was agitated with a glass rod to
promote wetting of the cotton surface. The wetted sample was allowed to sit for 15 min before being wrung out and the extract was analyzed for pH using an Orion Model 310 pH meter (Orion Research, Inc., Beverly, MA). The same extract was then analyzed for glucose and fructose content using High
Perfor-mance Anion Exchange Chromatography (Dionex Model ICS3000, Sunnyvale, CA). Each sugar was quantified based upon comparison of peak areas with
the peak areas of a calibration solution containing 100 ppm of each sugar.
Statistics. Linear regressions were performed using SigmaPlot 8.0 (SPSS Science, Chicago IL). T-tests were performed using SigmaStat 3.0 (SPSS Science, Chicago IL).
RESULTS AND DISCUSSION
The rate of Rd and +b color change at 60 °C was determined as a function of added moisture content.
The results indicate that +b changes over time are not
dependent upon the amount of vapor phase moisture available (Table 1). However, the unsealed samples
the results are consistent with studies by Eichner and
Karel (1972) that indicated that the reaction, though
generally more efficient at lower water activities,
slowed down under extremely dry conditions due to the impediment to mobility of the reactants. It was assumed for the purposes of this study that cotton stored in warehouses displays a water activity similar to the sealed samples in Table 1. Furthermore, be-cause added moisture has no apparent effect on the
rate of +b change, all subsequent results are reported
for cotton samples that were sealed during heating with no added moisture.
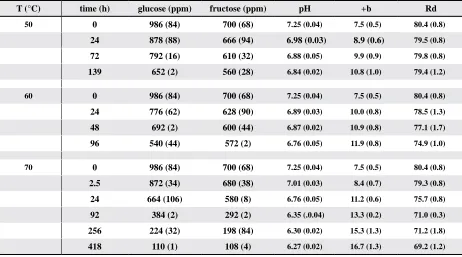
Chemical and colorimetric data are presented in Table 2 for samples heated for varying lengths of time at three different temperatures. Both fructose and glucose contents decreased as a function of heating time at all of the observed temperatures;
in addition, pH decreased and +b increased. These
results are consistent with previous results (Nursten, 2005) that demonstrated that the reaction between reducing sugars and proteins or free amino acids led to a decrease in pH as well as the production of colored compounds. At 50 °C, Rd does not exhibit
a significant change, whereas at 60 and 70 °C, Rd
decreases. These results suggest that under the con-ditions of this study, the change in Rd may be due to an alteration of the surface waxes, because the onset of wax melting is in the 60 to 70 °C range. This conclusion is in keeping with previously reported results (Gamble, 2007a) indicating that in the range of normally encountered cotton bale storage
condi-tions (< 50 °C), Rd was not significantly affected.
Therefore, this study was primarily concerned with
changes to +b.
Table 1. Rd and +b as a function of moisture and heating time at 60 °C
Heating Time (h)
Added Moisture (% wet basis)
0 1 2 3 unsealed (dry)
+b Rd +b Rd +b Rd +b Rd +b Rd
0 7.5(0.5) 80.4(0.8) 7.5(0.5) 80.4(0.8) 7.5(0.5) 80.4(0.8) 7.5(0.5) 80.4(0.8) 7.5(0.5) 80.4(0.8)
24 9.9(0.9) 79.1(1.4) 10.1(0.7) 78.6(1.5) 10.0(0.9) 78.3(1.3) 10.0(0.9) 77.8(1.3) 7.8(0.7) 79.9(1.2)
48 11.0(0.9 78.3(2.0) 10.8(0.8) 77.5(1.6) 10.9(0.7) 76.7(0.9) 10.9(0.9) 76.0(1.6) 8.2(0.6) 80.1(1.4)
96 11.9(0.8) 75.8(0.9) 11.9(0.7) 75.3(1.1) 11.6(0.7) 74.4(0.7) 11.8(0.8) 74.2(0.7) 8.5(0.7) 78.8(0.9)
Table 2. Chemical and color variables as a function of heating time at 50, 60, and 70 °Cz
T (°C) time (h) glucose (ppm) fructose (ppm) pH +b Rd
50 0 986 (84) 700 (68) 7.25 (0.04) 7.5 (0.5) 80.4 (0.8)
24 878 (88) 666 (94) 6.98 (0.03) 8.9 (0.6) 79.5 (0.8)
72 792 (16) 610 (32) 6.88 (0.05) 9.9 (0.9) 79.8 (0.8)
139 652 (2) 560 (28) 6.84 (0.02) 10.8 (1.0) 79.4 (1.2)
60 0 986 (84) 700 (68) 7.25 (0.04) 7.5 (0.5) 80.4 (0.8)
24 776 (62) 628 (90) 6.89 (0.03) 10.0 (0.8) 78.5 (1.3)
48 692 (2) 600 (44) 6.87 (0.02) 10.9 (0.8) 77.1 (1.7)
96 540 (44) 572 (2) 6.76 (0.05) 11.9 (0.8) 74.9 (1.0)
70 0 986 (84) 700 (68) 7.25 (0.04) 7.5 (0.5) 80.4 (0.8)
2.5 872 (34) 680 (38) 7.01 (0.03) 8.4 (0.7) 79.3 (0.8)
24 664 (106) 580 (8) 6.76 (0.05) 11.2 (0.6) 75.7 (0.8)
92 384 (2) 292 (2) 6.35 (.0.04) 13.3 (0.2) 71.0 (0.3)
256 224 (32) 198 (84) 6.30 (0.02) 15.3 (1.3) 71.2 (1.8)
418 110 (1) 108 (4) 6.27 (0.02) 16.7 (1.3) 69.2 (1.2)
As mentioned previously, determination of re-action orders in solid systems may be exceedingly
difficult. To determine the order, and presupposing that +b changes are due to the Maillard reaction, the
content of all free amino acids as well as those com-prised in available proteins need to be determined as a function of heating time. This is the subject of continuing investigation and lies beyond the scope
of the present work, which is to predict +b changes
as a result of conventional storage temperatures. To address this issue, the initial assumption was made that over the range of normally encountered cotton storage conditions (temperature and length of time)
the first term in Eq. [3] will dominate. That is, the second term plays a significant role only under ex -traordinarily high temperatures or ex-traordinarily long storage periods. The validity of this assumption was reexamined subsequent to development of a working model (see below). Under this assumption only the initial reaction period was considered, which
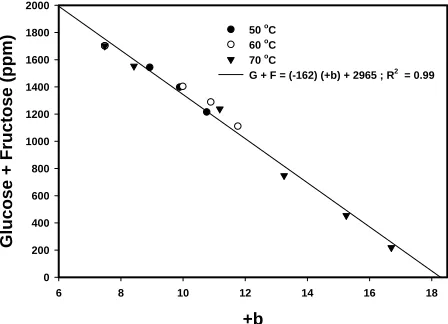
The relationship between +b and total reducing
sugar content of the heat-treated samples are shown in Fig. 1. When subjected to linear regression, the
result-ing fit strongly suggests an inverse linear relationship,
with a slope of −162, a y-axis intercept of 2965, an x
-axis intercept of +b = 18.18, and a coefficient of deter -mination of R2 = 0.99. This linear relationship suggests
that the rate of change of +b may be approximated as
being of the same reaction order with respect to glu-cose and fructose. Determination of reaction orders in homogeneous systems with high water activities are relatively straightforward, being based on chemical kinetic theory, but become complex when the system in question displays multiple reaction pathways, i.e., both glucose and fructose reacting with any number of free amino acids or proteins. Adding to the complexity
is the fact that these reactions may deviate from first
order, making solution to the nth order reactions (n ≠
1) much more difficult to attain than with first order reactions. It has been shown (Eichner and Karel, 1972)
that in solid phase systems with low water activity, as in the present work, classical chemical kinetics does not provide a straightforward solution. With this in
mind, an initial assumption of first order behavior with
respect to the sugars was tested. The results at 70 °C were observed to test this assumption because after 418 h of heating, the levels of glucose and fructose
approached 0, allowing a more rigorous fit of the data
to the equations to be tested. Figure 2 shows glucose content as a function of heating time at 70 °C. The
initial assumption of first order kinetics means that
the rate is described as
Rate = dG/dt = kG , [1]
where G represents the concentration of glucose and
k is the rate constant for the reaction. Rearrangement and integration leads to
G = G0 e-kt, [2]
where G0 is the initial concentration of glucose. As
seen in Fig. 2, however, the data do not fit this simple exponential function. When the data are fit using the
bi-exponential equation
G = G0,a e-k1t + G0,b e-k2t , [3]
with G0,a + G0,b = G0, a large improvement is observed.
The fit to a bi-exponential implies that glucose may react by two separate first order pathways, one of
which, described by k1, is 10 times faster than the
other, described by k2. A second possibility is that
the reaction is not first order.
Figure 1. Total reducing sugar concentration as a function of +b.
+b
6 8 10 12 14 16 18
Glucose
+
Fructose
(ppm)
0 200 400 600 800 1000 1200 1400 1600 1800 2000
50 oC
60 oC
70 oC
G + F = (-162) (+b) + 2965 ; R2 = 0.99
Time (h)
0 100 200 300 400
Gl
uco
se
(pp
m
)
0 200 400 600 800 1000
G = G0 e-kt ; G0 = 901, k = 0.0080
G = G0,a e-k1t + G0,b e-k2t ; G0,a = 434, k1 = 0.0367
G0,b = 520, k2 = 0.0038
G = G0,a e-kt + G0,b ; G0,a = 534, k = 0.0367, G0,b = 424
allowed the second exponential term in Eq. [3] to be
approximated by a constant. Glucose was monitored to t1/2, the time at which G = 1/2 G0, and the results
fit using Eq. [4]:
G = G0,a e-kt + G0,b . [4]
The result is seen in Fig. 2, and up to t = t1/2 = 50
h, Eq. [4] provides a nearly identical fit to the data,
with k(Eq. [4]) = k1(Eq. [3]). The variables G0,a and G0,b are altered to some degree, however. Fructose
exhibited similar behavior (not shown), and the
data fit to t ≤ t1/2 likewise may be fit using Eq. [4],
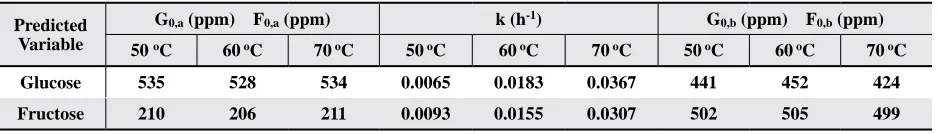
with F replacing G. Application of this treatment to both fructose and glucose at 50, 60, and 70
°C yields the data in Table 3 using Eq. [4]. It is
notable that the variables G0,a and F0,a as well as G0,b and F0,b do not vary substantially as a function
of temperature. The rate constant k does vary as a function of temperature, increasing in magnitude at higher temperatures. This behavior is consistent
with the Arrhenius Equation (Eq. [5]), which states
that for many reactions, the rate constant k varies with T(K) according to
k = A e-E/RT , [5]
where E is the energy of activation for the reaction,
R is the gas constant (= 8.314 J mol-1 K-1), and A is
the pre-exponential factor. Taking the logarithm of
each side of Eq. [5] yields
ln(k) = ln(A) −E/RT . [6]
If Eq. [5] is obeyed, ln(k) plotted as a function of 1/T
yields a straight line with slope −E/R and intercept ln(A), allowing E and A to be determined. When the ln(k) values from Table 3 are plotted vs. 1/T for both glucose and fructose, the results, shown in Fig.
3, appear to obey Eq. [5].
Results of +b vs. time at 70 °C are shown in Fig.
4. Similar to glucose and fructose, the results can be
fit using a bi-exponential rise to maximum. In this
case the equation used is
+b = +b0 + m(1 − e-k1t) + n(1 − e-k2t) , [7]
where +b0 is the initial value of +b prior to heat
treatment, m and n are variables, and k1 and k2 are
rate constants. As with glucose and fructose, when
the fit is limited to data where t ≤ t1/2 = 50 h, then
Eq. [7] may be simplified to
+b = +b0 + m(1 − e-kt) . [8]
The resulting fit is seen in Fig. 4. Similar treatments for +b vs. t data obtained at 50 and 60 °C yield values
for +b0, m, and k at each temperature (Table 4).
Table 3. Regression parameters for glucose and fructose resulting from a fit of concentration vs. heating time using Eq. [4]
Predicted Variable
G0,a (ppm) F0,a (ppm) k (h-1) G0,b (ppm) F0,b (ppm)
50 oC 60 oC 70 oC 50 oC 60 oC 70 oC 50 oC 60 oC 70 oC
Glucose 535 528 534 0.0065 0.0183 0.0367 441 452 424
Fructose 210 206 211 0.0093 0.0155 0.0307 502 505 499
Figure 3. ln(k) as a function of 1/T for glucose, fructose, and +b.
2.6 2.8 3.0 3.2 3.4 3.6
ln k
-6 -4 -2 0
Glucose; ln(A)= 24.7, E=79.8 kJ mol-1, R2 = 0.99
Fructose; ln(A)=15.7, E = 54.9 kJ mol-1 , R2 = 0.99
+b; ln(A) = 18.0, E = 59.0 kJ mol-1 , R2 = 0.99
1/T x103 (K-1)
Figure 4. +b as a function of heating time at 70 °C. Time (h)
0 100 200 300 400
+b
6 8 10 12 14 16 18
+b = +b0 + m(1-e-k1t ) + n(1-e-k2t ); +b = 7.61, m = 4.05, n = 8.15
k1 = 0.0656, k2 = 0.0023
When ln(k) is plotted against 1/T (Fig. 3), the results indicate that the rate constant for the increase
in +b obeys the Arrhenius expression (Eq. [5]). By extrapolation using Eq. [6] and the obtained values of
lnA = 18.0 and E = 59.0 kJ mol-1, the rate constant for
the reaction resulting in +b increases may be predicted at any temperature. This allows utilization of Eq. [8]
at a given temperature to calculate the rate constant
for the change in +b as a function of storage time. Un -like the case for glucose and fructose, however, the
variable m from Eq. [8] is not constant as temperature
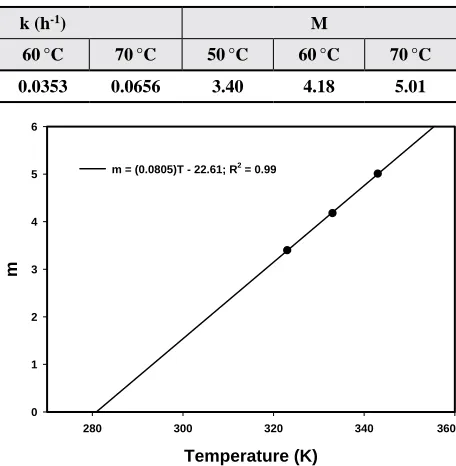
changes. In addition to the rate constant k, a solution for m is also needed. When m is plotted as a function of temperature (Fig. 5), a clear trend is observed. A
linear fit with slope 0.0805 and y-axis intercept −22.61
also passes through 281 K (= 8 °C) at m = 0. Though
highly predictable, the cause of this behavior of the variable m is uncertain, but may be a result of ing mobility of the reactants as a function of decreas-ing temperature. Knowdecreas-ing the behavior of k and m as
a function of temperature allows prediction of +b at
time t at any temperature. To validate this conclusion, 10 g of untreated cotton was allowed to age at 21 °C
and 65% RH for 90 d (= 2160 h). To predict the +b value after this time period, m is first calculated from
the linear regression shown in Fig. 5:
m = (0.0805)T− 22.61 = 1.0651 , [9]
where T is in units of K. The rate constant k is
next calculated using Eq. [6] and the values for the
parameters A and E/R obtained from the linear fit
in Fig. 3:
ln(k) = 18.0 − (7096)(1/T) = −6.129 [10]
and
k = 0.00218 (T = 294 K) .
These values are then substituted into Eq. [8]: +b = +b0 + m(1 − e-kt) = 8.55.
The experimentally determined value for +b using
HVI after 2160 h at 21 °C is 8.6 ± 0.7. This provides considerable substantiation that the model provides
a practical method of predicting changes in +b under
a large range of storage conditions. As mentioned
previously, to arrive at Eq. [8] the assumption was
made that the second term in Eq. [7] could be treated
as a constant. This is only valid when the cotton is stored for a period less than t1/2, the time at which
the reducing sugar content reaches 1/2 of its initial
value. For longer time periods, +b may change by a
greater amount than predicted. Nonetheless, the model
predicts the minimum change to +b over a given time
at a given temperature. As a hypothetical example, a cotton bale identical to the one treated in this study is purchased in the U.S. and shipped to Asia. The transit
time within a cargo container is approximately 21 d (=
504 h). If the temperature within the cargo container
is 30 °C (= 86 °F), a reasonable temperature to expect
in an unrefrigerated container, then after 21 d
+b = 7.5 + [1.78][1 − e-(0.0044)(504)] = 9.08 .
It is apparent that the color grade upon arrival in Asia may not match the original value determined in the U.S. just 3 wk prior. Shipping the same cotton via
a refrigerated container at 8 °C ( = 46 °F) results in +b = 7.5 + [0.01][1 − e-(0.0007)(504)] = 7.5 ,
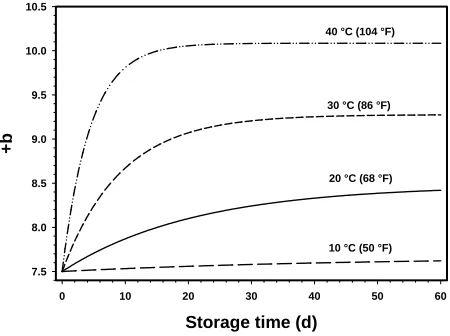
or no change in color grade. In Fig. 6, values of +b (calculated using Eqs. [8], [9], and [10]) are shown
as a function of storage time at four temperatures encompassed by a range of typically encountered storage temperatures. The practical utility of presenting
the data this way lies in the ability to approximate +b
changes at any given storage temperature and time. It must be emphasized that the present model relates
primarily to the specific cotton used in this study.
Figure 5. Pre-exponential m as a function of T.
Table 4. Regression parameters for +b resulting from a fit of +b vs. heating time using Eq. [8]
Predicted Variable
+b0 k (h-1) M
50 °C 60°C 70°C 50°C 60°C 70°C 50°C 60°C 70°C
+b 7.56 7.57 7.48 0.0182 0.0353 0.0656 3.40 4.18 5.01
Temperature (K)
280 300 320 340 360
m
0 1 2 3 4 5 6
Though different cottons will undergo the same
chemical reactions leading to +b increases, it is likely
that they are dependent upon the levels of reducing
sugars present initially, the initial value of +b (+b0),
and possibly the initial pH. A more comprehensive model taking these factors into account is currently in development.
Bailey, D.L. 2002. Barré: methods to prevent barré in knitted
fabric. 15th Ann. EFS Conference, Memphis, TN. 10–12
June 2002. Cotton Incorporated, Inc. Available online at: http://www.cottoninc.com/20002ConferencePresentation
s (verified 7 Apr 2008).
Bordas, M., Moyano, E., Puignou, L., and M.T. Galceran.
2004. Formation and stability of heterocyclic amines in a
meat flavour model system. Effect of temperature, time, and precursors. J. Chromatogr. B, 802:11–17.
Burdurlu, H.S., and F. Karadeniz. 2003. Effect of storage
on nonenzymatic browning of apple juice concentrates.
Food Chem. 80:91–97.
Dattatreya, A., Etzel, M.R., and S.A. Rankin. 2007. Kinet -ics of browning during accelerated storage of sweet whey powder and prediction of shelf life. Int. Dairy J.
17:177–182.
Eichner, K., and M. Karel. 1972. The influence of water
content and water activity on the sugar-amino browning reaction in model systems under various conditions. J.
Agric. Food Chem. 20(2):218–223.
Gamble, G.R. 2007a. The effect of bale ageing on cotton fiber
chemistry, processing performance, and yarn quality. J.
Cotton Sci. 11:98–103.
Gamble, G.R. 2007b. The Relationship Between Maillard Reaction Product Formation and the Strength of Griege Yarns Subjected to Accelerated Ageing Conditions. Proceedings, World Cotton Research Conference 4, Lub-bock, TX. In press.
Kroh, L.W. 1994. Caramelization in food and beverages.
Food Chem. 51:373–379.
Marsh, P.B., G.V. Merola, M.L. Butler, and M.E. Simpson. 1958. The influence of weathering prior to harvest on certain properties of cotton fibers. Textile Res. J. 28(2):95–111.
Martinez, M.V. and J.R. Whitaker. 1995. The biochemistry and control of enzymatic browning. Trends in Food Sci.
Tech. 6:195–200.
Mundt, S., and B.L. Wedzicha. 2007. A kinetic model for
browning in the baking of biscuits: Effects of wa -ter activity and temperature. LWT-Food Sci. Tech.
40:1078–1082.
Nursten, H.E. 1981. Recent developments in studies of the Maillard reaction. Food Chem. 3:263–277.
Nursten, H.E. 2005. The Maillard reaction: chemistry, bio -chemistry and implications. Royal Society of Chemistry. Cambridge, UK.
Quayson, E.T., and G.S. Ayernor. 2007. Non-enzymatic
browning and estimated acrylamide in roots, tubers and
plantain products. Food Chem. 105:1525–1529. Figure 6. +b as a function of storage time in a range of
typi-cally encountered storage temperatures.
Storage time (d)
0 10 20 30 40 50 60
+b
7.5 8.0 8.5 9.0 9.5 10.0 10.5
40 °C (104 °F)
30 °C (86 °F)
20 °C (68 °F)
10 °C (50 °F)
CONCLUSIONS
When a bale of cotton was subjected to varying temperature and time conditions, resultant values of
reducing sugar content and +b were fit to exponential
regressions to give rate constants that are tempera-ture dependent and obey the Arrhenius expression.
The general expression for predicting +b is given by Eq. [8], which contains a variable, denoted by m, that is also temperature dependent according to Eq. [9]. A model was constructed that allows prediction of +b as a function of any given storage time and
temperature that may be encountered under typical conditions for the particular cotton used in this study. The present model will be the basis for construction of a more extensive model that can be utilized to predict color change in any Upland cotton based on
initial +b, reducing sugar content, and pH values.
REFERENCES
American Society for Testing and Materials (ASTM). 1999. Standard test methods for measurement of physical
properties of cotton fibers by high volume instruments (D5867–95). In Annual Book of ASTM Standards. Vol. 07.01 Textiles. ASTM, West Conshohocken, PA. American Society for Testing and Materials (ASTM). 2001.