Workers’ Compensation Program in the 1970’s
by Daniel N. Price *
Workers’ compensation has become a focus of public attention in the 1970’s to a degree unprecedented in its 70-year history. Federal legislation, two national study groups, a rush of State reform amendments, and congressional hearings and bills propos- ing Federal standards have all contributed to the ferment of inquiry about the relevance and adequacy of the present system of State workers’ compensation. Among the questions raised are: Does the system cover all the workers that should be pro- tected? Are the benefits provided adequate? And what are the cost implications to employers of the changing program? For many years, the Social Security Administration has published estimates of the number of workers covered, the benefits paid, and the costs of workers’ compensation. This article provides benchmark data to bring coverage and benefit estimates up to date and analyzes statutory provisions measuring several aspects of benefit adequacy.
Newly developed estimates of coverage, benefits, and costs under workers’ compensation programs place total coverage under such programs during 1976 at nearly 70 million persons, or about 88 percent of the average monthly number of wage and salary workers (including Federal employees) during the year. Payments under workers’ compensation programs totaled $7.6 billion, well over twice the annual amount being paid at the beginning of the decade. The total included $5.2 billion of direct compensation payments and $2.4 billion for medical and hospitalization payments.
fits program was the responsibility of the Social Security Administration. (Claims since the end of 1973 have been under the jurisdiction of the U.S. Department of Labor.)
Largely because of this interest, the Social Security Administration has published at regular intervals a series of estimates on the number of workers covered, benefits paid, and the costs of workers’ compensation. This article provides new benchmark data for coverage and benefit estimates, and examines statutory provisions concerning benefit adequacy.
The Social Security Administration has a direct and long-standing interest in workers’ compensation pro- grams. The provision of disability and survivor benefits by workers’ compensation programs is important to the social security program in coordinating, preventing dup- lication, and planning changes in social security. Since 1965, social security payments to workers receiving both workers’ compensation benefits and disabled-worker benefits under the social security program have been adjusted by the Social Security Administration through an offset provision. Coordination was also essential dur- ing the period (1970-73) when most of the claim and payment activity under the Federal “black lung” bene-
Brief History
of Program
In 1908, the first workers’ compensation program covering certain Federal civilian employees in hazardous work was enacted. Similar laws were passed in 1911 in some States for workers in private industry, but it was not until 1949 that all States had established pro- grams to furnish income-maintenance protection to workers in the event of disability from work-related injury or illness. For the next several decades, State laws were improved by expanding coverage, raising benefits, and liberalizing eligibility requirements and by increas- ing the scope of protection in other ways.
* Division of Retirement and Survivors Studies, Office of On December 30, 1969, the Federal Coal Mine Health Research and Statistics, Social Security Administration. and Safety Act established a Federal program of cash
benefit payments to coal miners and their widows for disability or death from pneumoconiosis (black lung disease-a disease contracted from working in and around coal mines). This important law was originally intended as temporary remedial legislation and was subsequently amended to return the responsibility for paying black lung benefits to the State workers’ com- pensation programs and employers. Perhaps most note- worthy in the Federal Coal Mine Health and Safety Act was the assumption by the Federal Government of
responsibility for a program relating to a specific OCCU-
pational disease-previously excluded from coverage under State workers’ compensation programs-and the mandating of future coverage by the employer or the State programs for the particular disease.
The year after the black lung benefits program was enacted the Occupational Safety and Health Act was passed. This law established a national program to secure the safety of the workplace and created the National Commission on State Workmen’s Compensa- tion Laws to evaluate current programs and make recommendations for improvements. The Commission’s report in 1972 found that the programs were inadequate; it included a large number of recommendations-19 of them were deemed essential to make workers’ compensa- tion a modern, effective system. Using these recommen- dations as guidelines, States have made many changes in their workers’ compensation programs. As a further consequence of the Commission’s report, hearings were held at the Federal level and various bills were intro- duced in Congress proposing federally mandated changes in workers’ compensation.
In 1974, the Interdepartmental Workers’ Compensa- tion Task Force took up some of the issues suggested by the National Commission.’ The progress of States in meeting the essential recommendations of the Com- mission 2 was evaluated by the Task Force.
Coverage
Methodology
Data for measuring the status of workers’ compensa- tion programs are not as complete or as highly devel- oped as those for other social insurance programs, despite their long history. The lack of data can be ex- plained by a variety of factors. Each State program has its own provisions that may differ markedly from those of other States in scope of coverage and benefit pro-
1 See Proceedings of the Interdepartmental Workers’ Com- pensation Task Force Conference on Occupational Diseases and Workers’ Compensation, U.S. Congress, Joint Committee Print, 1976.
2 See Report of the Policy Group of the Interdepartmental Workers’ Compensation Task Force, January 1977.
visions. More important for availability of program statistics, State programs differ in administrative pro- cedures and in the insurance mechanisms used to under- write the risk of work injury.
Under most State programs, employers can establish the required workers’ compensation protection for their employees by insuring with a commercial carrier or by self-insuring if they meet specified criteria for estab- lishing proof of financial security. In addition, 18 States operate public insurance funds that employers may use as insurers. Only six of these funds are “exclusive”- that is, the law does not allow private companies to write workers’ compensation policies. The States, then, are seldom the direct operators of the workers’ compen- sation insurance program. As a result, they are not in a position to gather the data that are byproducts of other social insurance systems such as the social security program.
To fill this gap the Social Security Administration has developed a methodology over the years to esti- mate coverage and payrolls of State programs and to make State and national estimates of benefits and costs. In addition, key program indicators have been devel- oped: The proportion of the potential labor force cov- ered, the percentage of wage loss compensated in temporary total disability cases, the relation of benefits and premium costs to payrolls, and the proportion of premiums used for benefits and expenses. These indi- cators are used in the annual notes on workers’ com- pensation published in the Social Security Bulletin and in the more comprehensive Bulletin articles appearing regularly at 4-year intervals.
One way of evaluating a national social insurance program like workers’ compensation is to examine the number of workers protected by the program, especially in relation to the workforce. (See the historical series in table 1.) Since coverage data are not available from program operations as they are for social security and many other public income-maintenance programs, the Social Security Administration had to develop a methodology for estimating the number of covered workers.”
Information compiled by insurance companies and used as the basis for these coverage estimates is based on policy years that generally overlap calendar years, and it cannot be fully evaluated until the end of the policy year. A time lag in the availability of converted calendar-year data is thus inevitable. The Social Security Administration’s estimating methodology provides benchmark estimates for workers covered in an average month in the latest full calendar year for which private carrier coverage estimates can be computed. The new
3 For a detailed description of the methodology and sources of data, see the Bulletin, July 1950, pages 4-5; August 1958, pages 4-6; and October 1970, page 5.
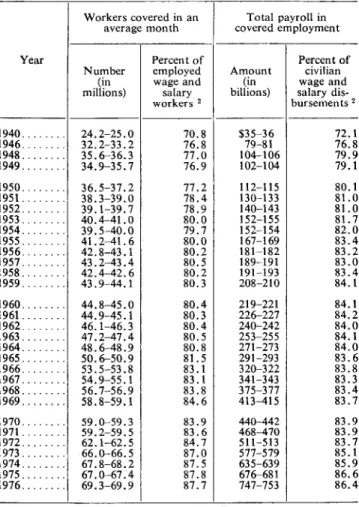
Table l.-Estimated number of workers covered in an average month and total annual payroll in covered employment, selected years, 1940-76 l
Year
1940 ... 1946 ... 1948 ... 1949. ... 1950 ... 1951... 1952 ... 1953 ... 1954 ... 1955 ... 1956 ... 1957 ... 1958 ... 1959 ... 1960 ... 1961. 1962 ... 1963. ... 1964 ... 1965 ... 1966. ... 1967 ... 1968. ... 1969. ... 1970 ... 1971... 1972 ... 1973 ... 1974 ... 1975 ... 1976. ...
-
-- Number
(in millions)
Percent of employed wage and
salary workers r
Amount (in billions)
Percent of civilian wage and salary dis- nrrsements r 24.2-25.0 70.8
32.2-33.2 76.8 35.6-36.3 77.0 34.9-35.7 76.9
$;;I;;
104-106 102-104 72.1 76.8 79.9 79.1 36.5-37.2 38.3-39.0 39.1-39.7 40.4-41.0 39.5-40.0 41.2-41.6 42.8-43.1 y-D&~ 43:9-44: 177.2 78.4 78.9 80.0 79.7 80.0 80.2 112-115 130-133 140-143 152-155 152-154 167-169 181-182 189-191 191-193 208-210 80.1 81.0 81.0 81.7 82.0 83.4 83.2 83.0 ii:;’ 44.8-45.0 44.9-45.1 46.1-46.3 47.2-47.4 48.6-48.9 50.6-50.9 80.5 EZ 53.5-53.8 54.9-55.1 56.7-56.9 58.8-59.1 80.4 80.3 80.4 80.5 80.8 81.5 i::: 83.8 84.6
219-221 84.1 226-227 84.2 240-242 84.0 253-255 84.1 271-213 84.0 291-293 83.6 320-322 83.8 341-343 83.3
375-317 83.4 413-415 83.7 59.0-59.3 59.2-59.5 62.1-62.5 66.0-66.5 p4& 6913-6919
83.9 440442 83.9 83.6 4688470 83.9 84.7 511-513 83.7 87.0 577-579 85.1 87.5 635-639 85.9 87.8 67668 1 86.6 87.7 747-753 86.4 -
k
r Before 1959, excludes A ska and Hawaii.
* Midpoints . . of range usec i in computmg . percentages. Beginning 1967, employed wage and salary workers exclude those aged 14 and 15 (as well as younger workers) and includes certain workers previously classi-
fied as self-employed.
Workers covered in an Total payroll in average month covered employment
Source: Employed wage and salary workers from Current Population Survey, Bureau of Labor Statistics. Wage and salary disburses ents from Bureau of Economic Analysis, Department of Commerce.
benchmark estimates presented here are for calendar year 1973 and reflect the usual 4-year update cycle. Once new benchmark figures are developed, coverage estimates are also made for years between benchmarks
and for years beyond the benchmark period. In this article the employment trend data, adjusted by the esti- mated effects of legislative changes in coverage, are projected to provide national estimates of coverage for
1974-76, with individual State figures reported for 1976. The coverage estimates are compiled by developing an estimated covered-payroll amount for each State and then converting this amount to the number of workers based on the relationship between payroll and the num- ber of workers covered under unemployment insurance. In the few States where there are differences between the two programs in statutory size-of-firm coverage, an adjustment is made in the average wage to compensate for the typically lower average wage for employees in small firms.
The primary source of payroll data is the National Council on Compensation Insurance. For 1973, payroll data were reported by 11 competitive State funds and by private insurance companies in 44 States and the District of Columbia. Twenty years earlier, comparable data were available for only seven State funds and for private insurance companies in 40 States. The Social Security Administration converts these policy-year pay- roll figures into calendar-year payroll estimates and sup- plements them with payroll estimates for self-insurers and for other State funds. The latter figures are obtained from State administrative agencies and various other sources.
The end result of these procedures is an estimate of the average monthly number of workers covered by the workers’ compensation program in each State. The esti- mated average monthly number of workers is, of course, much smaller than the total number of indi- viduals covered at some time during the year. The estimates include all employees of firms that actually carry workers’ compensation insurance or that submit the required financial proof of ability to self-insure, as well as employees of self-insured State and local govern- ment agencies, regardless of whether State law requires proof of financial security to self-insure. Employees of firms who voluntarily purchase workers’ compensation insurance are also included, since they cannot be sep- arated from those required to insure.
This method of estimating coverage has the advan- tage of being applicable to all States on a uniform basis. Not only are primary data compiled from national sources such as the National Council on Compensation Insurance and the unemployment insurance program, but the concept of coverage is applied uniformly in each State.
The State totals also include an estimate of workers covered by the Longshoremen’s and Harbor Workers’ Compensation Act, practically all of whom are insured by private carriers. The number of Federal workers covered under the Federal Employees’ Compensation Act is estimated separately and not distributed among the States. The estimates exclude railroad workers in interstate commerce and seamen in the United States Merchant Marine, who are covered by statutory pro- visions for employer liability rather than by a workers’ compensation law.
Benchmark coverage figures for 1973 and coverage projections through 1976 are shown, by State, in table 2. Differences in coverage levels from one period to an- other and the difference in levels from State to State are a composite of several factors such as statutory changes, labor-force trends, and variations in the quality of avail- able data. More uniform, accurate data are now avail- able. The National Council on Compensation Insurance payroll data now include more States than they did, Social Security Bulletin, May 1979/Vol. 42, No. 5 5
Table 2.-Estimated average monthly number of wage and salary workers covered by workers’ compensation, 1973 and 1976
[In thousands] State
-
-- 1973 1976 Total. 66,02%66,529 69,307-69,907 Alabama ...
Alaska ... Arizona ... Arkansas. ... California. ... Colorado. ... Connecticut. ... Delaware. ... District of Columbia. .... Florida.
Georgia. ... Hawaii. ... Idaho ... Illinois. ... Indiana. ... Iowa ... Kansas. ... Kentucky ... Louisiana. ... Maine. ... Maryland. ...
Massachusetts. ... ... Michigan ...
Minnesota. ... Mississippi. ... Missouri. ... Montana ... Nebraska ... Nevada ... New Hampshire. ... New Jersey,
New Mexico. New York.. North Carolina, North Dakota.. Ohio Oklahoma. Oregon Pennsylvania. Rhode Island. South Carolina. South Dakota.. Tennessee. Texas Utah. Vermont. Virginia. Washington. West Virninia
... ... ... ... ... ... ... ... ...
. ... ...
Wisconsii I-I Wyoming.
Federal employees i..
-
790 587:, 475 7,300 75&800
1,075 185 365 2,300-2,400
1,315 275 206 3,970 1,45&1,600
900 510 805 895 260 1,075 1,870 2,780 1,200 485 1,:;: 450-500
215 260 2,400
220 2,380 255 6,070
1,X&1,600 5,780 144
1,650-1,750 170 3,550
500 3,630 555 675-725 750-800
3,900
265 3,890 270
750 840
146 161
1,025 2,790
1,100 3,180
325 370
128 147
1,420 1,050
1,540 1,160
505 540
1,490 1,550
78 97
2,832 2,854 865 134
635
535 7,830 82G-870
1,075 190 350 2,40&2,500
1.000 295 240 4,060 1’5wtG00
’ 660 865 1,040
299 1,100 1,85C-;,‘99;
1:280 510 1,470
215 475-525
255 270
i Excludes employment outside the United States.
and better estimating techniques are available for some States. Nevertheless, much of the available data, par- ticularly for self-insurers, is indirect and in some in- stances incomplete. The 1973 estimates were sent to the State administrative agencies for review. Where the accuracy of final estimates was still uncertain, a range of values was used in table 2.
Coverage Estimates
The new benchmark estimates for 1973 yield an average monthly number of covered persons of 66.0-
66.5 million. The covered payroll for these workers was $577-579 billion (table 1). These estimates were less than 1 percent and 3 percent, respectively, above corresponding projections made earlier for 1973.4 Pro- jecting the current benchmark to 1976 produces an average of 69.3-69.9 million persons covered under workers’ compensation and an accompanying total pay- roll of $747-753 billion.
The roughly 69.6 million persons covered in 1976 represented 88 percent of the average monthly number of wage and salary workers during the year. Average monthly coverage was 10 million persons higher in 1976 than in 1970 and represented an additional 4 per- cent of total wage and salary workers. Both these figures are impressive, short-term gains for a program with as lengthy a history as workers’ compensation that can be largely attributed to expansions in the coverage provisions of many State programs taking place be- tween 1970 and 1975. After 1975, such legislative expan- sion efforts slowed dramatically.
Although the coverage projections through 1976 have been adjusted to reflect the effects of statutory exten- sion of coverage, the coverage rates in table 1 flattened out after 1973. This situation may be partly attributable to a lag between new coverage enactments and effective coverage of these workers as reflected in the insured pay- roll and consequently in the coverage estimates. Small establishments, farms, and some other newly covered employers may need a transitional period before full compliance is achieved. The modest increase in the pro- portion of workers covered after 1973, despite the many extensions of coverage in the early 1970’s, may also reflect a longer-term problem-the difficulty of assuring that marginal establishments do provide the insurance mandated by 1aw.j
Two ways in which States extended coverage un- der their workers’ compensation programs were by switching from elective to mandatory coverage and by eliminating “size-of-firm” restrictions. In 1968, 23 States permitted elective coverage and 24 States had size-of- firm coverage restrictions. By 1976 the number of States permitting elective coverage had dropped to three and the number with size-of-firm restrictions had fallen to 12. The number of States that provided some protection for farm workers rose from 21 at the end of 1968 to 33 by the end of 1976.
Despite these improvements, important gaps in 1976 in coverage under workers’ compensation programs still exist. Three States still permitted elective coverage in 1978 and only one of 18 States without significant farm-
4 See Daniel N. Price, “Workmen’s Compensation Payments and Costs, 1973,” Social Security Bulletin, January 1975, page
34.
5 See John H. Lewis, Coverage (forthcoming report for the Interdepartmental Workers’ Compensation Task Force), page 4.
worker coverage in 1976 had added these workers by 1978. Only two of the 12 States with size-of-firm restric- tions reduced their list of exemptions but neither elimi- nated the restriction altogether. Furthermore, one State newly established an exemption for firms with fewer than three employees. Among the States with these restrictions, the mandating of workers’ compensation was applicable in firms of two or more to six or more employees.
Protection for farm workers varied considerably be- cause in addition to the total lack of protection in some States, only 11 of the 33 States that covered farm work did so on the same basis as for other covered employees. In the others, various exceptions-for farm employers with less than specified payrolls, for example, or for workers designated as seasonal or casual-limited the protection to differing degrees.
Similarly, although domestic workers had been COV- ered under 23 programs by 1976, only one additional State covered a major part of this group by 1978. Perhaps the single largest group of workers still ex- cluded from many State programs were the casual employees who work infrequently, irregularly, or in an incidental type of task for a given employer. Accord- ing to a study as of December 1975, 3.7 million casual workers were outside the workers’ compensation sys- tem.6
Even for employees of State and local governments, a lack of protection still exists, and indications are that in the past few years little progress has been made in this area. Information in the Congressional Record for May 11, 1978, shows that 22 States were not yet in compliance with the recommendations of the National Commission on State Workmen’s Compensation Laws for coverage of government employees. These States were the same 22 that had comparably incomplete cov- erage of government workers in 1976.7
State Variations
in Coverage
The proportion of workers covered under workers’ compensation laws in 1976 ranged from less than 61 percent to more than 96 percent. In almost one-half of the States the proportion of covered, workers rose substantially from 1968 to 1976, a period characterized by an unusually high level of extension of coverage. In- creases of at least five percentage points in the propor- tion of workers covered were recorded for 11 States
6 Ibid., page 9.
7 Such evaluations may be a matter of judgment. The Analysis of Workers’ Compensation Laws (U.S. Chamber of Commerce, 1976 Edition), reported a different list of States that “sub-
stantially” met the National Commission recommendations. All but seven of the States with incomplete State and local govern- ment coverage were’evaluated in that report as being in sub-
stantial compliance.
from 1972 to 1976. In 13 other States the estimated proportion of covered workers went up at least five percentage points from the 1968 proportion.
As chart 1 shows, some fairly well-marked patterns in State coverage ratios are evident for 1976, when the ratios are arranged in three broad groups: Less than 70.0 percent, 70.0-84.9 percent, and 85.0 percent or more. The Pacific Coast, Northeastern, and Midwest- Great Lakes States tended to show ratios of 85.0 per- cent or more.
States in the southeastern quadrant of the country tended to have lower proportions of workers covered. Comparisons with data for earlier years show that sig- nificant gains have been made in coverage. Only five States remained in the less-than-70.0-percent group by 1976, compared with 11 States in 1972 and 15 States in 1968.
As chart 1 reveals, the large, higher-wage industrial States tended to provide the most extensive coverage, and the agricultural, lower-wage States tended to pro- vide protection to a lower proportion of their workers. The following tabulation indicates a decided inverse
I Number of jurisdictions Percent covered
Total
Less than 70 ... 7&84 ... 85 or more. ...
5 :i
With manufacturing wages below U.S. average Number Percent of total
4 80
it 3636 relationship between the level of production-worker weekly earnings in manufacturing (as of October 1976) and the proportion of workers covered by workers’ compensation.
Benefits
Workers’ compensation provides cash and medical care benefits in the event of work-related disability. In 1976, these payments totaled $7.6 billion, nearly four times the $2.0 billion paid 10 years earlier (table 3). In the 10 years from 1956 to 1966, benefits rose at a more moderate pace: The 1966 total was just double the amount paid in 1956.
The program provides several types of benefits. Cash payments for temporary total disability and permanent total and partial disability, medical care benefits to disabled workers, and indemnity benefits to survivors of workers who died of employment-related causes.8 As
8 Benefits are also available to workers for rehabilitation
(physical and vocational), not included in data reported here.
Chart l.-Actual coverage as a percent of potential coverage, by jurisdiction, 1976
table 4 shows, $5.2 billion or 69 percent of all workers’ compensation benefits in 1976 were in the form of cash payments for disability (58 percent) or death (11 per- cent). The remaining 31 percent represented payments of medical and hospital costs.
The introduction of the Federal black lung program in 1970 altered the rather stable distribution of pay- ments by type of benefit that existed earlier. Under the black lung program, only 0.2 percent of all pay- ments in 1976 were paid for medical care, compared with an estimated 36 percent of the payments under workers’ compensation programs. On the other hand, the black lung program has paid a disproportionate
share of benefits to survivors: 39 percent in 1976, com- pared with 7 percent under the State programs.
The distribution of regular program benefits (exclud- ing black lung benefits) was about the same in 1976 as in most earlier years. This finding is surprising in the light of substantial legislative liberalizations in cash- payment formulas in the early 1970’s. Medical benefits were also liberalized during this period, but the num- ber of States that made such changes was much smaller than the number changing the formula for cash benefits and the nature of the medical care improvements was more limited in scope and effect. It might have been expected, therefore, that cash benefits would have ac- counted for a greater proportion of the total by 1976. Evidently the rapid escalation of medical costs in recent
Federal Employees
years balanced the growth in cash benefits to workers and their survivors.
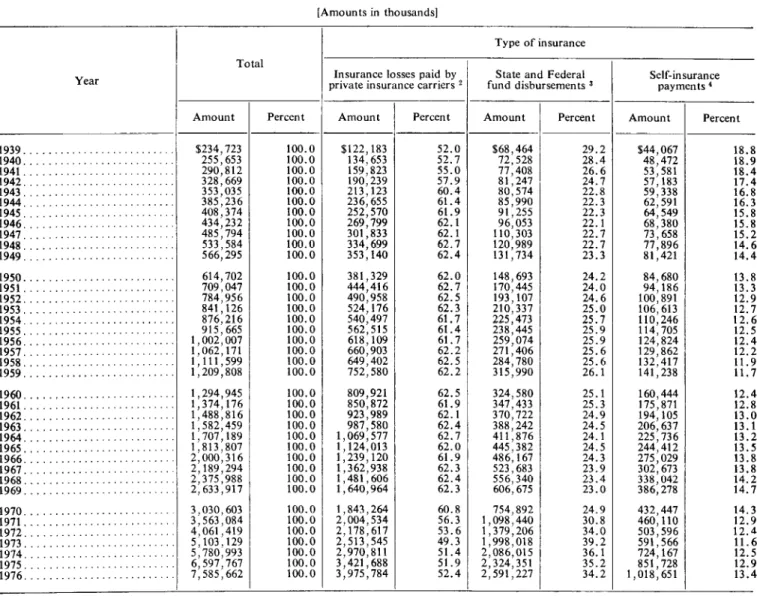
The benefit protection afforded by workers’ compen- sation can be provided through three different insuring mechanisms. Employers have the option of covering the risk by purchasing a policy with a private insurer (in all but six States), by purchasing a policy from a State-operated insurance fund (in 18 States), or by self- insuring (in all but four States). Table 3 shows that $4.0 billion or 52 percent of the total was paid by private carriers, $2.6 billion or 34 percent by State funds, and $1.0 billion or 13 percent by self-insurers.
Historically, private insurance has accounted ‘for a higher proportion than that indicated by the amounts shown in table 3 for recent years. From 1943 through 1970, private insurance benefits represented 60-63 per- cent of the yearly totals. State funds were responsible for 22-26 percent of the payments made during those years, and payments by self-insurers varied from 12 percent to 16 percent.
The change in these relationships during the 1970’s has been caused by payments under the Federal black lung benefit program. If black lung payments are ex- cluded, the historical benefit distribution among the different types of insurers remains fairly stable through- out the 1970’s and is similar to that for earlier years. For 1976, the percentage distribution of benefits (ex- cluding black lung benefits) was: Private insurance, 60
Table 3.-Benefit payments, by type of insurance, 1939-76 l [Amounts in thousands] -
Year
Type of insurance State and Federal fund disbursements 3 Total -
Insurance losses paid by
private insurance carriers 2 Self-insurance payments 1
I-
-
Amount Percent Amount Percent Amount Percent Amount
%: 76:;
2901812 328,669 353,035 385,236 408,374 434,232 485,794 :36:; :ii 614,702 709,047 784,956 841,126 876,216f
915,665 ) 002,007 1,294,945 1,374,176 1,488,816 1,582,459 1,707,189 1,813,807 2,000,316 2,189,294 2,375,988 2,633,917 3,030,603 ;,;z; > y;; 5’103:129 5:780,993 6,597,767 7,585,662 100.0 100.0 100.0 100.0 100.0 100.0 100.0 100.0 100.0 100.0 100.0 100.0 100.0 100.0 100.0 100.0 100.0 100.0 100.0 100.0 100.0 100.0 100.0 100.0 100.0 100.0 100.0 100.0 100.0 100.0 100.0 100.0 100.0 100.0 100.0 100.0 100.0 100.0 $;;;‘g 159’823 190’239 213:123 236,655 252,570 269,799 301,833 334,699 353,140 52.0 52.7 55.0 51.9 60.4 61.4 61.9 62.1 62.1 62.7 62.4 381,329 444,416 490,958 524,176 540,497 562,515 618,109 660,903 649,402 752,58085; 990 91,255 96,053 110,303 120,989 131,734 29.2 28.4 26.6 24.7 22.8 22.3 22.3 22.1 22.7 22.7 23.3 62.0
62.7 148,693 62.5
170,445 62.3 193,107 61.7 210,337 61.4 225,473 61.7 238,445 62.2 259,074 62.5
271,406 62.2 284,780 315,990 809,921
850,872 923 989
24.2 24.0 24.6 25.0 25.7 25.9 25.9 25.6 25.6 26.1 62.5
61.9 324,580 62.1 347,433 62.4 370,722 62.7 388) 242 62.0 411,876 61.9 445,382 62.3 486,167 523,683 62.4
62.3 556,340 606,675
25.1 25.3 24.9 24.5 24.1 24.5 24.3 23.9 23.4 23.0 1,843,264 60.8
2,004,534 56.3 754,892 24.9 30.8 432,447 2,178,617 53.6 1,098,440 34.0 460,110 2,513,545 49.3
1,379,206
1,998,018 39.2 503,596 2,970,811 51.4 2,086,015 36.1 591,566 3,421,688 51.9 2,324,351 35.2 724,167 3,975,784 52.4 2,591,227 34.2 1,018,651 851,728
18.8 18.9 18.4 17.4 16.8 16.3 15.8 15.8 15.2 14.6 1939. 1940. 1941. 1942. 2 : 1945, fE8: : :;:;: : 1950. 1951.. :;:: : : :;:t: : 1956.. 1957. 1958. 1959. . ET: 1962. E? : 1965. 1966.. 1967. 1968. 1969 ... ... ... ... ... ... ... ... ... ...
... 14.4
13.8 13.3 12.9 12.7 12.6 12.5 12.4 12.2 11.9 11.7 ... ... ... ... ... ... ... ... ... ... 12.4 12.8 13.0 13.1 13.2 13.5 13.8 13.8 14.2 14.7 ... ... ... ... ... ... ... ... ... ... 1970 ... 1971... 1972 ... 1973 ... 1974 ... 1975 ... 1976 ...
14.3 12.9 12.4 11.6 12.5 12.9 13.4 L
1 Before 1959, excludes Alaska and Hawaii.
z Net cash and medical benefits paid by private insurance carriers under standard workers’ compensation policies. Data from the Spec- tator: Insurance by States of Fire, Marine, Casualty, Surety and Mis- cellaneous Lines; published and unpublished reports of State insurance commissions; and A. M. Best Co.
3Net cash and medical benefits paid by competitive and exclusive State funds and the Federal systems. Beginning 1970, includes Federal black lung benefits. Includes payment of supplemental pensions from
general funds. Compiled from State reports (published and unpub- lished) and from the Spectator and the Argus Casualty and Surety Chart (annual issues) and other insurance publications. For some funds, data for fiscal years.
4 Cash and medical benefits paid by self-insurers, plus the value of medical benefits paid by employers carrying workers’ compensation policies that do not include the standard medical coverage. Estimated from available State data.
percent; State funds, 24 percent; and self-insurance, 178,000 dependent wives and children, were on the 15 percent. rolls by the end of 1973. Since the beginning of 1974,
The black lung payments, like those for the Federal employee workers’ compensation program, have been included with the amounts shown for State funds since, like the State funds, they are publicly funded and op- erated. The following tabulation shows the quick growth in benefit payments under the black lung benefits pro- gram from 1970 to 1973 and their subsequent leveling off. This pattern reflects the large number of claims filed in the first few years of the program on behalf of individuals who had become disabled or died from pneumoconiosis before the 1969 legislation was enacted and who were “blanketed in”. under the new program.
Year
Black lung benefit payments, by type (in millions)
I
Total 1 Disability Survivor 1970 ...
1971... %i 1972 ... 554 1973 ... 1,045 1974 ... 955 1975 ...
1976 ...
$33 147 224 395 351 361 385 About 284,000 miners and widows, as well as Department 1 Beginning of Labor 1974, includes (less than 0.2 percent cash and medical of total). care benefits paid by
Table 4.-Benefit payments, by type, 1939-76 I
[In millions]
Year Total
1939... $235 1940... 256 1941.. _. 291 1942... 329 1943... 353 1944.. 385 1945... 408 1946.. 434 1947... 486 1948... 534 1949... 566 1950...
1951... 1952.. 1953... 1954.. 1955... 1956.. 1957... 1958... 1959...
615 709 785 841 876 916 1,002 x5 If210 1960..
1961.. 1962... 1963... 1964... 1965. 1966.. 1967. _. 1968... 1969...
1,295 t% 1’582 11707 1,814 2,000 2,189 2,376 2,634 1970...
1971...
3,031 1972...
3,563 1973...
4,061 5,103 1974...
1975...
5,781 1976..
6,598 7,586
-
1
-
Medical and hos- pitaliza- rion pay-
ments
-
I
Compensation payments Total Disability Survivor %:E! 112 120 125 140 160 175 185
% “E
191 157 221 185 241 203 265 225 283 241 294 250 326 280 359 309 381 329 200 415 360 233 476 416 260 525 460 280 561 491 308 568 498 325 591 521 350 652 517 360 702 617 375 137 647 410 800 700 435 860
460 914 495 994 525 1,057 565 1,142 600 1,214 680 1,320 750 1,439 830
920
1,546 1,714
155 105 804 110 879 115 932 125 1,007 135 1,074 140 1,170 150 1,284 155 1,381 165 1,529 185 1,050
1,130
1,981 2,433 1,250
1,480
2,811 1,760
3,623 2,030
4,021 4,568 2,380 5,206
1,751 230 2,068 365 2,351 460 2,953 670 3,351 670 3,843 725 4,391 815 Type of benefit
1 Before 1959, excludes Alaska and Hawaii. Beginning 1970, includes Federal black lung benefits.
Source: Estimated by Social Security Administration on the basis of unpublished policy-year data from the National Council on Compensa- tion Insurance.
when claims for black lung benefits were turned over to the Department of Labor, a relatively small number of new benefits have been awarded.
Beginning in 1979, the number of claims and the amount of benefits paid under the black lung program may increase substantially. The Black Lung Benefits Reform Act of 1977 liberalized entitlement and offered previously denied applicants the opportunity to file again under the new provisions. The Department of Labor estimates that more than 400,000 claims will be processed through 1980, including 67,000 new claims and 85,000 claims for medical benefits to miners pres- ently receiving only cash benefits.g
Information available for private insurance payments
9 See Department of Labor, Black Lung Benefits Act: Annual Report on Administration of the Act, 1978.
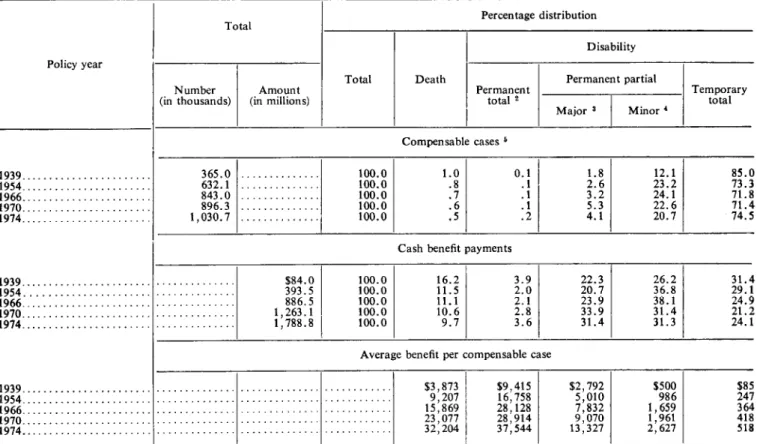
under workers’ compensation programs on the number of beneficiaries and amount of benefits, by extent of disability, is shown in table 5. The data there, however, unlike the data in tables 3 and 4, exclude cases where only medical benefits were paid and represents com- pensable cases for a given year rather than beneficiaries receiving benefits in a year. The proportions of bene- ficiaries and of total benefits paid, by disability classi- fication, have shown some changes over the years. Notably, relative declines have occurred in the number of cases and amount paid for temporary total disability, along with a rise in payments and cases involving permanent partial disability.
The downward trend in the proportions of cases and aggregate benefits for temporary total disability, evident from 1939 to 1970, showed some “turn around” by 1974. Major improvements in statutory formulas (in- cluding maximum weekly amounts payable) during the early 1970’s must have had a greater effect on compen- sation for this type of disability than for the other categories shown in table 5. The reductions made by 14 States during the period 1969-73 in waiting-period requirements and/or in the retroactive period for which the waiting-period benefits are payable are examples of the changes that would have had greater relative impact on both the number of cases and aggregate amounts paid for temporary disability than for other cases. Table 5 also shows the high share of benefits paid for per- manent partial disability cases (63 percent in 1974), compared with the share of temporary total disability cases (24 percent).
Total Benefits in Relation to Payroll
One measure of the year-to-year performance of workers’ compensation programs is the total amount of benefits paid as a proportion of covered payroll, shown in table 6 for the period 1940-76. The benefit/payroll ratio grew slowly and irregularly from the end of World War II through the 1960’s. As a result of the wave of benefit improvements in the 1970’s, the ratio grew steadily from 1970 to 1976, with the largest increases occurring in the 4 latest years. From 1948 to 1969 the ratio grew by only 11 percentage points. During the next 7 years, however, it grew by 25 points, including a 19-point rise from 1972 to 1976.
Among the factors influencing the benefit/payroll ratio is the rate of and seriousness of job-related injuries. The number of lost workday cases in manu- facturing and in all private nonfarm industry has been about the same since 1972 when the Bureau of Labor Statistics began its current series. The average number of lost workdays per case, however, has increased somewhat over this period. It is likely that some part of the recent rise in the benefit/payroll ratio reflects
Table S.-Percentage distribution of compensable cases and of aggregate cash benefits (incurred loss), and average benefit, by disability classification, selected policy years, 1939-74 l
Policy year
1939 ... 1954 ... 1966. ... 1970 ... 1974 ...
1939 ... 1954 ... 1966. ... 1970 ... 1974 ...
1939 ... 1954 ... 1966 ... 1970 ... 1974 ...
Total Percentage distribution I Disability Number Amount
(in thousands) (in millions)
Total Death
Permanent total s
-
-
Permanent partial Major 3 Minor ’
Tey$w
Compensable cases K
365.0 ... 100.0 1.0 0.1 1.8 12.1 85.0 632.1 ... 100.0
843.0 ... 100.0 :; :t El 23.2 24.1 73.3 71.8 896.3 ... 100.0
:56 : :. ::: 22.6 71.4
1,030.7 ... 100.0 20.7 74.5
Cash benefit payments ,...
.,... .,...
$84.0 236. : 1,263:1 1,788.8
100.0 16.2 3.9 22.3 26.2 31.4
100.0 11.5 20.7 36.8 29.1
100.0 11.1 5:: 23.9 38.1 24.9 100.0 10.6
::“6
33.9 31.4 21.2
100.0 9.7 31.4 31.3 24.1
Average benefit per compensable case
,...,... . . . . . . . . $3,873 $500 $85 . ..t... 9,207 iv::
28’ 128
$:I ;:;
7’832 986 247
,...,... . . 15,869 1,659
,_...,.,.... . . . . . . . . . . 23,077 28’914 ,,.,__.,... . . . . . . . . 32,204 37:544
9’070
13:327 2,627 1,961 2243 518 1 Excludes cases receiving medical benefits only. Data for individual
policy years not strictly comparable because of shift in States included and in definition of policy year.
* Disability rate at 75-100 percent of total.
8 Disability with severity equal to about 25-75 percent of total. * Disability with severity equal to less than 25 percent of total. 5 For permanent injury cases includes, in addition to compensation
the trend toward longer spells of disability per dis- abled worker.
Chart 2 shows benefit/payroll ratio groupings for each State. A total of 16 States had ratios of at least 1 percent, including five in the 0.90-1.09-percent cate- gory-Alaska, Idaho, Michigan, Ohio, and New Mexico. States in the Southwest and in the Pacific Northwest tended to have higher ratios than those in other sections.
A diversity of factors probably contributes to the level of the benefit/payroll ratio. The upward trend in the severity of work injuries has been noted. The ratio may also be affected by: (1) The level and dis- tribution of wages and the size of the group at risk, (2) regional differences in cost and accessibility of medical care, and (3) administrative and legal proced- ures and policies used in evaluating, adjudicating, and policing claims.
Temporary
Total Disability Benefits
Perhaps the most dramatic improvements in the history of workers’ compensation programs occurred as
for loss of earning power, payments during periods of temporary dis- ability. For temporary disability cases, includes only closed cases known not to have involved any permanent Injury and open cases in which, in the carrier’s judgment, the disability will be only temporary.
Source: Unpublished data from the National Council on Compensa- tion Insurance.
a result of State legislation enacted from 1970 to 1975. Among the most important of these amendments were those that increased the proportion of wages to be re- placed by workers’ compensation benefits and that raised the maximum weekly benefit amounts. Both types of changes had immediate and widespread effects on the adequacy of benefit payments. The effects of these changes are reviewed here for temporary total disability -the type involved in three-fourths of the cases in a year.
By the end of 1977, all States but Florida, Idaho, and Washington had specified a statutory wage-replace- ment rate requiring that workers’ compensation benefits replace two-thirds of a worker’s average weekly wage for cases involving temporary total disability. Only Iowa differed from the two-thirds formula, adopting a formula that set the replacement rate at 80 percent of a worker’s spendable earnings. A replacement rate of two-thirds is the level specified by the 1972 Na- tional Commission on State Workmen’s Compensation Laws as one of its 19 essential recommendations. In 1973-only 4 years earlier-13 States still had replace-
Table 6.-Aggregate benefits as percent of payrolls in covered employment and occupational disability inci- dence rates in manufacturing and in nonfarm private industry, selected years, 1940-76 l
Year 1 1
--
1940.. 0.72 15.3 1946.. .54 19.9 1948... .51 17.2 1949.. .55 14.5 1950.. .54 14.7 1951... .54 15.5 1952... .55 14.3 1953... .55 13.4 1954.. .57 11.5 1955... .55 12.1 1956.. .55 12.0 1957.. .56 11.4 1958... .58 6 11.4 1959... .58 12.4
i960.. .59
1961. .61 1962.. .62
1963... .62
1964.. .63
1965... .61
1966. .61 1967... .63
1968... .62
1969... .62
12.0 11.8 :t-; 12:3 12.8 13.6 14.0 14.0 14.8 1970... .66
1971... .67
1972... .68
1973... .70
1974.. .75
1975... .83 1976. .87
15.2 6 4.3 t:: t.: 4:6 Benefits as
aercent of payroll s
Manufacturing, Nonfarm private average number industry, average
of- number of- -
Lost workday
cases s
Lost workdays
per lost workday
case
i Before 1959, excludes Alaska and Hawaii.
s Excludes benefits financed from general funds, primarily the Federal black lung benefits program.
s Per 100 full-time workers, beginning 1971. Data for 1940-70 are the average number of disabling work injuries per million employee-hours worked.
’ Data not available. Before 1971, series for manufacturing related days lost to hours worked among all workers.
s Beginning 1958. series based on revised Standard Industrial Classi- fication Manual. Comparable 1958 figure under earlier series was 10.8.
6 Data for July-December.
Source: Work-injury rates derived from published and unpublished data of the Bureau of Labor Statistics.
ment rates below the recommended two-thirds. At the end of 1969, before the flurry of legislative activity in the early 1970’s began, 23 States had wage-replacement rates below the two-thirds level. In a few of these States, however, the rate was as close as 65 percent to that level.
The legislated wage-replacement rate is only one factor that determines the actual wage replacement received by a disabled worker. Often workers’ com- pensation recipients do not receive benefits equal to the statutory replacement rate because of restrictions im- posed by dollar maximums on weekly benefit amounts. In 13 States at the end of 1977, workers earning an
amount equal to the State average weekly wage could not be paid a workers’ compensation benefit equal to two-thirds of their wages because such a benefit would have exceeded the allowable weekly maximum.
Even so, in the 1970’s extraordinary improvement in liberalizing maximum benefit provisions was seen. As recently as December 1969, in 46 States the maxi- mum benefit provisions prevented disabled workers with average weekly earnings equal to the State average from receiving a benefit that would produce the legis- lated replacement rate. In the 4 years from 1973 to 1977, however, State maximum weekly benefits for temporary total disability rose an average of 84 per- cent. During this period, in all but two States the allow- able weekly maximum rose at least 25 percent. Tn- creases in the preceding 4 years were more modest. Ten States showed rises in the weekly maximum amount of less than 25 percent.
A major legislative advance in recent years has been the establishment of “flexible” maximum provisions. Flexible maximums provide for the automatic adjust- ment of the ceiling on the weekly benefit amount- commonly a specified proportion of the State average weekly wage for workers covered by the unemployment insurance program. By the end of 1977, 42 States had enacted flexible maximum provisions, usually setting the maximum benefit at 100 percent of the State average wage.
The trend in wage-replacement rates is illustrated by the data on the number of jurisdictions in which work- ers at the average wage receive benefits equal to at least 65 percent of their wages, if temporarily disabled from work-related disability, and on the proportion of work- ers with that replacement rate. After many years in which the proportion of workers with a 65-percent re- placement rate remained low and stable (less than 10 percent)-as did the number of States providing for such a rate-a sharp upward trend became evident in the 1970’s. Thirty-five States, with 64 percent of the covered workers, provided a weekly benefit replacing at least 65 percent of wages in 1977 (and also met the National Commission recommendation for two- thirds replacement).
The ratio of workers’ compensation weekly benefits for a temporarily disabled worker is shown, by State, in the left panel of chart 3. The average wage replace- ment rate for all States was 62 percent at the end of
1977. This average was derived from individual State replacement rates, weighted by covered employment under the workers’ compensation program in each State. The average weekly benefit amount that corresponds to the 62-percent replacement rate was $128.
Dependents’ allowances. At the end of 1977, 11 States provided supplementary benefits for temporary total
Chart 2.-Total benefits as a percent of payrolls in covereed employment, by jurisdiction, 1976
disability to workers with dependents, six fewer than in 1969.1° (Eleven States also offered such allowances for permanent total disability but not the same States in all instances.) The effect of maximum dependents’ allowances on the national average replacement rate was modest but noticeable. When dependents’ allow- ances were included, the national average wage replace- ment was 64 percent-the equivalent of a $133 weekly benefit.
For workers in States with dependents’ allowances the average weekly benefit amount at the end of 1977 for single workers at the average wage was $143; for workers with the maximum number of dependents the average weekly benefit was $177. The following tabula- tion gives the wage-replacement rates for these figures.
1 Percent of wages in States- Type of benefit for- With Without
dependents’ dependents’ allowances allowances Single worker. .
Worker with maximum number of dependents. . .
62 62
lo One other State, Illinois, provided dependents’ allowances but only for low-paid workers.
As in previous years, the benefit for a single worker is about the same whether or not the State provides de- pendents’ allowances. Nevertheless, the rates have im- proved considerably-with all of them rising 10-l 1 points above the 1969 rates.
Chart 3 shows no particular replacement-rate pattern for States with dependents’ allowances. The absence of such allowances in the Southern States is clear. In the 1950’s and 1960’s, some concentration of dependents’ allowances was apparent among States with wage- replacement rates at the lower end of the range, sug- gesting that these allowances may have been used to supplement a lower-than-average workers’ compensa- tion benefit.
Waiting periods. Another important factor affecting the true wage-replacement rate achieved by workers’ compensation benefits is the duration of disability. State laws typically provide a cash indemnity benefit only after the worker has been disabled 3 or 7 days. (A few States have 2- or 5-day waiting periods.) If the worker is out of work for a specified total number of days (ranging from 5 to 42), payment is made retroactively for the waiting period. The average weekly replace- ment rate is therefore very much affected by these waiting-period provisions and the overall duration of disability.
Waiting-period provisions have tended to be stable Social Security Bulletin, May 1979/Vol. 42, No. 5 13
Chart 3.-Measures of interstate variation: Weekly benefit payable for temporary total disability as a percent of average weekly wage, 1976, and percent of lost wages replaced for worker with 1976 average weekly wage for temporary total disability lasting 3 weeks, December 1977 1
Ratio of weekly/benefit to average weekly wages Percent of lost wages replaced for 3 weeks disability
80 80 40 20 0 0 20 40 80 80
Iowa Alabama
Alaska Arizona California
Colorado Connecticut
Delaware District of Columbia Federal Employees
Hawaii Illinois 2
Kansas Maine Maryland Massachusetts
Minnesota Montana Nebraska Nevada New Hampshire
New Jersey New Mexico North Carolina
North Dakota Ohio Oregon Pennsylvania Rhode Island South Carolina South Dakota
Utah Vermont 3
Virginia West Virginia
Wisconsin Wyoming Florida Washington
Indiana Tennessee Mississippi Kentucky New York
Idaho Michigan
Georgia Arkansas Louisiana Missouri Texas Oklahoma
m Basic benefit X-X-X Supplementary allowance for dependents 1 Maximum weekly benefit for worker with and without
eligible dependents under laws paying dependents’ allowances; ? Dependents’ allowances provided, but maximum same for average wage for workers covered by unemployment insurance dependents. workers earning average wage whether or not they have program or the wage used by a State for determining its
maximum weekly benefit where different. 3 Assumes 3 dependents.
throughout the history of workers’ compensation pro- riods. Yet, at the end of 1977, fewer than half the grams. Only two liberalizations in waiting-period re- States had met the recommendation of the National quirements were made from 1961 to 1969. From 1969 Commission for a maximum waiting period of 3 days. to 1977, however, 10 States reduced their waiting pe- From 1969 to 1977, significant improvements were
also made in the number of days of disability required before retroactive payments could be made for a wait- ing period. Again, fewer than half the States met the National Commission’s goal of a retroactive-payment provision that requires no more than 14 days of disa- bility.
Eight States at the end of 1977 still required a worker to be disabled at least 4 weeks before the retro- active payment of waiting-period benefits. Legislative activity in this area came nearly to a halt after 1975 and has since been limited to the waiting-period lib- eralizations in Iowa, Kansas, and Oklahoma and to Virginia’s reduction of its days-of-disability require- ment before retroactive waiting-period benefits.
The gross average weekly wage was the starting point, and appropriate Federal income-tax withholding deductions and social security contributions were as- sumed for the specified family with a standard, per- sonal deduction. It was also assumed that the family had no unearned income. No attempt was made to account for insurance contributions, union dues or other voluntary deductions from pay. The estimates do not readily lend themselves to subtraction of State and local government income taxes withheld, because of the wide variability of rates and the lack of applicability to workers in some States. The data, with one illustra- tive exception, therefore do not take State and local government taxes into account.
The right panel of chart 3 shows average wage- replacement rates, by State, for a worker with a tem- porary total disability lasting 3 weeks. This period matches survey data published by the Bureau of Labor Statistics indicating that, for the private sector in 1976, the average occupational injury and illness resulted in 17 lost workdays-at least 21 calendar days.”
The national average wage-replacement rate for a worker disabled for 3 weeks was 58 percent for those with no dependents and 60 percent for those with the maximum dependents’ allowance. As with most other measures of benefit adequacy explored thus far, these rates represent a considerable improvement over earlier years. At the end of 1969, the corresponding replace- ment rates were 44 percent and 48 percent, respectively.
A worker with no dependents earning the nation- wide average weekly wage of $207 in 1976 would have paid $29 in Federal income tax each week and $12 in social security contributions, with a take-home pay of $166. The average workers’ compensation benefit of $128 for such a worker would therefore replace 77 percent of his take-home pay. This ratio differed little for single workers whether they were in the 11 States with dependents’ allowances (78 percent) or the 41 States without (77 percent). As the benefit-wage ratios based on these figures given below indicate, the ratios
-
Wage-replacement rate for- In 4 out of 5 States, the wage-replacement rate for
3 weeks of disability, with the effect of waiting-period and retroactive waiting-period-pay provisions taken into account, did not differ from the overall wage- replacement rate. This similarity of the rates by the end of 1977, reflects the fact that 41 States paid retro- active benefits for waiting periods after 21 or fewer days of disability. As a result of the combined effects of waiting periods, retroactive pay provisions, and limi- tations in maximum weekly amounts, however, only 31 States (with 45 percent of covered workers) provided a worker disabled for 3 weeks with a benefit equal to two-thirds of wages.
Year
Worker, wife, and two children, XI jurisdictions- Single
worker With dependents’
allowances
Without dependents’
allowances 1969 ...
1973 ... 1977 ...
-.
-
76: 2
77 83 71
Fit
for workers with a wife and two children in jurisdic- tions with and without dependents’ allowances differed substantially.Net wage-replacement rate. Another way of evaluat- ing the benefit/wage replacement rate for temporary total disability is to relate weekly benefits to estimated net earnings. This evaluation provides a closer approxi- mation of the value of the benefit in relation to money actually available to the worker and his family. The average weekly wages of a single worker and a worker with a wife and two dependents were used for this analysis. For both examples, data were compiled in accordance with whether or not the worker lived in a jurisdiction that provided dependents’ allowances.
The tabulation above also points up the improve- ment in wage-replacement rates from 1969 to 1977. The increases shown actually understate the improvement because the rates were artificially raised to some extent by the Federal income surtax in 1968 that temporarily reduced the level of take-home pay. In addition, the general tax credit in 1976 temporarily revised the level of take-home pay and so reduced replacement rates for 1977.
In order to offer insight into the approximate effect of deducting State income tax from weekly earnings, an estimated weekly average State tax rate for the Nation for a single worker was computed as $5.12 11U.S. Departmerit of Labor, News Release 77-1031, De- 12 This estimate is based on methodology developed in the cember 1, 1977. Office of the Actuary, Social Security Administration.
Subtracting the amount produces a $161 average net weekly wage, with an go-percent wage replacement rather than the 77 percent without taking State income tax into account.
Permanent Disability
and Death Benefits
Job-related injury or disease that results in permanent disability or death accounts for a relatively small num- ber of workers’ compensation cases but represents the major part of all benefits. In 1974, such cases accounted for about one-fourth of the private insurance caseload but for three-fourths of the benefit payments. As for temporary disability benefits, considerable improve- ments were made during the 1970’s in the benefits pay- able for these cases. Statutory wage-replacement rates and maximum weekly benefits are sometimes lower for permanent disability and death cases, however, than they are for temporary disability cases. Nevertheless, the preceding analysis of benefit/wage ratibs for tem- porary disability can be applied to the permanent dis- ability and death cases if it is recognized that waiting periods result in a lower proportionate loss of benefits when permanent disability or death are involved.
Benefit inequities are more likely to arise in perma- nent disability cases, regardless of the adequacy of the statutory provisions. The difficulty of correctly assessing the extent of long-term disability makes for benefit awards that sometimes are too low (or too high). Work- ers may, for example, be rated as partially disabled under workers’ compensation but subsequently certified as totally disabled under the social security program.13 Another important measure of the adequacy of State provisions for permanent disability and death cases is the duration of benefits. A severe limitation in perma- nent disability cases is the expiration of benefit entitle- ment, even though the disability and resultant income loss continue. At the end of 1977, 11 States still re- stricted permanent disability benefits through a maxi- mum in the number of weeks for which benefits could be paid or through a ceiling on dollar payments. The present number of States with such restrictions is fewer than the 19 in 1969 but still represents an important defect in the workers’ compensation system as a whole.
Time or dollar restrictions on benefit payments were even more prevalent in the area of survivor benefits, At the end of 1977, one-third (18) of the States had such limitations on survivor benefits. The duration of sur- vivor benefits was generally restricted to 10 years, although Illinois permitted the payment of benefits for the greater of 20 years or $25,000. Dollar maximums on survivor payments ranged from $14,000 to $60,000.
13 See Wayne Vroman, Work Injuries and Wage Losses for Partially Disabled Workers (paper presented at the Industrial Relations Association meeting, September 18, 1976).
Despite the continued existence of time and dollar restrictions in these 18 States, especially dramatic progress was made in eliminating such limits in the 1970’s. From 1969 to 1977, 21 States removed the restrictions on widows’ benefits with respect to duration or the aggregate amount payable or both. Nevertheless, the substantial extent of survivor benefit restrictions still in effect reinforce the concerns of Congress and the Executive branch that workers’ compensation programs do not provide complete protection from job-related income loss.
An important consideration in evaluating the ade- quacy of benefits for permanent disability or death is whether benefits are adjusted periodically to keep pace with rises in wage levels and to offset the effects of inflation. These adjustments are particularly im- portant for workers who become disabled at younger ages and who are on the benefit rolls for an extended period of time. For such individuals, benefits become less adequate over the years as prevailing wages and prices rise. Furthermore, the wages upon which their benefits are based do not reflect increases that would have occurred if they had continued in the labor force and gained experience, skill, and seniority.
A number of States have raised benefits from time to time for those already on the rolls. In Utah, for example, to bring total weekly payments for perma- nently and totally disabled beneficiaries to $60 (when combined with employer or insurance carrier compen- sation), increases were granted from a special State fund. Utah raised these benefits again (to $75) in 1977. New York and North Carolina also provided one-time increases in 1977.
Provisions. that raise benefits automatically are a more desirable means of keeping benefits that are pay- able for long periods from deteriorating as a result of inflation. At the end of 1977, more than 12 jurisdictions had such provisions. Changes in wages or prices were usually used to determine the amount of benefit adjust- ments. Several States enacted automatic adjustment provisions during the 1970’s, adding to the seven States with such provisions in effect in 1972. Alaska repealed its automatic adjustment provision in 1977, however, and Oregon reduced the scope of its provision by limit- ing it to beneficiaries on the rolls before April 1974. The adverse impact of inflation on workers’ compensation benefits of long duration remains an unresolved prob- lem for most State programs.
costs
The total cost of workers’ compensation to employers is made up of several elements. In addition to benefit costs, commonly termed “pure premium,” there are the
![Table 2.-Estimated average monthly number of wage and salary workers covered by workers’ compensation, 1973 and 1976 [In thousands] State - -- 1973 1976 Total](https://thumb-us.123doks.com/thumbv2/123dok_us/8569677.2321167/4.889.78.443.127.824/estimated-average-monthly-workers-covered-workers-compensation-thousands.webp)

![Table 4.-Benefit payments, by type, 1939-76 I [In millions] Year Total 1939.....](https://thumb-us.123doks.com/thumbv2/123dok_us/8569677.2321167/8.889.72.436.87.701/table-benefit-payments-type-in-millions-year-total.webp)