W W W . Z J O U R N A L . C O M O C t O b e R / N O v e M b e R 2 0 0 9 t h e R e s O U R C e f O R U s e R s O f I b M M A I N f R A M e s y s t e M s
Leveraging New Workloads on IBM’s Specialty Processors
Saving Software Costs With Group Capacity Limits
New Best Practices for z/OS Storage Performance Management
Tuning VSAM CI Size and Free Space
I N S I D E
Leveraging New Workloads on IBM’s Specialty Processors
Saving Software Costs With Group Capacity Limits
New Best Practices for z/OS Storage Performance Management
Tuning VSAM CI Size and Free Space
I N S I D E
W h e r e , W h e N , A N D h O W T O D e P L O y
S
torage Performance Management (SPM) is emerging as a distinct, important discipline in the scope of z/OS operations because of architec-tural changes in the I/O infrastructure in recent years. The growing impor-tance of SPM is due to the three key benefits it can simultaneously pro-vide—lower costs, improved availabili-ty, and simplified storage technology management.Usually, an improvement in one of these areas brings a trade-off in the other areas. For example, better avail-ability often comes at a higher cost or increased complexity. By implement-ing the SPM best practices discussed here, you can improve all three areas— and this article will reveal how some of the world’s largest data centers have done so.
Definition of Storage Performance Management
SPM is the process of ensuring applications constantly receive the
required performance service levels from storage hardware resources and that storage assets are efficiently used. Effective SPM must be proactive, iden-tifying and addressing bottlenecks before service level disruptions occur. This requires analyzing the current and historical utilization levels of inter-nal components in the storage system. It also requires insight into and control over how well the workloads are bal-anced across those resources, and visi-bility into which of the many storage hardware options would be the best candidates for handling expected changes in those workloads.
SRM vs. SPM
How does Storage Performance Management (SPM) differ from Storage Resource Management (SRM), which has been around for many years? SRM primarily focuses on the issues storage administrators deal with: space utilization, allocation, policies, etc. SRM provides significant benefits
that enable more efficient use of stor-age space.
SPM provides better utilization of storage resources from a performance perspective, taking into account response times and throughput rather than focusing on space utilization. This includes methodologies to avoid I/O performance problems. Proper SPM enables significant savings on new stor-age hardware while enabling existing hardware to provide acceptable response times for longer periods. These areas typically concern performance and stor-age engineering team members, rather than storage administrators.
SPM and SRM fit closely together. SRM is useful for achieving higher space utilization. However, higher space utili-zation could introduce unwanted delays without using SPM to validate that the storage system and disk arrays can man-age the higher throughput required with higher space utilization levels. In that sense, SPM is key to being able to achieve the full benefits of SRM.
By
Gilbert Houtekamer, Ph.D.
& Brent Phillips
New
Best Practices
for z/OS Storage
Performance
Management
SPM Lowers the Cost of Storage
Using storage performance manage-ment best practices can yield a substantial ROI. Data centers spend too much money on storage. By using these methodolo-gies, one of the largest banks in the U.S. documented 34 percent savings in a sin-gle storage hardware technology refresh without negative consequences to perfor-mance service levels. Savings in this range are realistic and being achieved.
Planning hardware upgrades is an area ripe for large savings. SPM best practices will help you choose the most efficient storage configuration that will deliver the performance your workloads require. You have even less risk of per-formance disruptions with a rightsized, customized configuration than with an oversized, more expensive configura-tion that wasn’t selected to account spe-cifically for exact characteristics of your workloads.
A common assumption is that imple-menting tiers of storage requires a busi-ness decision about which applications can live with slow response times, but that’s not necessarily true. The new SPM best practices help distinguish workload categories based on how active the workload data is from a hardware per-spective rather than which applications are more “loved.” This approach can ensure good performance and eliminate overspending. Using measured work-load characteristics to select the storage hardware tier will deliver the perfor-mance each workload requires.
Significant savings also can be achieved by increasing the throughput capabilities of existing storage hard-ware—by achieving better balance of workloads, for example, across the avail-able hardware resources.
Why Is SPM Emerging Now?
Before discussing SPM best practices, let’s consider why, for a platform as robust as z/OS, a strategic part of the infrastructure is so complex to manage. The evolution of the I/O architecture on z/OS platforms sheds light on the answer.
A decade ago, I/O used to be con-strained on the host side. But advances in both the internals of the storage sys-tem and features on the host side greatly improved the architecture by largely removing any queuing from the host side. For example, Parallel Access Volumes (PAVs), Multiple Allegiance (MA), and Fibre Connectivity (FICON) are all multi-plexing technologies. They “open up the pipe” from the host
per-spective and allow the host-based I/O services to send the requests down to the storage systems without worrying about them. Today, it’s now largely up to the storage system to manage the queu-ing.
There’s the issue. Storage appears largely like a “black box” to z/OS. Architectural advances have greatly improved things, but also made it diffi-cult to measure performance from the host side, as the new bottlenecks simply aren’t visible to the host software or even to the channel subsystem. So there’s little or no visibility into the stor-age systems on a daily basis despite all the pre-existing, host-based I/O perfor-mance-reporting capabilities. Instead of the host-centric I/O performance man-agement, what’s needed with today’s architectures is storage-system-centric performance management. Storage sys-tems themselves are now large and com-plex and need to be managed accordingly.
SPM Best Practices
Best practices that achieve the desired benefits of SPM require new metrics and methodologies and can be grouped into eight functional objectives:
1. The right metrics: Use the right storage-centric metrics for today’s architectures.
2. Contextual interpretation: Interpret the metrics using the appropriate context.
3. Proactive evasion: Automatically run daily health checks to identify issues in the making.
4. Simplified diagnosis: Simplify investigations into root causes of performance degradation.
5. Imbalance identification: Address imbalance rather than add hard-ware.
6. Smart placement: Calculate optimal volume placement on hardware resources.
7. Analyze trends: Understand work-load performance characteristics over time in multiple dimensions.
8. Predict performance: Model the impact of workload and hardware changes.
The Right Metrics
As any systems professional will tell you, “If you can’t measure it, you can’t manage it.” So, any type of IT resource management starts with measurements. Unfortunately, the standard mea-surement tools such as System Management Facility (SMF) and Resource Measurement Facility (RMF) don’t measure all the values needed for proper storage performance manage-ment. While the z/OS platform is mature, specific metrics that are
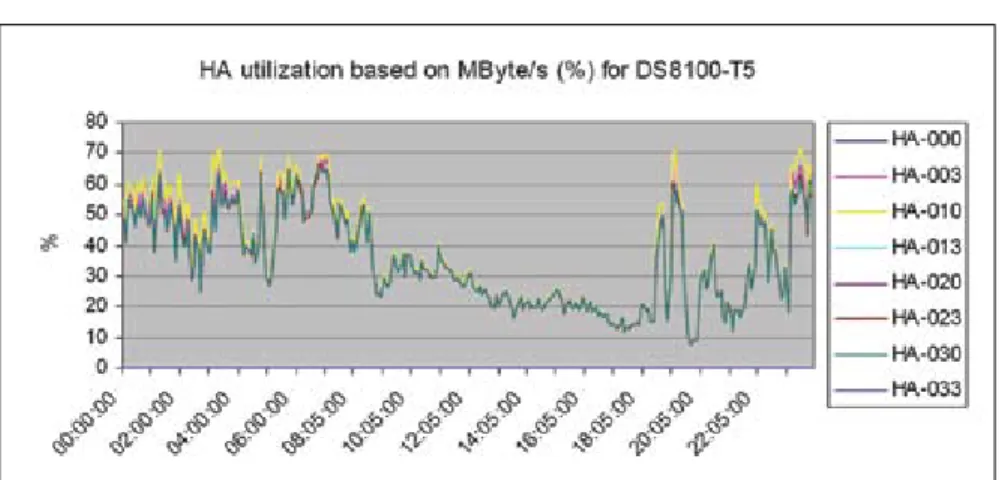
Figure 1: A Storage System Where the Host Adapters Are Too Busy
Host adapter utilization is an important metric for disk storage system performance.
required to manage storage perfor-mance are absent and/or difficult to deduce. The z/OS measurements are host-centric and provide little direct visibility into what’s going on inside the storage systems.
Most sites have performance tools or in-house written code to process RMF and SMF data and report on aspects of I/O performance, such as response time and its subcomponents, as seen by the hosts. But response times are only a symptom and indicate little about root causes of storage infrastructure issues. Furthermore, some of the standard met-rics, such as disconnect time, for exam-ple, have changed meanings. Disconnect time should be broken down into three components: 1) waiting for disk in case of read miss, 2) waiting for replication in case of a write, and 3) internal processing and queuing delays in the storage system. These values are so different, they should be reported separately so they can be individually monitored and understood. Even more important are metrics that provide visibility into the two most common performance bottlenecks. Performance bottlenecks related to I/O are almost always inside the storage sys-tem and aren’t reported in the native RMF data.
The first bottleneck is at the front-end of the storage system, where the FICON channels attach to the host adapters or front-end directors. Channel busy reports on the host are easily avail-able, but these provide visibility only into channels on the Logical Partition (LPAR) side, not the storage system side. Because the storage system is most often shared between multiple LPARs, and because host ports tend to be more powerful, it isn’t uncommon to have the host channel busy reports in only the 20 percent busy range while the front-end of the storage system can’t keep up. What’s needed is a metric to monitor, on a daily basis, the host adapter utiliza-tion levels. This allows utilizautiliza-tion levels to be addressed before they become critical and introduce delays to the pro-duction workloads.
Unfortunately, host adapter utiliza-tion isn’t natively reported in RMF, but it can be estimated from available met-rics. For most workloads, the determin-ing factor for host adapter utilization is the throughput. A particular host adapt-er can handle only a cadapt-ertain numbadapt-er of megabytes per second. Writes require more resources than reads because information needs to be written to two caches, as well as to a remote storage
system if replication is involved. So, writes need to be counted two (without replication) or three (with replication) times. Figure 1 presents a chart showing this essential metric. Values over 60 per-cent start to give performance degrada-tion; over 80 percent performance will be unacceptable.
A different internal bottleneck is at the back-end of the storage system, on the actual physical disk drives grouped into Redundant Array of Inexpensive Disks (RAID) array groups. A common but incorrect perception is that with today’s cache and read/write hit ratios, the back-end doesn’t matter much. Actually, every type of I/O except one (a random read hit) uses the back-end at one time or another. Those requests must be staged to or destaged from cache and that creates back-end activity. The activity level on the physical disk drives, expressed as a “back-end access density,” is an important workload char-acteristic. While this isn’t available directly from RMF, it can be derived from RMF using the cache statistics and RAID type. The cache statistics tell us how many random and sequential reads and writes occur, how many hits, etc. The configuration data will tell us what RAID type is used. For example, with a RAID 5 scheme, a random write opera-tion requires four back-end I/Os, while a random read operation requires only one. The data’s I/O activity can then be correlated with the capabilities of the disk drives in question to identify per-formance issues.
In summary, it isn’t enough to use standard measured values. The mea-surements need to be combined and intelligence needs to be added to pro-vide a true view of how the storage sys-tem is doing. A combination of data interpretation, modeling and statistical analysis is required to derive the essen-tial key metrics of storage performance. Contextual Interpretation
SPM in z/OS is complex because there are no simple rules of thumb to identify what’s good or bad. For exam-ple, a disconnect time of 2 ms would be excellent for a DB2 workload with remote mirroring active, but quite bad for a z/OS system pack. Having the right metrics for monitoring isn’t enough; the data needs to be combined with workload characteristics.
Measurements also should be inter-preted in another dimension—in the context of the capabilities of the hard-ware components they’re running on.
For instance, certain values for response times may be excellent levels of perfor-mance on older generations of certain hardware components, but may indicate a potential problem on newer versions of the same type of hardware components. Automated rules should be defined for each metric such that values are shown together with an interpretation of whether the value that’s reported is good or bad in the workload and hard-ware context. This enables the analyst to properly interpret the data instead of just looking at a list of numbers. Proactive Evasion
Phone calls, email messages, and support cases from the help desk remain common ways of discovering a perfor-mance issue that needs to be addressed. But instead of reacting to I/O perfor-mance incidents after they’re reported by application users or other system management tools when they detect already severe symptoms, storage health should be proactively managed so prob-lems in the making are spotted before they reach critical utilization levels and cause spikes in response times. Performance issues affect production application users and consume time and energy from staff members tasked with diagnosing and resolving the situation. Service levels will be significantly improved by avoiding I/O performance disruptions. It’s also less stressful, faster, and easier to address problems early than deal with them in crisis mode. This proactive problem avoidance is most effectively obtained with a dash-board type of technology (see Figure 2). Such a dashboard needs to include hardware-specific thresholds for the rel-evant metrics, so warning levels are automatically flagged and can be easily and quickly investigated. In this exam-ple, color and size indicate issue severi-ty—so small and green are good while large and red are bad. Often, the most informative color is yellow because this indicates proximity to critical thresh-olds and can be used to avoid moving to the more painful red status. The size of the blue bubbles in this example indi-cates how many I/Os are occurring. I/O rate isn’t a metric where a good or bad rating applies, so blue is used as a neu-tral color.
This best practice, when effectively implemented, will result in most I/O performance issues being addressed early, with minimal time and stress and before production users experience any slowdown. It will eliminate nearly all
real-time firefighting of I/O perfor-mance problems. If this saves your orga-nization even one or two painful service level violations per year, that alone could pay for the SPM effort.
Simplified Diagnosis
When I/O performance issues are discovered, it’s important to be able to quickly and easily investigate what caused them. All the right metrics from all the right time intervals need to be readily available and easily accessible. IT staff is too busy to do the custom coding and data manipulation that would be required to diagnose issues that are going on or to wait for vendor personnel to come and solve the prob-lem. Maintaining fast access to produc-tion data is too important to go through what’s often several days or weeks to diagnose the cause of storage perfor-mance issues.
When all storage performance met-rics are available in a repository, root cause analysis can be achieved with intelligent drill-down options into any dimension of the performance data, such as drill-down to an array group, an individual volume, or to the data set level. All relevant performance metrics should be available on the different lev-els and historical data should be present to find the cause and solution of the I/O performance incident.
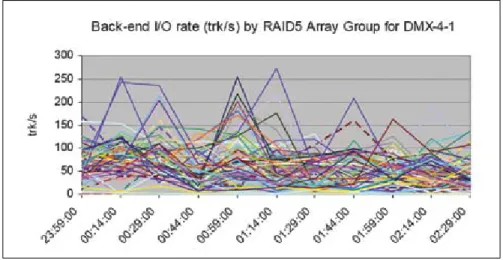
Figure 3 shows an example from an installation that had performance issues on their disk system. The root cause became clear only after a performance report per array group became available as part of an SPM effort. The problem they were experiencing was high response times on a small subset of their volumes. This chart made it clear that the problematic volumes were all on the active array groups, which are represented by those lines above the 150 tracks/sec level.
Disk drives in their configuration could comfortably handle 100 tracks per second, but 150 tracks per second or higher introduced significant delays. The chart shows that most array groups in the configuration were healthy, and clearly pointed out those with data that had higher back-end access density requirements than the physical spindles could keep up with. The solution was to distribute the vol-umes with the high back-end access density requirements across more array groups.
This best practice will accelerate understanding of what the issue is and
how to address it. It will also reduce the need to call in external hardware ven-dor expertise because there’s much bet-ter understanding of the storage configuration. These SPM methodolo-gies can immediately pinpoint problems that customers and vendors may have been working on for a long time. Imbalance Identification
The key to realizing both optimal performance and cost savings is using all the capabilities of the storage hard-ware you paid for, which can be achieved by optimizing the balance of workloads across the available hard-ware resources. Often, when response times spike to unacceptable levels, the first reaction may be to think about buying additional hardware. An impor-tant question is whether there are other underutilized hardware resources avail-able that could handle the workloads if distributed differently.
What’s needed to properly manage storage performance vs. storage cost is a
way to easily monitor how well all the components are used at the deepest lev-els in the storage system. Then the most loaded resource can be identified and addressed before it creates an impact on production workloads. The solution is either creating better balance across available hardware resources or adding resources if the current configuration is fully utilized. This requires visibility into the busy resources and availability levels of other resources that can appro-priately handle the workload.
Imbalance also can occur over time as Figure 4 shows. Here, the batch peri-od created spikes of I/O activity. If the activity were spread out over time, a more cost-efficient configuration with fewer disk drives would be able to han-dle the same workload with the same or better performance.
By following workload characteris-tics over time, it’s possible to regularly mark the “10 most effective moves” that would result in better throughput with-out adding new hardware. This way,
Figure 3: Large DMX-4 Storage System
Here, a small number of RAID 5 arrays are overloaded, causing application performance issues.
Figure 4: Physical Disk Drive Activity Over a 24-Hour Period
By rescheduling some of the batch work, it may be possible to get significantly lower peak values, potentially enabling the use of 300GB instead of 146GB physical drives.
small tuning efforts can keep the sys-tems healthy with minimal effort. Smart Placement
Identifying and addressing an imbal-ance that occurs in an existing environ-ment is important. The smart placeenviron-ment best practice addresses a similar issue but in a different context: when migrat-ing large groups of data to new loca-tions, either to new hardware or to larger logical volumes.
Significant performance and hard-ware cost savings can be realized by analyzing over many time intervals the back-end access characteristics of the data to be migrated. Such an analysis can enable each volume to be placed on RAID groups of the most appropriate disk drive device types so device use is maximized. This is the only way to ensure, for example, that larger, cheaper drives aren’t overwhelmed with too much active data or that smaller, more expensive drives aren’t wasted with data that’s relatively inactive from a back-end perspective. It also eliminates creation of hot spots on the back-end of the tar-get hardware, which is always a risk when moving data.
This type of analysis requires calcu-lating many permutations for every time interval in the analysis to determine the optimal layout of all the data (e.g., vol-umes or storage groups) across the hardware devices. This creates knowl-edge about which storage resources can safely meet access requirements of the workloads.
This knowledge can be effectively used to implement tiers of storage with Systems Management Server (SMS), which is used to direct workloads to a particular set of logical volumes. Logical volumes are mapped to different array groups at storage system configuration time. Each array group (or rank) is made up of a particular type of physical drive. In this way, SMS is used to place the workloads onto the physical drives that provide the performance required. This type of placement will continue to become even more important because of how disk drive types are evolving and diverging. Spinning disks are getting larger but not spinning any faster. As more data is put on the drive, the aver-age back-end access density of the data per spindle increases. This problem will intensify as smaller drives, such as 73GB and 146GB, are removed from the mar-ket. Meanwhile, Solid-State Drive (SSD) flash drives are being installed for high-ly active data from a back-end
perspec-tive. So sites will be forced to either install the larger spinning disks and keep some of them lightly loaded with data, or implement multiple tiers of storage and move the highly active data to the flash technology.
Analyze Trends
There are significant benefits of keeping the right metrics in historical databases. When stored properly, this allows ad hoc reporting on the histori-cal data to be able to look at it in any dimension, or for any combination of variables, that may be required in the future. This is critical for understanding how your storage workloads for any particular application have been chang-ing over time so you have a good basis for understanding how you can expect them to change in the coming years. A historical database that allows flex-ible reporting also can assist in quickly diagnosing issues. One financial services organization experienced I/O perfor-mance degradation after a planned power outage in their data center. By analyzing the historical database, they were able to quickly spot where the difference was coming from and identify the configura-tion error that occurred when the stor-age hardware came back up.
In addition, organizations that are required to maintain specific Service Level Agreements (SLAs) for storage performance often require historical reporting to show SLA compliance. Metrics such as maximum response time over a prolonged period and 90th percentile levels can be used to set and report on SLAs.
Predict Performance
If you implement historical trending, you can better understand how the workloads for any particular application or all applications are expected to change. Next, you’ll want to determine how your current hardware configura-tions will handle that workload growth, when you’ll need to buy new hardware, and what specific hardware configura-tions, from any vendor, will provide the best throughput and performance for your money.
Enterprise storage hardware is expensive and any new hardware pur-chase should be the result of a thorough study that shows the best possible options for the workload. For optimal cost vs. performance, assets should nei-ther be over-configured, nor under-configured.
Often, data centers heavily rely on
advice from their storage vendors when buying hardware, rather than having an independent view into how their work-loads will perform on different configu-ration options. This often proves more expensive than necessary because it just feels better and safer for the customer and the vendor to over-configure. What’s needed to find the best con-figuration is predictive modeling to accurately understand the effects on future performance caused by changes to the workloads or hardware. This type of visibility is what enables the best fit between various hardware options and your specific workload requirements. In the absence of procedures or products for getting the right metrics and for per-forming predictive modeling, the expen-sive process of over-configuring hardware may be inevitable.
Summary
Storage isn’t just about space and securely storing data. The organization also absolutely requires constant and timely access to the data, which is why data storage hardware is one of the most significant budget line items.
However, the lack of ability to see— and therefore manage—the perfor-mance of workloads on storage hardware is causing organizations to experience more availability disruptions than nec-essary due to I/O bottlenecks, to spend more money on storage hardware than necessary, and to spend more time and effort than necessary resolving critical I/O performance issues.
The new storage performance man-agement best practices can overcome these issues. Effective implementation will provide significant savings and simultaneously prevent performance problems from negatively impacting business operations. Z
About the Authors
Dr. Gilbert Houtekamer is one of the owners and managing directors of IntelliMagic. He holds a Ph.D. from the Delft University of Technology, The Netherlands. He has more than 20 years of experience in I/O performance analysis, and has published extensively on this topic, including the book MVS I/O Subsystems, which he co-authored with Pat Artis. Email: [email protected] brent PHilliPs is responsible for the IntelliMagic business in the Americas. Prior to IntelliMagic, he co-founded Entact Information Security Corp., served as the president of Consul’s (acquired by IBM in 2007) U.S. operations, and had a management role at Teubner & Associates. He earned a bachelor’s degree in Computer Science from Oklahoma State University.