NH Department of Health and Human Services
Division of Public Health Services November 2013
Occupational Health Surveillance Program ‐1‐ Traumatic Injury at Work
Traumatic
Injury
at
Work
in
New
Hampshire:
Utilization
of
the
New
Hampshire
Traumatic
Emergency
Medical
Services
Information
System
Data
for
Occupational
Health
2009
to
2011
Introduction
The New Hampshire Occupational Health Surveillance Program (NH OHSP) is tasked with conducting surveillance on work-related injuries and illnesses among New Hampshire workers. These efforts can be complex, as no single database captures all work-related events or detailed information about each incident. The NH OHSP applies a public health approach to identify and address the most compelling traumatic injury risks facing workers across all industry sectors. Injury surveillance identifies, characterizes, prioritizes, and tracks injuries and fatalities. In order to provide a more comprehensive analysis on the magnitude of work-related injuries, the NH OHSP utilizes unique sources of injury data, such as the NH Trauma Emergency Medical Services Information System, or TEMSIS (1).
TEMSIS warehouses data collected by public and private Emergency Medical Services (EMS) personnel after they are called to respond to an incident. This dataset includes a field that indicates if an incident was work-related. Because the majority of private industry work-related incidents are injuries (94.8%) and not illnesses, EMS data are extremely relevant for injury surveillance. It is important to note, however, that this study represents a convenience sampling of events in a specific dataset (results show percentage of population in TEMSIS). While we cannot conclude the exact burden of overall work-related injuries in New Hampshire, information from this study will contribute toward efforts of key occupational health stakeholders in developing targeted strategies for the prevention of more traumatic work-related injuries.
Methods
TEMSIS data were obtained for years 2009 to 2011. Descriptive analysis was performed on all work-related events by gender, age, location, primary impression, and mechanism of injury. Cases that were missing any designations for any of these fields were removed. The cases were ordered by incident ID number, and duplicate entries were removed. All cases younger than 16 years and older than 65 years (assumed not to be of working age) were removed. For age analysis, cases were stratified into five age groups: 16-25, 26-35, 36-45, 46-55, and 56-65 years.
The final data set contained 2,168 cases, which were used to show overall proportions of the TEMSIS population’s injury characteristics. The most frequent response for each characteristic was examined more in-depth in order to identify any differences from the overall proportions.
Results
Table 1 shows the occurrence of work-related injuries in men and women. Men were injured most often; over 72% of the eligible cases from 2009-2011 were identified as male.
Table 1. Work-Related Injuries, by Gender
Gender Percentage Count
Male 72.1% 1564
Female 27.9% 604
Total 100.0% 2168
NH Department of Health and Human Services
Division of Public Health Services November 2013
Occupational Health Surveillance Program ‐2‐ Traumatic Injury at Work
Figure 1 shows the age-specific proportions of work-related injuries.These data show that workers aged 46-55 have a higher burden of injuries.
Figure 1. Work-Related Injuries, by Age Group (N = 2168)
the most common primary impression (48.6%).
Table 3.Work-Related Injuries, by Primary
Impression
Primary Impression Count Percent
Traumatic Injury 1053 48.6%
Pain 469 21.6%
Cardiac / Chest Pain 106 4.9%
Syncope / Fainting 57 2.6%
Back Pain (Non-Traumatic) 51 2.4%
Headache / Migraine 50 2.3%
Allergic Reaction 35 1.6%
Electrocution 29 1.3%
Seizure 29 1.3%
Heat Exhaustion / Stroke 27 1.2% Altered Level of
Consciousness 25 1.2%
All Others 237 10.9%
Total 2168 100.0%
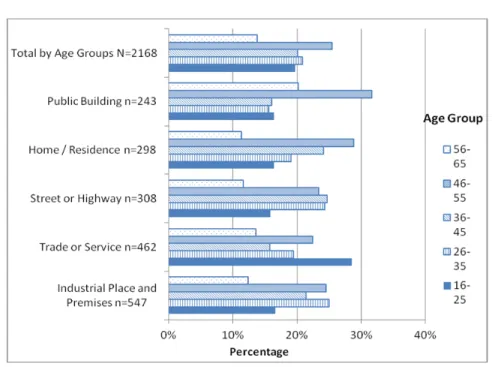
Table 2 shows the location where work-related injuries most often occurred. Industrial locations had the greatest proportion of work-related injuries (25.2%).
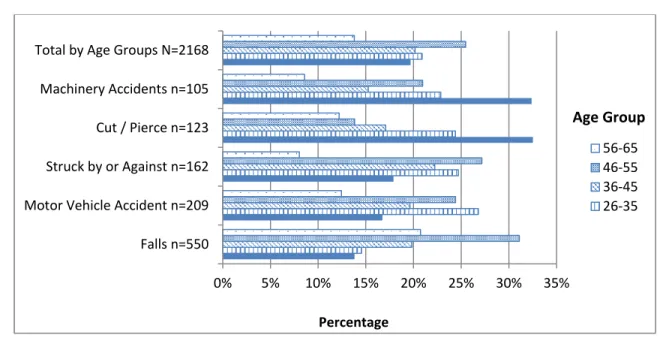
Table 4 shows the mechanism of injury. The majority of cases had no mechanism specified (37.2%), and falls were the second most common
cause of injury (25.4%).
Table 2.Work-Related Injuries, by Location
Location Count Percent
Industrial Place and Premises 547 25.2% Trade or Service (Business,
bars, restaurants, etc.) 462 21.3%
Street or Highway 308 14.2%
Home / Residence 298 13.7%
Public Building (schools,
government, offices) 243 11.2%
Health Care Facility (clinic,
hospital, nursing home) 117 5.4%
Place of Recreation or Sport 83 3.8% Other Location / Not Available 43 2.0%
Airport 24 1.1%
Farm 17 0.8%
Residential Institution (assisted
living, jail/prison) 14 0.6%
Lake, River, Ocean 9 0.4%
Airport 3 0.1%
Total 2168 100.0%
Table 4.Work-Related Injuries, by Mechanism
Table 3 shows the primary impression of the patient at the time of EMS arrival. Traumatic injuries were
Mechanism Count Percent
Falls 550 25.4%
Motor Vehicle Accident 209 9.6%
Struck by or Against 162 7.5% Cut / Pierce 123 5.7% Machinery Accidents 105 4.8% Caught in / between Objects 54 2.5% Overexertion 44 2.0% Electrocution 30 1.4%
Foreign body entering eye /
orifice 29 1.3% Assault 29 1.3% Stabbing / Cutting Accidental 26 1.2% Other/Unknown 807 37.2% Total 2168 100.0%
NH Department of Health and Human Services
Division of Public Health Services November 2013
Occupational Health Surveillance Program ‐3‐ Traumatic Injury at Work Secondary Analysis (Subpopulations)
Further exploration of sub populations compared with the overall proportions was performed. These include location, primary impression, and mechanism by age group and gender.
Figure 2 shows the overall proportions of the TEMSIS population’s primary injury characteristics by gender, defined as the most frequent response in each data field.
Figure 2.Gender Burden: Primary Injury Characteristic Sub Population Proportions Compared with Total
Figure 3 shows there were 547 work-related injury cases that occurred at industrial locations.
Workers aged 26-35 and 46-55 were injured more frequently.
Figure 3.Work-Related Injuries by Top Five Locations, by Age Group
0% 10% 20% 30% 40% 50% 60% 70% 80% 90% 100% Total n=2168 Industrial n=547 Traumatic Injury n=1053 Falls n=550 Age 46‐55 n=552 Percentage Male Female
NH Department of Health and Human Services
Division of Public Health Services November 2013
Occupational Health Surveillance Program ‐4‐ Traumatic Injury at Work
Figure 4 shows there was a total of 1,053 cases that presented with a work-related traumatic injury. In this subpopulation, there were significantly more traumatic injuries at industrial locations compared
to overall proportions. There were no significant differences in the proportions of traumatic injuries between the age-stratified groups and overall proportions.
Figure 4.Work-Related Injuries, by Top Five Primary Impression, by Age Group
Figure 5 shows there were 550 cases of work-related injuries caused by a fall. There were significantly more falls among workers aged 46-55 than the overall proportions. Although there were
significantly fewer falls at industrial locations, the majority of work-related falls occurred at service and trade locations such as restaurants and bars.
Figure 5.Work-Related Injuries, by Top Five Mechanisms, by Age Group
0% 10% 20% 30% 40% 50%
Traumatic Injury n=1053 Pain n=469 Cardiac / Chest Pain n=106 Syncope / Fainting n=57 Back Pain (Non‐Traumatic) n=51 Total by Age Group N=2168
Percentage 56‐65 46‐55 36‐45 26‐35 Age Group 0% 5% 10% 15% 20% 25% 30% 35% Falls n=550 Motor Vehicle Accident n=209 Struck by or Against n=162 Cut / Pierce n=123 Machinery Accidents n=105 Total by Age Groups N=2168
Percentage 56‐65 46‐55 36‐45 26‐35 Age Group
NH Department of Health and Human Services
Division of Public Health Services November 2013
Occupational Health Surveillance Program ‐5‐ Traumatic Injury at Work Limitations
This study is a convenience sample, not a population-based analysis. During the years of this study only about 80% of EMS agencies statewide reported to NH TEMSIS. The database does not capture all work-related injuries because not all injured workers call for emergency medical services. Recall bias is likely since EMS personnel fill in the data fields retrospectively. Finally, the analysis is limited by selection bias: records are not patient-based, but event-based.
Discussion
Acute trauma at work remains a leading cause of death and disability among U.S. workers (2). Each year occupational injuries and illnesses cause employers, workers, and society to pay tremendous costs for workers’ compensation and other insurance, medical expenses, lost wages and productivity, and the personal and societal costs associated with day to day living for injured workers.
TEMSIS data provide detailed accounts of work related incidents that are not captured in many other population-based administrative data sets. The insight gained from the NH TEMSIS reporting system can help target prevention efforts by key occupational health stakeholders in the state and can help direct more thorough study. It is important to note that the most pervasive mechanisms of injury (falls, cuts, blunt object strikes, caught in/between, and machinery accidents) are all largely preventable. Every US State and Territory collects EMS data (3). However, the data are best utilized as a resource for occupational health surveillance if it captures “work-relatedness.”
Acknowledgments
Tyler Brandow, MPH, University of New Hampshire, Master of Public Health Field Study
JoAnne Miles, Injury Surveillance Program Coordinator, Division of Public Health Services
References
1. NH TEMSIS, About Us, 2011. Accessed 2/6/13. Available online:
http://www.nhtemsis.org/default.cfm?page=about
2. National Institute for Occupational Safety and Health, http://www.cdc.gov/niosh/injury/ 3. NEMSIS TAC, National EMS Database, NEMSIS
Research Data Set v. 2.2.1, 2009 User Manual, August 2009. Accessed 2/7/13. Available Online: http://www.nemsis.org/reportingTools/documents/
NEMSISRDS2212009UserManual_000.pdf
Contact Information
Karla R. Armenti, ScD, Principal Investigator Occupational Health Surveillance Program Telephone: 603‐271‐8425
Email: [email protected]
NH Department of Health and Human Services Division of Public Health Services
Bureau of Public Health Statistics & Informatics
29 Hazen Drive
Concord, NH 03301
www.dhhs.nh.gov/dphs/hsdm/ohs
NH OHSP is supported by the National Institute for Occupational Safety and Health (NIOSH) and the Council of State and Territorial Epidemiologists (CSTE). This project was supported by Grant # 5U60OH009853-02 from CDC-NIOSH. Its contents are solely the responsibility of the authors and do not necessarily represent the official views of NIOSH.